Small business failure statistics start with one hard number. Of the 569,387 US establishments that opened in the year to March 1994, 71,595 were still open in March 2025 (Bureau of Labor Statistics, Mar 2025). That is a long window, and the first five years do most of the damage.
This page is for owners of HVAC and home service shops with 1 to 10 techs, and for anyone who needs the numbers. Most of the data covers all small businesses or all of construction, not HVAC alone, and the text says which. Where the Census Bureau splits out building equipment contractors, the group that holds HVAC, we show it. For the wider market, see HVAC industry statistics.
Closing is not the same as going broke, and the tables count both. A shop that shuts when its owner retires counts as closed too. So we also show profit, cash pressure, credit and bankruptcy. Small businesses employ 62.3 million people, which is 45.9 percent of private sector workers (SBA Office of Advocacy, Feb 2026). Updated November 2026. The newest data is from October 2026.
Key Takeaways
- Five-year survival for construction startups ran from 33.2% for the 2006 cohort to 59.8% for the 2017 cohort. (Bureau of Labor Statistics, Mar 2025)
- On average from 1994 to 2022, 49.2% of new employer establishments survived five years. (SBA Office of Advocacy, Feb 2026)
- In 2023, about 1.3 million US establishments opened and about 1.2 million closed. (SBA Office of Advocacy, Feb 2026)
- Building equipment contractors, the group that holds HVAC, closed 8.4% of establishments in 2023, against 11.1% across construction. (U.S. Census Bureau, Sep 2025) (U.S. Census Bureau, Sep 2025)
- Establishments of firms with 1 to 4 employees closed at 16.1% in 2023, against 3.7% for firms with 5 to 9 employees. (U.S. Census Bureau, Sep 2025)
- 34% of employer firms were operating at a loss at the end of 2024, and 47% were at a profit. (Federal Reserve Banks, Small Business Credit Survey, Mar 2026)
- 34% of employer firms applied for financing and did not get the full amount. (Federal Reserve Banks, Small Business Credit Survey, Mar 2026)
- Of 3,368,860 construction sole proprietorships, 2,686,466 reported net income for tax year 2023. (Internal Revenue Service, Jul 2026)
- 68% of small firms active in 2019 were still in business at the end of 2024. (JPMorganChase Institute, Jul 2025)
- Business bankruptcy filings were 26,941 in the 12 months to 30 June 2026, up from 23,043 a year earlier. (U.S. Courts, Jun 2026) (U.S. Courts, Jun 2025)
- US business applications reached 5,671,836 in 2025, against 3,498,990 in 2019. (U.S. Census Bureau, Oct 2026)
- In the two weeks to 20 September 2026, 47.1% of US businesses paid more for goods and services, while 17.6% charged more. (U.S. Census Bureau, Oct 2026)
- Banks left standards for loans to firms of all sizes basically unchanged in July 2026, yet 40% of SBA loan and line of credit applicants were denied. (Federal Reserve Board, Aug 2026) (Federal Reserve Banks, Small Business Credit Survey, Mar 2026)
Do most new businesses survive?
About half of new businesses do not reach year five, and the loss is front-loaded. The odds at birth have moved only a few points in 30 years, so a startup in 2026 faces about the same risk as one in 1996.
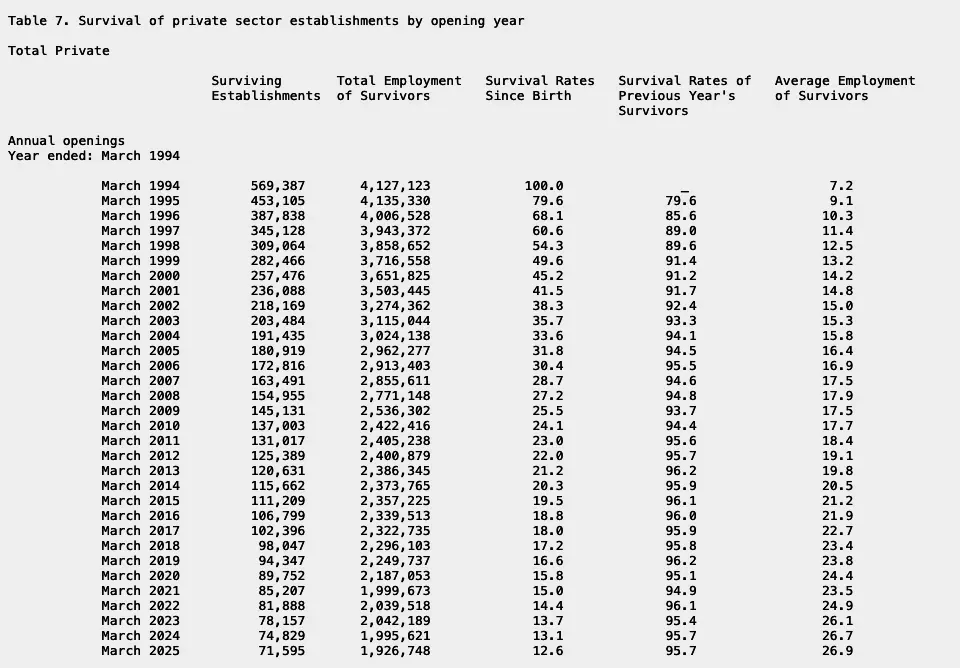 Figure 1: Of 569,387 establishments opened in the year to March 1994, the survival rate since birth falls from 79.6% after one year to 49.6% after five and 12.6% after 31 years, while the average staff of survivors grows from 7.2 to 26.9. Source: Bureau of Labor Statistics, Business Employment Dynamics, Table 7, Mar 2025. Screenshot of an Internet Archive copy of the source file, captured 20 Oct 2026, because bls.gov blocks automated capture.
How many new businesses survive the first year?
About four in five. The first year is the cheapest year to lose.
- Of the 988,310 establishments that opened in the year to March 2024, 77.9% were still open a year later (Bureau of Labor Statistics, Mar 2025).
- The cohort that opened in the year to March 2020 did better, with 80.9% open after one year (Bureau of Labor Statistics, Mar 2025).
- From 1994 to 2022, an average of 67.7% of new employer establishments lasted at least two years (SBA Office of Advocacy, Feb 2026).
How many new businesses survive five years?
About half. The range across 27 cohorts is narrow.
- Of the 679,797 establishments opened in the year to March 2005, 46.8% were open five years later (Bureau of Labor Statistics, Mar 2025).
- The 2015 cohort of 677,876 openings reached 50.2% at year five (Bureau of Labor Statistics, Mar 2025).
- Across cohorts opened from 1994 to 2020, five-year survival ran from 45.4% for the 2006 cohort to 51.9% for the 2018 cohort (Bureau of Labor Statistics, Mar 2025).
How many businesses last ten years or more?
About one in three reach year ten, and the risk then drops sharply.
- The 2010 cohort stood at 35.3% after ten years (Bureau of Labor Statistics, Mar 2025), and the 2015 cohort at 34.7% (Bureau of Labor Statistics, Mar 2025).
- From 1994 to 2022, an average of 33.9% of new establishments survived ten years (SBA Office of Advocacy, Feb 2026).
- Of establishments that reach year five, 69.5% reach year ten (SBA Office of Advocacy, Feb 2026).
- Of those that reach year ten, 76.1% reach year fifteen (SBA Office of Advocacy, Feb 2026).
- In the 1994 cohort, between 93.7% and 96.2% of survivors made it through each year after year ten (Bureau of Labor Statistics, Mar 2025).
- The 2005 cohort was down to 19.5% after 20 years (Bureau of Labor Statistics, Mar 2025).
Do the survivors grow?
Yes. The shops that last add people.
- Surviving establishments from the 1994 cohort grew from 7.2 staff on average to 26.9 (Bureau of Labor Statistics, Mar 2025).
- The 2024 cohort started at 3.5 staff on average and stood at 4.4 a year later (Bureau of Labor Statistics, Mar 2025).
What is the construction business failure rate?
Construction is a boom and bust trade. The housing crash gave the worst startup odds in the table, and the last ten years gave better odds than the all-industry rate. For output, firms and jobs across the trade, see construction industry statistics.
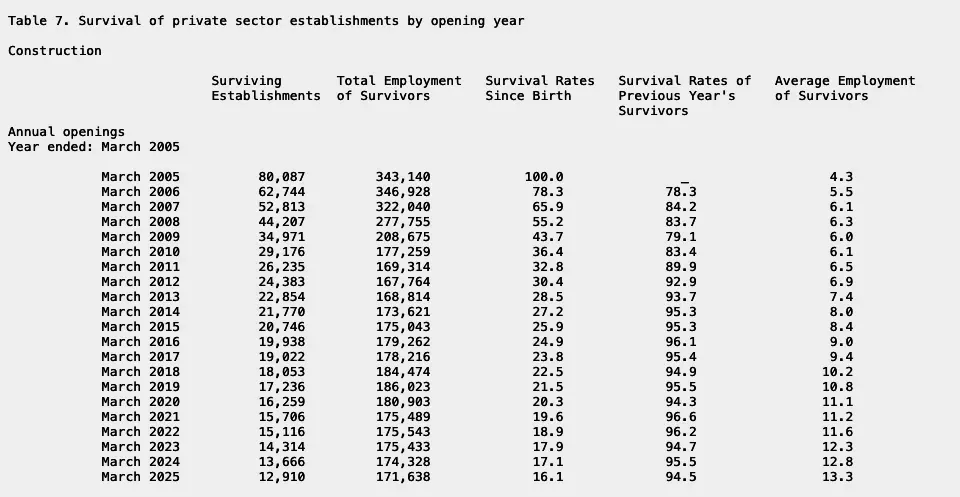 Figure 2: Of 80,087 construction establishments opened in the year to March 2005, survival since birth fell to 43.7% by year four and 16.1% by year twenty, as the housing bust cut the survivors’ own survival rate to 79.1% in March 2009. Source: Bureau of Labor Statistics, Business Employment Dynamics, Table 7 for construction, Mar 2025. Screenshot of an Internet Archive copy of the source file, captured 20 Oct 2026, because bls.gov blocks automated capture.
How many construction startups last five years?
In the 2005 cohort, more than half were gone by year four.
- Of 80,087 construction establishments opened in the year to March 2005, 78.3% were open after one year and 65.9% after two (Bureau of Labor Statistics, Mar 2025).
- In that cohort 55.2% were open after three years, and 43.7% after four (Bureau of Labor Statistics, Mar 2025).
- Only 79.1% of the survivors in March 2008 were still open in March 2009 (Bureau of Labor Statistics, Mar 2025).
- After ten years, 25.9% of that cohort remained, and after 20 years, 16.1% (Bureau of Labor Statistics, Mar 2025).
- The survivors grew from 4.3 staff on average to 13.3 (Bureau of Labor Statistics, Mar 2025).
Did the housing bust change the odds?
Yes. Openings peaked in the bubble and then collapsed.
- Construction openings peaked at 86,247 in the year to March 2006 (Bureau of Labor Statistics, Mar 2025) and fell to 40,927 in the year to March 2010 (Bureau of Labor Statistics, Mar 2025).
- Only 64.5% of the 2008 cohort lasted a year, the lowest first-year rate in the table (Bureau of Labor Statistics, Mar 2025).
- By the 2015 cohort, 83.3% lasted a year, 57.5% lasted five years and 42.6% lasted ten (Bureau of Labor Statistics, Mar 2025).
- The 2020 cohort of 57,753 openings had 56.5% still open in March 2025 (Bureau of Labor Statistics, Mar 2025).
- In the year to March 2024, 64,892 construction establishments opened, and 79.7% were open a year later (Bureau of Labor Statistics, Mar 2025).
Which construction trades close the most?
Not all trades close at the same speed. The Census Bureau counts closings by industry group.
- In 2023, 77,211 construction establishments closed (U.S. Census Bureau, Sep 2025).
- That year 64,629 construction firms exited, and 237,743 jobs were tied to them (U.S. Census Bureau, Sep 2025).
- Construction had the sixth highest closing rate of 19 sector groups (U.S. Census Bureau, Sep 2025).
- Building construction (NAICS 236) closed 13.4% of establishments, the highest of the construction groups (U.S. Census Bureau, Sep 2025).
- Heavy and civil engineering (NAICS 237) closed 8.2% (U.S. Census Bureau, Sep 2025).
- Specialty trade contractors (NAICS 238) closed 10.2% and numbered 442,786 firms (U.S. Census Bureau, Sep 2025).
What do HVAC business success statistics 2026 look like?
HVAC sits in the building equipment group, which closes less often than the other specialty trades. The group also holds plumbing and electrical work, so the numbers are not HVAC alone.
- The Census Bureau lists heating, ventilation and air-conditioning contractors under NAICS 238220, in the 2382 group of building equipment contractors (U.S. Census Bureau, Dec 2021).
- That group had 177,201 firms and 2,369,218 jobs in 2023 (U.S. Census Bureau, Sep 2025).
- Its sister groups closed more: foundation and exterior contractors 11.5%, building finishing contractors 12.0%, and other specialty trades 10.4% (U.S. Census Bureau, Sep 2025).
- New establishments entered the group at 10.5% in 2023, ahead of its closings (U.S. Census Bureau, Sep 2025).
- Its closing rate was 7.9% in 2019 (U.S. Census Bureau, Sep 2025).
- Its firm exits rose from 9,617 in 2019 to 12,921 in 2023 (U.S. Census Bureau, Sep 2025).
How many businesses open and close each year?
Closing is normal. In most years nearly as many businesses close as open, so the churn is large and the net change is small.
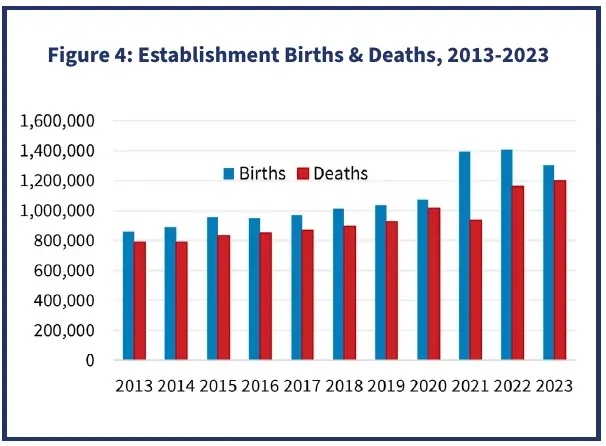 Figure 3: Establishment births stayed above deaths every year from 2013 to 2023, but the gap narrowed after the 2021 and 2022 start-up surge as deaths climbed. Source: SBA Office of Advocacy, Frequently Asked Questions About Small Business, Feb 2026. Chart published by the source, rendered from page 3 of its PDF and cropped, captured 20 Oct 2026.
How often do establishments open and close?
The closing rate has crept up since before the pandemic.
- Startups made up 14.2% of business establishments in 2023, up from 12.5% in 2019 (SBA Office of Advocacy, Feb 2026).
- The Census Bureau puts the 2023 establishment closing rate at 9.4%, against 8.5% in 2019 (U.S. Census Bureau, Sep 2025).
- The entry rate in 2023 was 10.6% (U.S. Census Bureau, Sep 2025).
- The closing rate peaked at 10.1% in 2021 (U.S. Census Bureau, Sep 2025).
How many firms exit?
More firms exit than before the pandemic, and the gap is wide.
- 523,958 US firms exited in 2023, up from 404,886 in 2019 (U.S. Census Bureau, Sep 2025).
- Those exits came out of 5,593,727 firms in 2023 (U.S. Census Bureau, Sep 2025).
- In the first quarter of 2025, 284,000 establishments closed and 809,000 jobs were lost (Bureau of Labor Statistics, Jul 2026).
- In the fourth quarter of 2025 there were 338,000 establishment births, which accounted for 1,006,000 jobs (Bureau of Labor Statistics, Jul 2026).
- Gross job losses from contracting and closing establishments were 7.2 million that quarter, against 7.8 million gains from expanding and opening ones (Bureau of Labor Statistics, Jul 2026).
Did the pandemic change how often firms close?
Aid may have delayed some closings. The exit rate then jumped.
- Among small firms active in 2019, the yearly exit rate was 7.5% in 2020, 5.5% in 2021, 10.1% in 2022, 8.0% in 2023 and 6.6% in 2024 (JPMorganChase Institute, Jul 2025).
- The median life expectancy for small businesses in that bank sample has hovered around five years (JPMorganChase Institute, Jul 2025).
- The median firm in that group was four years old in 2019 (JPMorganChase Institute, Jul 2025).
Are new and tiny shops the ones that close?
Closing risk is not spread evenly. It piles up on shops in their first two years and on shops with fewer than five people.
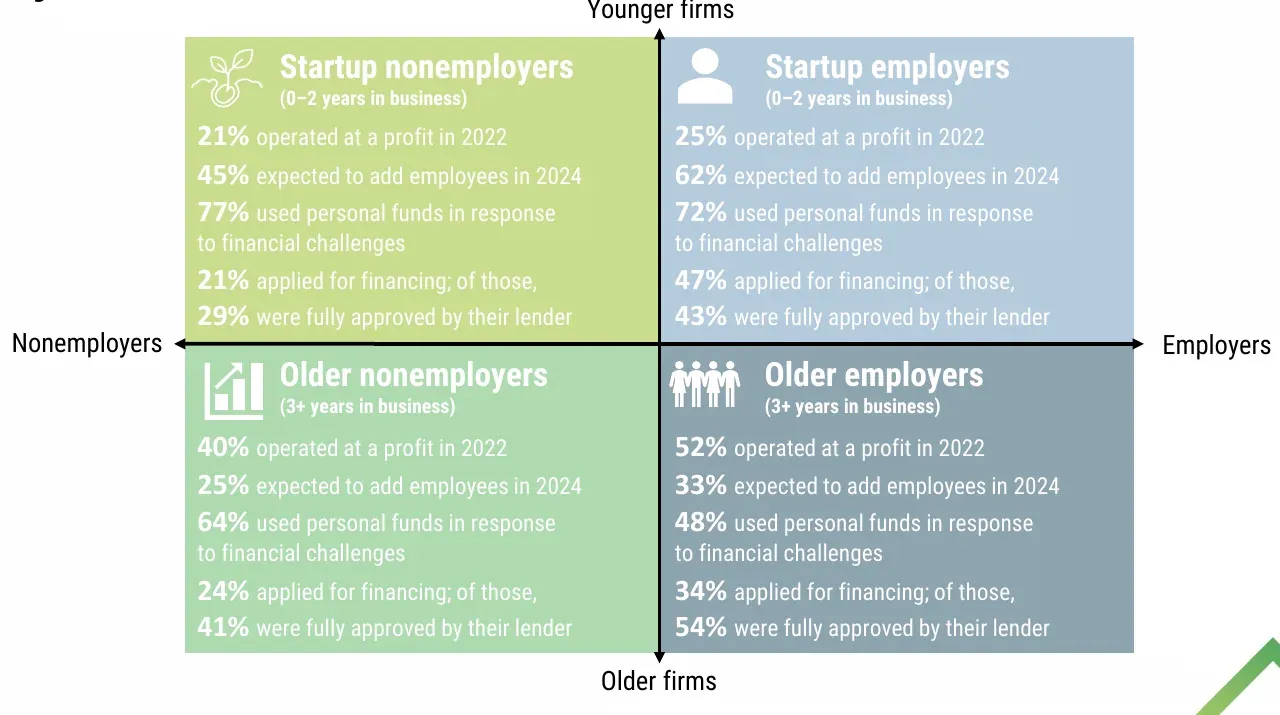 Figure 4: In 2022, startup firms of 0 to 2 years were less likely to be at a profit than older firms, at 25% against 52% for employers and 21% against 40% for nonemployers, and they leaned harder on owner money. Source: Federal Reserve Banks, 2024 Report on Startup Firms, Dec 2024. Slide of the source report, rendered from its PDF and cropped, captured 20 Oct 2026.
How does the closing rate change with age?
It falls fast in the first five years and then flattens.
- Establishments of firms in their first year after opening closed at 25.7% across the economy in 2023 (U.S. Census Bureau, Sep 2025) and at 28.1% in construction (U.S. Census Bureau, Sep 2025).
- At firm age 2, the rates were 18.1% for the economy and 18.6% for construction (U.S. Census Bureau, Sep 2025), (U.S. Census Bureau, Sep 2025).
- At firm age 5, they were 11.5% and 12.1% (U.S. Census Bureau, Sep 2025), (U.S. Census Bureau, Sep 2025).
- At 26 years and older they were 7.1% and 7.8% (U.S. Census Bureau, Sep 2025), (U.S. Census Bureau, Sep 2025).
How does size change the closing rate?
Size is the sharper line.
- In construction, establishments of firms with 1 to 4 employees closed at 16.5% in 2023, against 2.2% for firms with 5 to 9 employees (U.S. Census Bureau, Sep 2025).
- Firms with 10 to 19 employees closed 1.6% and firms with 20 to 99 employees closed 1.4% (U.S. Census Bureau, Sep 2025).
- Across the economy the same two classes closed 2.9% and 2.7% (U.S. Census Bureau, Sep 2025).
- In 2023, 440,449 construction firms had 1 to 4 employees, and 60,789 firms of that size exited (U.S. Census Bureau, Sep 2025).
Do young firms make money?
Few do. Profit rises with age.
- Among employer firms 0 to 2 years old, 25% were at a profit at the end of 2024 and 55% at a loss (Federal Reserve Banks, Small Business Credit Survey, Mar 2026).
- Among firms 3 to 5 years old, 42% were at a profit (Federal Reserve Banks, Small Business Credit Survey, Mar 2026), and among firms 21 years and older, 60% (Federal Reserve Banks, Small Business Credit Survey, Mar 2026).
- In the startup report, 62% of employer startups expected to add employees, and 43% of startup employers that applied for financing were fully approved, against 54% of older employers (Federal Reserve Banks, Small Business Credit Survey, Dec 2024).
- 77% of nonemployer startups and 72% of employer startups used personal funds to meet financial challenges (Federal Reserve Banks, Small Business Credit Survey, Dec 2024).
How many small businesses make money?
Staying open and making money are different tests. Many shops stay open at break-even or at a loss, and the survey shows how many.
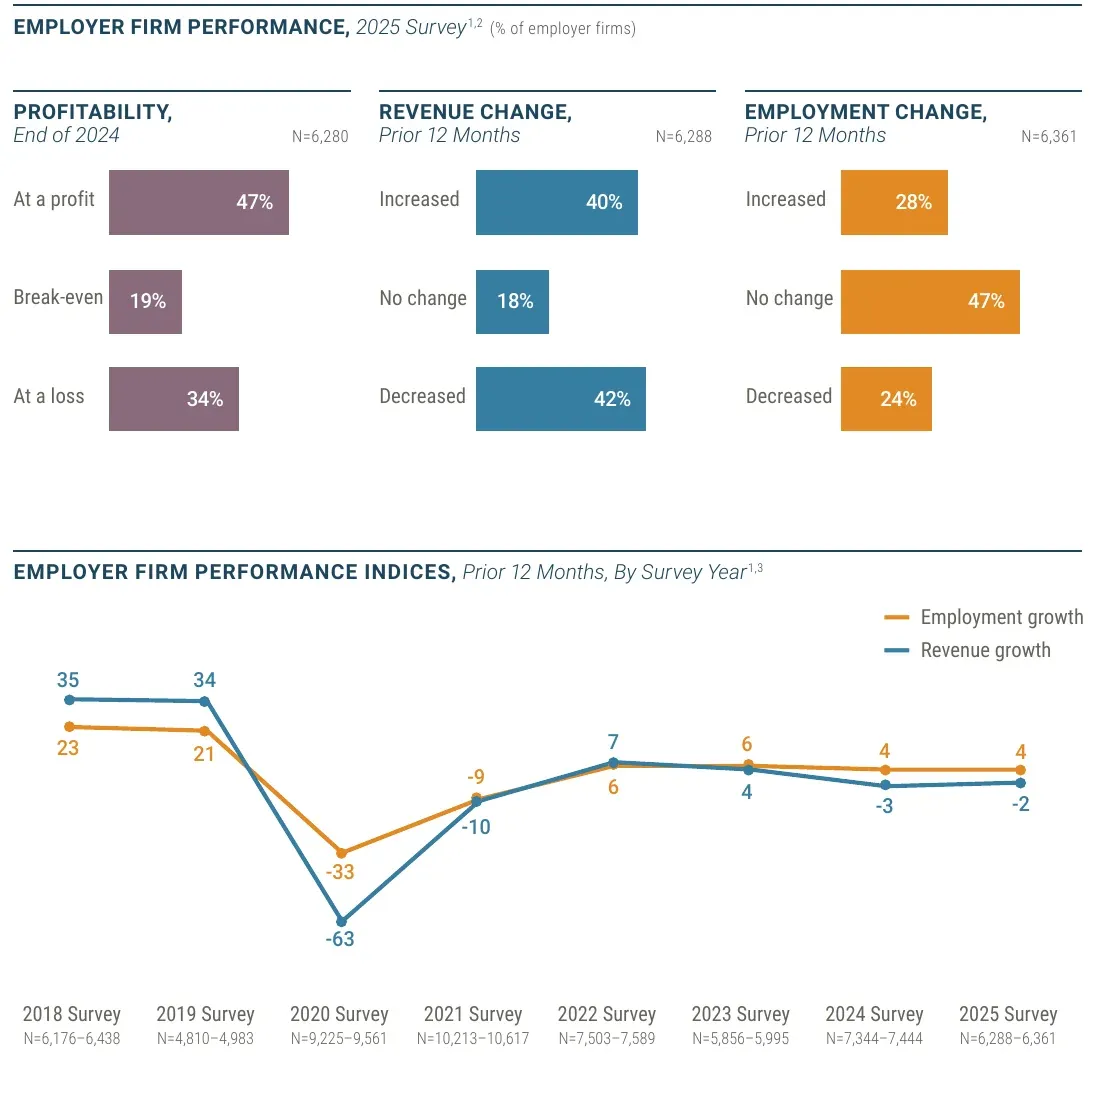 Figure 5: Just under half of employer firms were at a profit at the end of 2024, and the revenue growth index slid from 35 in the 2018 survey to minus 63 in 2020 and has sat near zero since 2022. Source: Federal Reserve Banks, 2026 Report on Employer Firms, Mar 2026. Chart published by the source, rendered from page 7 of its PDF and cropped, captured 20 Oct 2026.
How many employer firms are profitable?
Fewer than half. One in five only breaks even.
- 19% of employer firms broke even at the end of 2024 (Federal Reserve Banks, Small Business Credit Survey, Mar 2026).
- 40% saw revenue rise in the prior 12 months, and 42% saw it fall (Federal Reserve Banks, Small Business Credit Survey, Mar 2026).
- 28% added employees, and 24% cut them (Federal Reserve Banks, Small Business Credit Survey, Mar 2026).
- The revenue growth index stood at minus 2 in the 2025 survey (Federal Reserve Banks, Small Business Credit Survey, Mar 2026).
- 22% of employer firms rated their financial condition poor and 35% rated it fair (Federal Reserve Banks, Small Business Credit Survey, Mar 2026).
Does firm size change profit?
Yes. Bigger firms make money more often.
- Among firms with 1 to 4 employees, 43% were at a profit and 36% at a loss (Federal Reserve Banks, Small Business Credit Survey, Mar 2026).
- Among firms with 5 to 9 employees, 43% were at a profit and 39% at a loss (Federal Reserve Banks, Small Business Credit Survey, Mar 2026).
- Among firms with 10 to 19 employees, 52% were at a profit (Federal Reserve Banks, Small Business Credit Survey, Mar 2026).
- Among firms with 20 to 49 employees, 59% were at a profit (Federal Reserve Banks, Small Business Credit Survey, Mar 2026).
- Among firms with 50 to 499 employees, 73% were at a profit and 17% at a loss (Federal Reserve Banks, Small Business Credit Survey, Mar 2026).
How do the trades compare?
The group that includes construction does better than retail and leisure firms. Specialty trade sole proprietors also report net income more often than the average.
- In the Fed’s group that includes construction, 48% of employer firms were at a profit, 20% broke even and 32% were at a loss (Federal Reserve Banks, Small Business Credit Survey, Mar 2026).
- Revenue fell for 47% of that group and rose for 34% (Federal Reserve Banks, Small Business Credit Survey, Mar 2026).
- Other groups did worse: 38% of retail firms and 33% of leisure and hospitality firms were at a profit (Federal Reserve Banks, Small Business Credit Survey, Mar 2026).
- Professional services and real estate did better at 59%, and finance and insurance at 70% (Federal Reserve Banks, Small Business Credit Survey, Mar 2026).
- Among specialty trade contractors, 2,002,699 of 2,521,516 sole proprietorships reported net income (Internal Revenue Service, Jul 2026).
- Across all nonfarm industries it was 21,411,462 of 31,125,909, and in accommodation and food services 415,570 of 738,481 (Internal Revenue Service, Jul 2026).
What problems do owners name?
Owners name sales and staff before they name rent or rules. Then comes the cost of everything they buy.
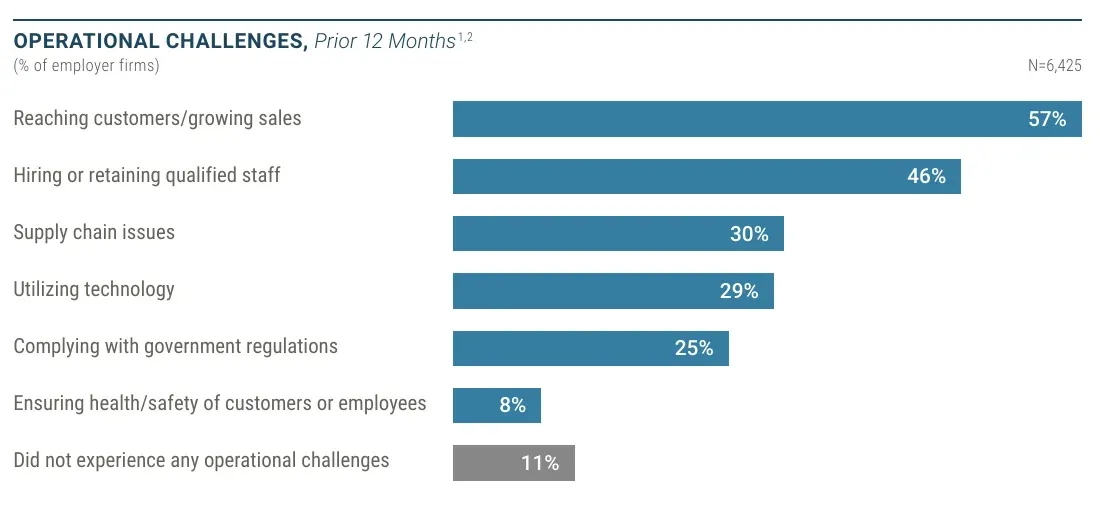 Figure 6: Reaching customers and growing sales is the top operational problem for employer firms at 57%, ahead of hiring and keeping qualified staff at 46%, and only 11% report no operational challenge. Source: Federal Reserve Banks, 2026 Report on Employer Firms, Mar 2026. Chart published by the source, rendered from page 9 of its PDF and cropped, captured 20 Oct 2026.
What operational problems come up most?
Finding work comes first, then finding people.
- 30% named supply chain issues, 29% utilizing technology and 25% complying with government regulations (Federal Reserve Banks, Small Business Credit Survey, Mar 2026).
- 8% named ensuring the health and safety of customers or employees (Federal Reserve Banks, Small Business Credit Survey, Mar 2026).
- In the group that includes construction, 50% named reaching customers and 47% named hiring or retaining qualified staff (Federal Reserve Banks, Small Business Credit Survey, Mar 2026).
- In that group 39% named supply chain issues and 28% named complying with regulations (Federal Reserve Banks, Small Business Credit Survey, Mar 2026).
What financial problems come up most?
Costs lead, and tariffs add to them. For what customers pay, see pricing statistics.
- In the group that includes construction, 76% named rising costs of goods, services or wages (Federal Reserve Banks, Small Business Credit Survey, Mar 2026).
- 49% named costs tied to tariffs, and 47% named weak sales (Federal Reserve Banks, Small Business Credit Survey, Mar 2026).
- 37% named credit availability, and 32% named debt payments or interest rates (Federal Reserve Banks, Small Business Credit Survey, Mar 2026).
- Only 5% reported no financial challenge (Federal Reserve Banks, Small Business Credit Survey, Mar 2026).
What did owners do about it?
They used reserves and raised prices.
- In the same group, 48% used cash reserves and 48% raised the prices they charge (Federal Reserve Banks, Small Business Credit Survey, Mar 2026).
- 47% reduced costs, and 30% downsized operations (Federal Reserve Banks, Small Business Credit Survey, Mar 2026).
How do construction firms rate themselves right now?
Most say average or better, but a fifth see hours falling.
- In the Census Bureau’s survey, 15.4% of construction firms rated current performance excellent and 21.4% above average (U.S. Census Bureau, Oct 2026).
- 14.5% rated it below average and 3.3% poor (U.S. Census Bureau, Oct 2026).
- Hours worked fell at 20.3% of construction firms and rose at 7.4%, in the two weeks to 20 September 2026 (U.S. Census Bureau, Oct 2026).
- In the same two weeks, the number of paid employees fell at 11.8% and rose at 6.0% (U.S. Census Bureau, Oct 2026).
- Delivery times from suppliers rose at 11.0% (U.S. Census Bureau, Oct 2026).
- Looking six months out, 12.4% expect below average performance and 4.0% expect poor (U.S. Census Bureau, Oct 2026).
- Across all US businesses, 6.8% reported money lost to extreme weather in the past six months (U.S. Census Bureau, Oct 2026).
Can small firms get the credit they need?
Credit is there, but not evenly. Approval swings by product and by lender, and one in three firms still ends up short. Slow-paying customers add to the strain, as late payment statistics show.
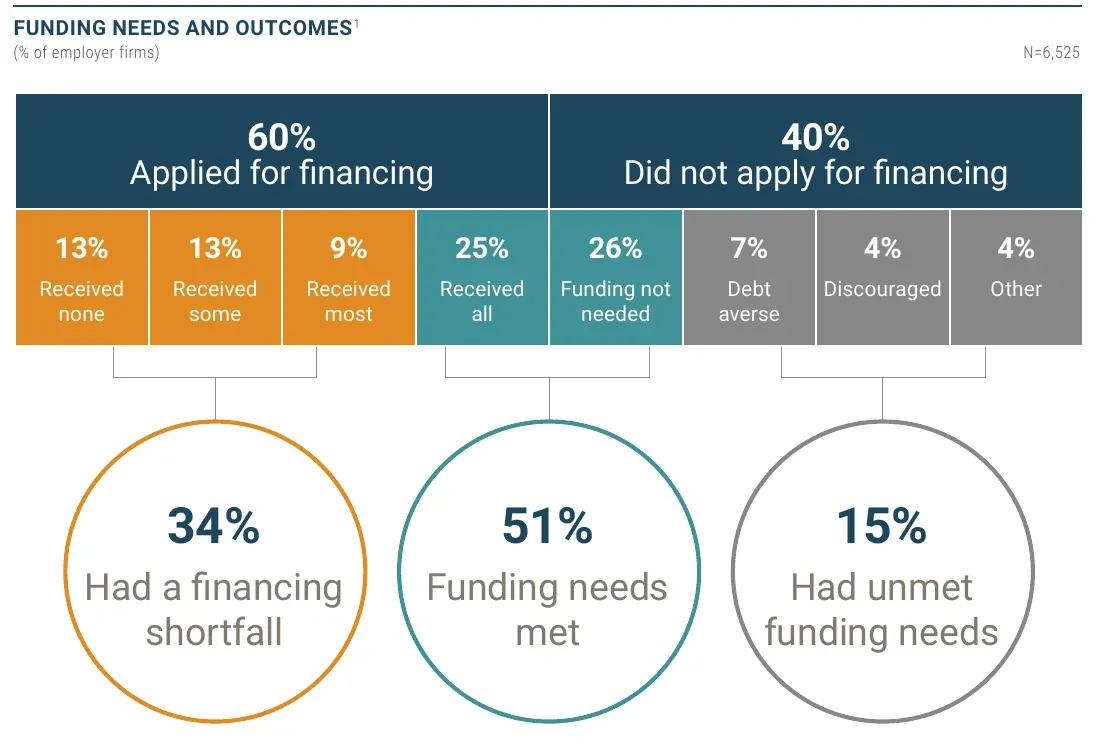 Figure 7: 60% of employer firms applied for financing and 40% did not, and the survey sorts them into 51% whose needs were met, 34% with a shortfall and 15% with unmet needs. Source: Federal Reserve Banks, 2026 Report on Employer Firms, Mar 2026. Chart published by the source, rendered from page 18 of its PDF and cropped, captured 20 Oct 2026.
How many firms get the funding they need?
About half have their funding needs met.
- 13% of employer firms applied and received none, 13% received some and 9% received most (Federal Reserve Banks, Small Business Credit Survey, Mar 2026).
- 25% received all they sought, and 26% did not need funding (Federal Reserve Banks, Small Business Credit Survey, Mar 2026).
- Of firms that did not apply, 63% said they did not need it, 17% were debt averse, 10% were discouraged and 7% said credit cost too much (Federal Reserve Banks, Small Business Credit Survey, Mar 2026).
Who gets approved?
Half of applicants are fully approved, and the rest are not.
- In the 2025 survey, 52% of applicants for loans, lines of credit or cash advances were fully approved, 29% partly and 19% denied (Federal Reserve Banks, Small Business Credit Survey, Mar 2026).
- In the 2021 survey, 34% of applicants were denied (Federal Reserve Banks, Small Business Credit Survey, Mar 2026).
- 32% of applicants for an SBA loan or line were fully approved (Federal Reserve Banks, Small Business Credit Survey, Mar 2026).
- 45% of business line of credit applicants and 37% of business loan applicants were fully approved (Federal Reserve Banks, Small Business Credit Survey, Mar 2026).
- 57% of applicants at small banks were fully approved (Federal Reserve Banks, Small Business Credit Survey, Mar 2026).
- Denied firms named strict lender requirements (46%), too much debt already (37%), low credit score (30%) and weak sales (29%) (Federal Reserve Banks, Small Business Credit Survey, Mar 2026).
What does debt cost now?
Money is not cheap, but banks say they are not tightening.
- The bank prime loan rate was 7.00 percent in the Federal Reserve’s 19 October 2026 release (Federal Reserve Board, Oct 2026).
- Banks said standards have eased across all commercial and industrial loan types since July 2025, and that demand from small firms was basically unchanged (Federal Reserve Board, Aug 2026).
- Across all US businesses, interest rate changes cut profitability at 28.5% in the past six months (U.S. Census Bureau, Oct 2026).
- 4.5% could not service debt, 4.6% could not refinance and 9.5% could not invest in the business (U.S. Census Bureau, Oct 2026).
- 31% of employer firms had no debt, up from 21% in the 2020 survey (Federal Reserve Banks, Small Business Credit Survey, Mar 2026).
- 59% of debtholders backed their debt with a personal guarantee (Federal Reserve Banks, Small Business Credit Survey, Mar 2026).
- 60% of borrowers from online lenders said costs came in higher than expected, and 4% said lower (Federal Reserve Banks, Small Business Credit Survey, Mar 2026).
How many businesses file for bankruptcy?
Bankruptcy is the rare end of the road, but it is the one the courts count exactly. Business filings are now above the level before the pandemic.
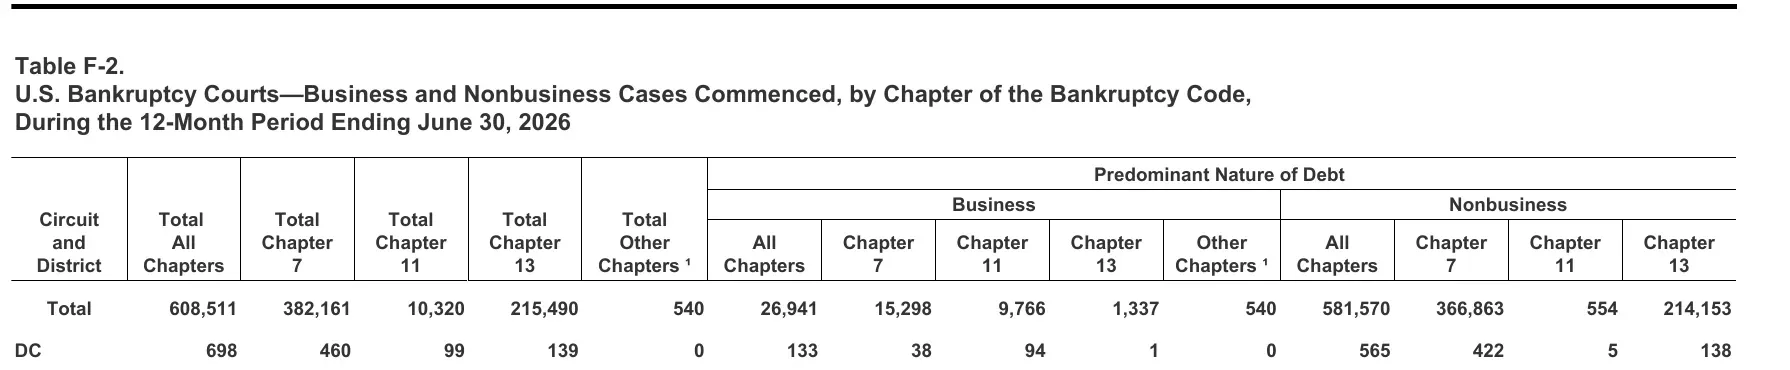 Figure 8: In the 12 months to 30 June 2026 the courts logged 608,511 bankruptcy cases, of which 26,941 were business cases, split into Chapter 7, Chapter 11 and Chapter 13. Source: U.S. Courts, Table F-2, Jun 2026. Table published by the source, rendered from page 1 of its PDF and cropped, captured 20 Oct 2026.
How many business bankruptcies were filed?
The count has come back up from the pandemic low.
- Business filings were 22,780 in the 12 months to 31 December 2019 (U.S. Courts, Dec 2019).
- They fell to 14,347 in the 12 months to 31 December 2021 (U.S. Courts, Dec 2021).
- All bankruptcy filings, business and personal, were 608,511 in the 12 months to 30 June 2026, up 12.2% from 542,529 (U.S. Courts, Jun 2026).
- Personal and other nonbusiness cases made up 581,570 of the 2026 total (U.S. Courts, Jun 2026).
Which chapters do businesses file under?
Chapter 11 has grown fastest.
- In the 12 months to 30 June 2026, business filings were 15,298 under Chapter 7, 9,766 under Chapter 11 and 1,337 under Chapter 13 (U.S. Courts, Jun 2026).
- Business Chapter 11 filings were 7,900 a year earlier (U.S. Courts, Jun 2025), 6,052 in 2019 (U.S. Courts, Dec 2019) and 4,366 in 2021 (U.S. Courts, Dec 2021).
- Business Chapter 7 filings were 13,314 a year earlier (U.S. Courts, Jun 2025), 14,215 in 2019 (U.S. Courts, Dec 2019) and 8,678 in 2021 (U.S. Courts, Dec 2021).
How many new businesses are starting?
People keep starting businesses. Applications are well above where they stood before the pandemic, and most of them never become employers.
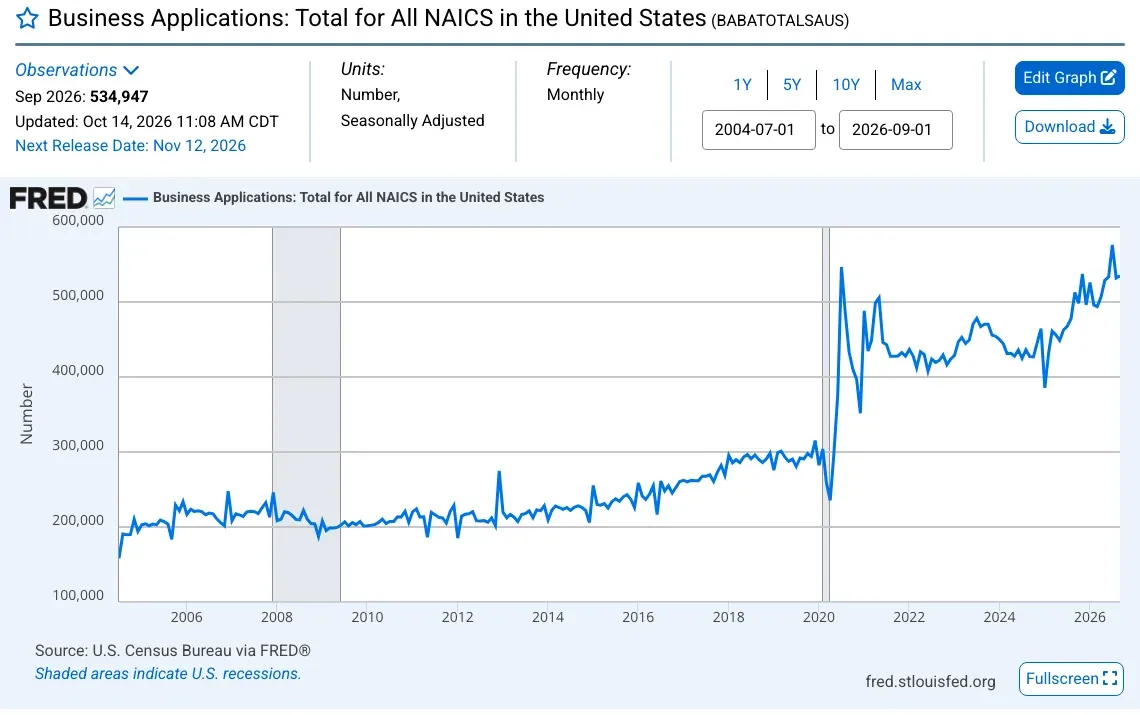 Figure 9: Monthly business applications jumped in 2020 and have stayed above their old range ever since, reaching 534,947 in September 2026. Source: U.S. Census Bureau, Business Applications, retrieved from FRED, Sep 2026. Screenshot of the source page, captured 20 Oct 2026.
How many applications are filed?
More than half a million a month.
- Seasonally adjusted applications for September 2026 were 534,947, up 0.5% from August (U.S. Census Bureau, Oct 2026).
- Applications were 5,224,176 in 2024 (U.S. Census Bureau, Oct 2026).
- High-propensity applications, the kind most likely to become employers, were 1,708,842 in 2025, against 1,316,191 in 2019 (U.S. Census Bureau, Oct 2026).
How many are in construction?
About one in ten applications.
- Construction applications were 519,090 in 2025 and 522,048 in 2024 (U.S. Census Bureau, Oct 2026).
- They were 382,136 in 2019 (U.S. Census Bureau, Oct 2026).
How many applications become employer businesses?
Few do.
- In 2019, 280,266 applications became employer businesses within four quarters (U.S. Census Bureau, Oct 2026).
- In construction, 34,069 did (U.S. Census Bureau, Oct 2026).
- The Census Bureau projects 29,022 formations within four quarters from the September 2026 applications (U.S. Census Bureau, Oct 2026).
How big is small business in America?
Most small businesses have no staff. That changes what closing means: a one-person shop that stops is a closed business, not a mass layoff.
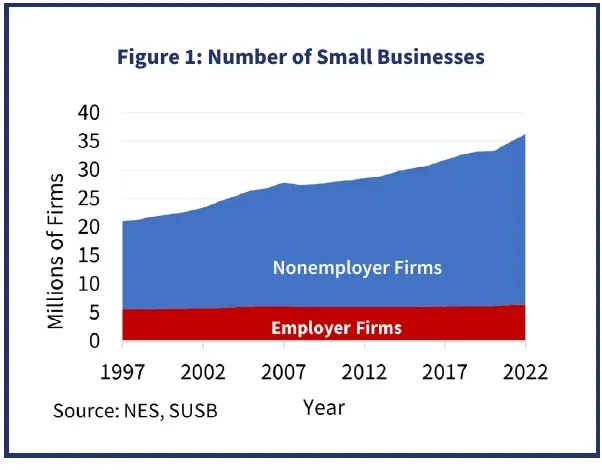 Figure 10: Nonemployer firms drive nearly all the growth in the number of US small businesses, while employer firms stay near 6 million. Source: SBA Office of Advocacy, Frequently Asked Questions About Small Business, Feb 2026. Chart published by the source, rendered from page 1 of its PDF and cropped, captured 20 Oct 2026.
How many small businesses have no employees?
Almost all of them. The next lines show the count and what small firms add up to.
- There were 29,811,495 nonemployer firms in 2022 (SBA Office of Advocacy, Feb 2026).
- The count nearly doubled from 15.4 million in 1997 (SBA Office of Advocacy, Feb 2026).
- Small businesses pay 38.7% of private sector payroll, which is $3.5 trillion (SBA Office of Advocacy, Feb 2026).
- Small businesses make up 99.7% of firms with paid employees (SBA Office of Advocacy, Feb 2026).
How are small businesses owned and set up?
Mostly as sole proprietorships and family firms.
- 26.1% of employer firms were family-owned in 2022 (SBA Office of Advocacy, Feb 2026).
- 86.7% of nonemployer firms are sole proprietorships, against 12.3% of small employers (SBA Office of Advocacy, Feb 2026).
- 55% of small employer firms are S corporations (SBA Office of Advocacy, Feb 2026).
- Federal paperwork cost small businesses over $81 billion in 2025 (SBA Office of Advocacy, Feb 2026).
- Small businesses produce 43.5% of gross domestic product (SBA Office of Advocacy, Feb 2026).
Methodology and Sources
We took each number from the agency or research body that produced it, and each link goes to the report or data file. We do not use roundups. Survival and closing figures differ by source because the series count different things: the Bureau of Labor Statistics counts establishments by opening year, the Census Bureau reports yearly entry and exit rates, and the JPMorganChase Institute tracks bank customers. We do not mix them in one claim. Survey figures from the Federal Reserve Banks come from a sample of firms, weighted by the Reserve Banks, and are shares of employer firms unless a line says nonemployer. Some tables came from files that sites would not serve to a script: the two Bureau of Labor Statistics survival tables were read and checked against Internet Archive copies of the same files. Calculated values are marked in the text, such as the range of five-year survival across cohorts. The page is checked and updated every month.
Glossary
- BED: Business Employment Dynamics, the Bureau of Labor Statistics series on openings and closings.
- BDS: Business Dynamics Statistics, the Census Bureau series on firm and establishment entry and exit.
- BFS: Business Formation Statistics, the Census Bureau series on business applications.
- BTOS: Business Trends and Outlook Survey, a Census Bureau survey run every two weeks.
- Cohort: all establishments that opened in the same year to March.
- Establishment: one physical location of a business. A firm can own many.
- Firm: a business, which may own one or more establishments.
- Employer firm: a firm with paid employees. A nonemployer firm has none.
- NAICS: North American Industry Classification System, the code for a type of business.
- SBA: US Small Business Administration.
- SBCS: Small Business Credit Survey, run by the Federal Reserve Banks.
- SLOOS: Senior Loan Officer Opinion Survey, run by the Federal Reserve Board.
Sources
- Bureau of Labor Statistics, Business Employment Dynamics news release, fourth quarter 2025, Jul 2026
- Bureau of Labor Statistics, Business Employment Dynamics, Table 7, survival of construction establishments, Mar 2025
- Bureau of Labor Statistics, Business Employment Dynamics, Table 7, survival of private sector establishments, Mar 2025
- Federal Reserve Banks, Small Business Credit Survey, 2024 Report on Startup Firms, Dec 2024
- Federal Reserve Banks, Small Business Credit Survey, 2026 Report on Employer Firms, Mar 2026
- Federal Reserve Banks, Small Business Credit Survey, 2026 Report on Employer Firms, data appendix, Mar 2026
- Federal Reserve Board, Selected Interest Rates (H.15), Oct 2026
- Federal Reserve Board, Senior Loan Officer Opinion Survey, July 2026, Aug 2026
- Internal Revenue Service, Statistics of Income, nonfarm sole proprietorships, Table 1, tax year 2023, Jul 2026
- JPMorganChase Institute, Small businesses in times of distress, Jul 2025
- SBA Office of Advocacy, Frequently Asked Questions About Small Business, February 2026, Feb 2026
- U.S. Census Bureau, 2022 NAICS descriptions, Dec 2021
- U.S. Census Bureau, Business Dynamics Statistics 2023, by 3-digit NAICS industry, Sep 2025
- U.S. Census Bureau, Business Dynamics Statistics 2023, by 4-digit NAICS industry, Sep 2025
- U.S. Census Bureau, Business Dynamics Statistics 2023, by firm age, Sep 2025
- U.S. Census Bureau, Business Dynamics Statistics 2023, by firm size, Sep 2025
- U.S. Census Bureau, Business Dynamics Statistics 2023, by sector, Sep 2025
- U.S. Census Bureau, Business Dynamics Statistics 2023, national table, Sep 2025
- U.S. Census Bureau, Business Dynamics Statistics 2023, sector by firm age, Sep 2025
- U.S. Census Bureau, Business Dynamics Statistics 2023, sector by firm size, Sep 2025
- U.S. Census Bureau, Business Formation Statistics, monthly data file, Oct 2026
- U.S. Census Bureau, Business Formation Statistics, press release of 14 Oct 2026, Oct 2026
- U.S. Census Bureau, Business Trends and Outlook Survey, national data, Oct 2026
- U.S. Census Bureau, Business Trends and Outlook Survey, sector data, Oct 2026
- U.S. Courts, Table F, 12 months ending June 30, 2026, Jun 2026
- U.S. Courts, Table F-2, 12 months ending December 31, 2019, Dec 2019
- U.S. Courts, Table F-2, 12 months ending December 31, 2021, Dec 2021
- U.S. Courts, Table F-2, 12 months ending June 30, 2025, Jun 2025
- U.S. Courts, Table F-2, 12 months ending June 30, 2026, Jun 2026
- U.S. Census Bureau, Business Applications: Total for All NAICS in the United States, retrieved from FRED, Sep 2026