Plumbing industry statistics describe a large trade built from small shops. Most plumbing businesses are tiny, the parts they buy keep getting more costly, and the work rides on homes, water pipes and the weather. This page gathers the numbers from the agencies and companies that produce them.
Many sources do not split plumbing from heating and air conditioning. Where that happens, the page says so. Every figure links to the original release and carries its date.
Use the sections below to jump to what you need: size, firms, growth, demand, costs, suppliers, water heaters, public water work, big brands and small-shop conditions. For heating and cooling numbers, see HVAC industry statistics.
Key Takeaways
- $75.1 billion of work was classed as plumbing contracting by plumbing, heating and air-conditioning contractor establishments in 2022 (U.S. Census Bureau, Dec 2025).
- 111,207 employer establishments were in the plumbing, heating and air-conditioning contractor class in 2023 (U.S. Census Bureau, Jun 2025).
- 98,606 of those establishments, about 89%, had fewer than 20 employees, our sum of the three smallest size classes (U.S. Census Bureau, Jun 2025).
- 7.7% job growth is projected for plumbing, heating and air-conditioning contractors from 2025 to 2035, against 3.5% for all industries (Bureau of Labor Statistics, Aug 2026).
- $442 billion and 1.8 million jobs is the combined economic impact of plumbers and plumbing manufacturers (Plumbing Manufacturers International, Aug 2026).
- $97.8 billion in sales came from plumbing and heating equipment wholesalers in 2022 (U.S. Census Bureau, Dec 2024).
- 30.0% is how much copper and brass mill shape prices rose in the 12 months to September 2026 (Bureau of Labor Statistics, Oct 2026).
- 56.2% of construction firms paid more for inputs, but only 24.4% raised their own prices, in the survey collected through October 4, 2026 (U.S. Census Bureau, Oct 2026).
- 1,221,000 is the September 2026 housing starts rate, down 7.4% from a year earlier (U.S. Census Bureau, Oct 2026).
- 8.98 million US homes had a main water heater at least 20 years old in 2020 (Energy Information Administration, Mar 2023).
- $12.5 billion was Home Depot’s plumbing department sales in fiscal 2025 (Home Depot, Mar 2026).
- $625 billion is what EPA says drinking water systems will need over 20 years (EPA, Sep 2023).
- 11.2 trillion gallons of water and $278 billion in bills have been saved through WaterSense by the end of 2025 (EPA, Sep 2026).
- 17.2% of construction firms used AI in the survey collected through October 4, 2026 (U.S. Census Bureau, Oct 2026).
How big is the plumbing market in the United States?
No federal table measures plumbing alone, so the best view comes from three angles: contractor receipts, economic impact studies and the supply chain. Each one points to a market worth tens or hundreds of billions of dollars.
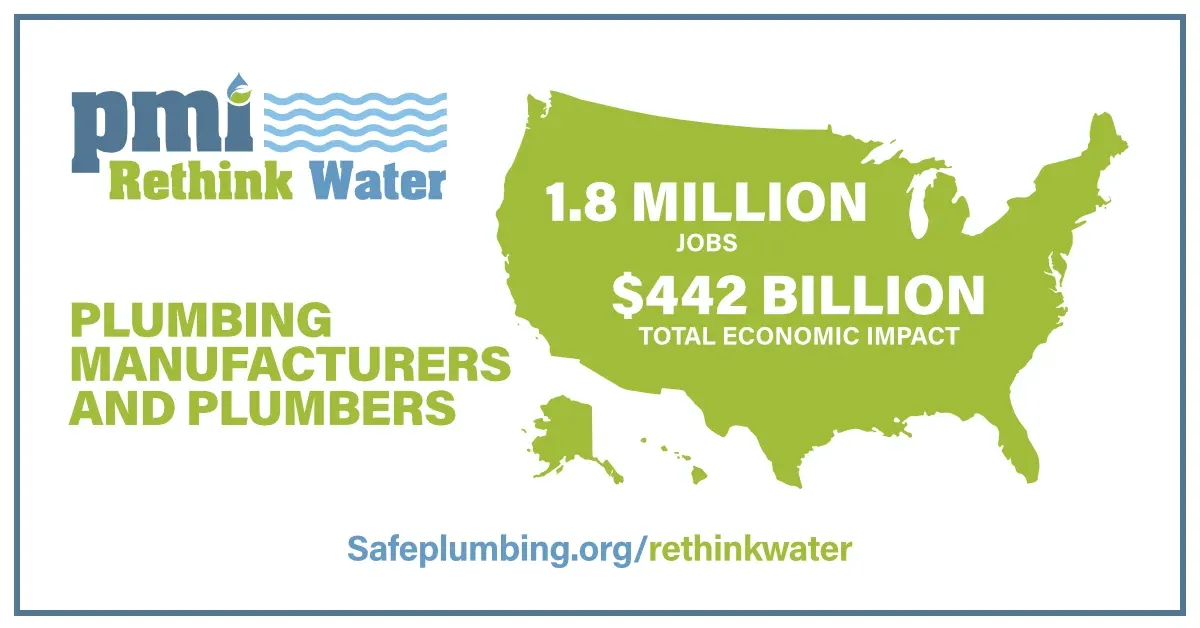 Figure 1: Plumbers and plumbing makers together support a very large workforce, which shows how many livelihoods sit behind every service call and fixture. Source: Plumbing Manufacturers International, Two Studies: Plumbing Manufacturing and Plumbing Industries Worth $442 Billion, Aug 2026. Chart published by the source, captured 20 Oct 2026.
How much work do plumbing and related contractors bill?
The Economic Census sorts contractor receipts by kind of business. That is how plumbing work can be separated from heating and cooling work inside one industry class.
- The full plumbing, heating and air-conditioning contractor class reported $297.6 billion in receipts in 2022 (U.S. Census Bureau, Dec 2024).
- Mechanical contractor work inside that class reached $54.4 billion (U.S. Census Bureau, Dec 2025).
- Building sprinkler system installation added $11.4 billion (U.S. Census Bureau, Dec 2025).
- Steam and pipe fitting work added $4.7 billion (U.S. Census Bureau, Dec 2025).
What do plumbers and plumbing makers add to the economy?
An industry-funded study puts a larger frame around the trade by counting suppliers and household spending as well as direct work. Treat it as an impact estimate, not as revenue.
- Plumbers have a total economic impact of $313.5 billion a year (Plumbing Manufacturers International, Aug 2026).
- That impact supports 1,283,579 jobs and $105.1 billion in wages (Plumbing Manufacturers International, Aug 2026).
- Plumbing manufacturers have a total impact of $129 billion, 500,487 jobs and $37 billion in wages (Plumbing Manufacturers International, Aug 2026).
- Together the two groups paid over $142 billion in wages and generated almost $60 billion in tax revenue (Plumbing Manufacturers International, Aug 2026).
- A second study in the release found plumbing services are essential to 519 of the 544 US industry sectors (Plumbing Manufacturers International, Aug 2026).
How many plumbing businesses are there, and how big are they?
The typical plumbing business is small. A few thousand mid-size firms and a handful of giants sit on top of a very large base of shops with fewer than ten people.
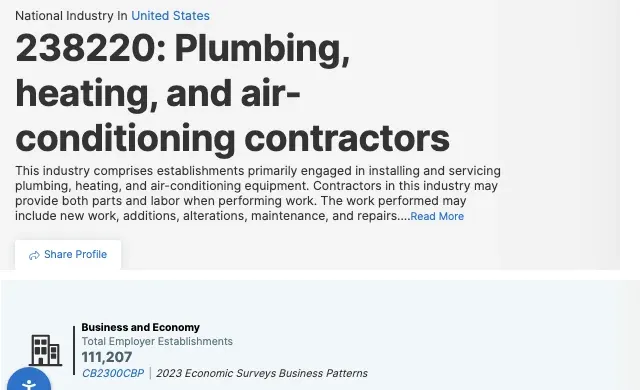 Figure 2: The Census profile for this industry class puts a single count on employer establishments, the base number behind every size and growth comparison on this page. Source: U.S. Census Bureau, Industry profile 238220, Jun 2025. Screenshot of the source page, industry heading and count tile joined, captured 20 Oct 2026.
How many people work for plumbing businesses?
Employer data counts payroll jobs at business locations. The Bureau of Labor Statistics uses its own job count, so the two totals differ.
- Employer establishments in the class paid 1,214,761 employees in 2023 (U.S. Census Bureau, Jun 2025).
- Their annual payroll was $89.5 billion (U.S. Census Bureau, Jun 2025).
- The 2022 Economic Census counted 112,088 firms running 114,427 establishments (U.S. Census Bureau, Dec 2024).
- The Bureau of Labor Statistics counted 1,317.3 thousand jobs in the class in 2025 (Bureau of Labor Statistics, Aug 2026).
How many plumbing employers are small, medium or large?
Size classes show how thin the top of the market is.
- 64,871 establishments had fewer than 5 employees (U.S. Census Bureau, Jun 2025).
- 8,384 establishments had 20 to 49 employees (U.S. Census Bureau, Jun 2025).
- 1,300 establishments had 100 to 249 employees (U.S. Census Bureau, Jun 2025).
- Only 24 establishments had 1,000 or more employees (U.S. Census Bureau, Jun 2025).
Where do plumbing contractors do their work?
Work follows population. Five states hold more than a third of the value.
- California led with $31.1 billion of construction work in 2022 (U.S. Census Bureau, Dec 2025).
- Texas followed with $24.7 billion (U.S. Census Bureau, Dec 2025).
- Florida had $18.9 billion (U.S. Census Bureau, Dec 2025).
- New York had $17.3 billion (U.S. Census Bureau, Dec 2025).
- Illinois had $11.3 billion (U.S. Census Bureau, Dec 2025).
- Privately owned projects made up $253.9 billion of the class’s work (U.S. Census Bureau, Dec 2024).
- Government-owned projects made up $34.5 billion (U.S. Census Bureau, Dec 2024).
Plumbing industry growth statistics: how fast is the trade growing?
Employment, payroll and receipts have all risen sharply over the last decade. Federal forecasts call for steady gains to 2035.
 Figure 3: Federal projections put job growth for plumbing, heating and air-conditioning contractors at more than double the all-industry rate through 2035. Source: Bureau of Labor Statistics, Employment and output by industry, Aug 2026. Screenshot of the source table, header and selected rows, captured 20 Oct 2026.
How much did the trade grow over ten years?
County Business Patterns uses the same industry definition each year, so 2013 can be compared with the 2023 counts in the section above.
- Employer establishments in the class numbered 93,508 in 2013 (U.S. Census Bureau, Apr 2015).
- Employment was 840,511 in 2013 (U.S. Census Bureau, Apr 2015).
- Annual payroll was $44.9 billion in 2013 (U.S. Census Bureau, Apr 2015).
What changed between the last two Economic Censuses?
Receipts are in current dollars, so price rises explain part of the gain over the 2022 figures in the first section.
- The class reported $206.2 billion in receipts in 2017 (U.S. Census Bureau, May 2021).
- Plumbing contractor work alone was $53.6 billion in 2017 (U.S. Census Bureau, Dec 2020).
- The class had 101,561 firms in 2017 (U.S. Census Bureau, May 2021).
What do job forecasts say about the next ten years?
The Bureau of Labor Statistics projects employment, not revenue.
- The class is projected to reach 1,418.7 thousand jobs by 2035 (Bureau of Labor Statistics, Aug 2026).
- That is 101.4 thousand more jobs than in 2025 (Bureau of Labor Statistics, Aug 2026).
- Building equipment contractors as a group are projected to add 198.1 thousand jobs, up 7.6% (Bureau of Labor Statistics, Aug 2026).
- All specialty trade contractors together are projected to grow 5.2% (Bureau of Labor Statistics, Aug 2026).
What do the big companies expect for 2026?
Company guidance is short range, but it shows what the largest buyers and sellers see.
- Ferguson raised its 2026 outlook to mid-single digit net sales growth (Ferguson, Aug 2026).
- Roto-Rooter guided to 3.0% to 3.5% revenue growth for 2026 (Chemed, Feb 2026).
- A. O. Smith expects commercial water heater volumes to rise mid-single digits in 2026 after about 5% in 2025 (A. O. Smith, Feb 2026).
- The same filing projects flat to lower residential water heater units in 2026 because of weak new construction (A. O. Smith, Feb 2026).
What drives demand for plumbing work?
New home building is down and repair work is soft. That is why replacement jobs, such as water heaters, matter so much to the trade.
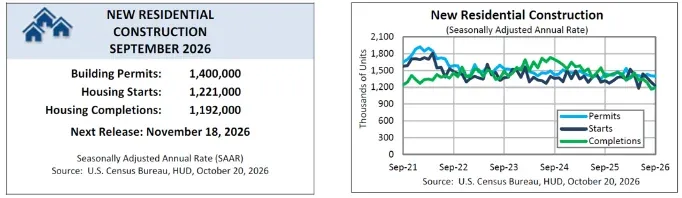 Figure 4: Permits, starts and completions have all drifted lower since late 2021, which trims new-build plumbing work and pushes more weight onto repairs. Source: U.S. Census Bureau and HUD, Monthly New Residential Construction, September 2026, Oct 2026. Chart published by the source, captured 20 Oct 2026.
How many new homes are being permitted and finished?
New homes need rough-in and finish plumbing, so building rates feed straight into plumbing demand.
- Building permits ran at an annual rate of 1,400,000 in September 2026, down 3.0% from a year earlier (U.S. Census Bureau, Oct 2026).
- Housing completions ran at 1,192,000, down 14.0% from a year earlier (U.S. Census Bureau, Oct 2026).
- Fortune Brands estimates new housing construction fell about 6% in 2025 (Fortune Brands Innovations, Feb 2026).
Is repair and replacement carrying the trade?
Several manufacturers say yes, and say it in their annual filings.
- A. O. Smith says the significant majority of the markets it serves are for replacing existing products (A. O. Smith, Feb 2026).
- It estimated 2025 residential water heater industry unit volumes were about flat from 2024 (A. O. Smith, Feb 2026).
- Fortune Brands estimates home repair and remodeling spending fell about 1% in 2025 (Fortune Brands Innovations, Feb 2026).
- A study commissioned by plumbing maker LIXIL found about 90% of plumbing-related spending goes to new construction (Plumbing Manufacturers International, Aug 2026).
- Ferguson said residential markets, about half of revenue, stayed subdued, with residential revenue up 2% in the second quarter of 2026 (Ferguson, Aug 2026).
- Its non-residential revenue grew 8% in the same quarter (Ferguson, Aug 2026).
What are construction firms seeing in demand right now?
The Census Bureau’s business survey asks about the previous two weeks. These figures come from the survey collected through October 4, 2026, and cover the whole construction sector, not plumbing alone.
- 11.6% of construction firms saw demand rise (U.S. Census Bureau, Oct 2026).
- 23.4% saw demand fall (U.S. Census Bureau, Oct 2026).
- 29.4% saw revenue fall, against 13.4% that saw it rise (U.S. Census Bureau, Oct 2026).
What do plumbing materials and parts cost now?
Copper is the loud number, but nearly every plumbing input is more expensive than in 2020. Contractors who price from an old list are giving margin away.
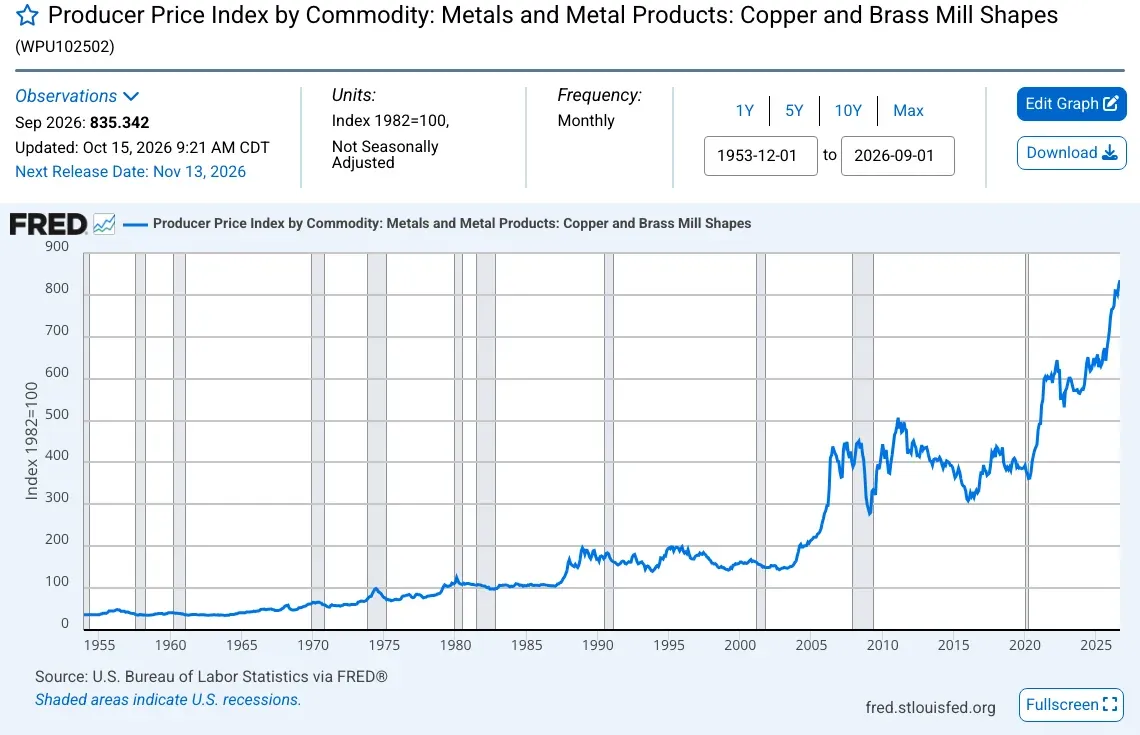 Figure 5: Producer prices for copper and brass mill shapes, the stock behind pipe, tube and brass fittings, have climbed to a record. Source: Bureau of Labor Statistics, Producer Price Index by Commodity: Copper and Brass Mill Shapes, via FRED, Sep 2026. Screenshot of the source page, captured 20 Oct 2026.
How much have plumbing parts and materials risen?
Percent changes below are our calculations from the published index values.
- Copper and brass mill shapes stood at 835.3 in September 2026, up 112.7% from 392.8 in January 2020 (Bureau of Labor Statistics, Oct 2026).
- Copper rolling, drawing, extruding and alloying prices rose 30.3% in the year to September 2026 (Bureau of Labor Statistics, Oct 2026).
- Plumbing fixture fitting and trim prices rose 4.9% in that year and 37.2% since January 2020 (Bureau of Labor Statistics, Oct 2026).
- Plastics pipe and pipe fitting prices rose 4.5% in the year and 72.9% since January 2020 (Bureau of Labor Statistics, Oct 2026).
- Other metal valve and pipe fitting prices rose 5.3% in the year (Bureau of Labor Statistics, Oct 2026).
- Pottery, ceramics and plumbing fixture prices rose 4.4% in the year (Bureau of Labor Statistics, Oct 2026).
What is behind the copper jump?
Trade policy and thin domestic supply both matter.
- A July 2025 proclamation set a 50% tariff on semi-finished copper products and intensive copper derivatives from August 1, 2025 (White House, Jul 2025).
- An April 2026 proclamation later set 50% duties on products made of the metals and 25% on derivative products mostly made of them (White House, Jun 2026).
- US net import reliance for copper rose to 57% in 2025 from 45% in 2024 (U.S. Geological Survey, Feb 2026).
- Refined copper imports reached 1.7 million metric tons in 2025 (U.S. Geological Survey, Feb 2026).
- USGS projected the COMEX copper price to average a record $4.80 a pound in 2025, 14% above 2024 (U.S. Geological Survey, Feb 2026).
- Building construction took 42% of copper use (U.S. Geological Survey, Feb 2026).
Are manufacturers passing costs on?
Yes. Filings from the largest plumbing makers describe price increases as a tool.
- Masco said its Plumbing Products net sales rose 3% in 2025 on higher selling prices, partly offset by 1% lower volume (Masco, Feb 2026).
- A. O. Smith announced price increases on most water heater and boiler products in the first half of 2025 to offset steel and tariff costs (A. O. Smith, Feb 2026).
- Watts reported that its Americas organic sales rose 8.0% in 2025, mainly from price and volume (Watts Water Technologies, Feb 2026).
- Masco expects a net benefit of about $85 million in 2026 from refunds of IEEPA tariffs (Masco, Jul 2026).
What do contractors pay and what do they charge?
Costs rise first and prices follow late. The survey below covers all construction firms, so treat it as the best public read on trade shops.
- 69.5% of construction firms expect to pay more for inputs over the next six months (U.S. Census Bureau, Oct 2026).
- 50.6% expect to raise their own prices in that time (U.S. Census Bureau, Oct 2026).
- The all-business input price index was 72.9 now and 79.0 for the next six months (U.S. Census Bureau, Oct 2026).
- Water, sewer and trash collection prices rose 4.8% in the same year (Bureau of Labor Statistics, Oct 2026).
Where does a plumbing contractor’s money go?
The Economic Census shows the cost mix for the plumbing, heating and air-conditioning class in 2022.
- Materials, components and supplies cost $93.7 billion (U.S. Census Bureau, Dec 2024).
- Annual payroll was $80.4 billion (U.S. Census Bureau, Dec 2024).
- Work subcontracted out cost $21.2 billion (U.S. Census Bureau, Dec 2024).
- Gasoline and diesel fuel cost $5.1 billion (U.S. Census Bureau, Dec 2024).
- Advertising and promotion cost $1.9 billion (U.S. Census Bureau, Dec 2024).
Who makes and sells plumbing products?
Plumbing parts move from manufacturers through wholesalers to contractors, and wholesale sits in the middle of that chain.
 Figure 6: Masco, the maker of Delta and hansgrohe faucets, grew plumbing sales in 2025 while the rest of the company shrank, a sign that price carried the segment. Source: Masco Corporation, Fourth Quarter and 2025 Year-End Results, Feb 2026. Screenshot of the source page, captured 20 Oct 2026.
How big is plumbing wholesale?
Wholesalers stock the trucks of most plumbing shops.
- Plumbing and heating equipment and supplies wholesalers numbered 2,107 firms in 2022 (U.S. Census Bureau, Dec 2024).
- They ran 5,917 establishments (U.S. Census Bureau, Dec 2024).
- They employed 81,233 people (U.S. Census Bureau, Dec 2024).
- A. O. Smith sells through about 800 independent wholesale plumbing distributors (A. O. Smith, Feb 2026).
- Watts sold about 66% of its 2025 net sales to wholesale distributors (Watts Water Technologies, Feb 2026).
How big is plumbing manufacturing?
The Annual Survey of Manufactures reports shipments by product class. Its last release covers 2021, and the Census Bureau has folded the survey into the Annual Integrated Economic Survey.
- Plumbing fixture fitting and trim makers shipped $6.0 billion in 2021 (U.S. Census Bureau, Apr 2025).
- That class employed 9,121 people (U.S. Census Bureau, Apr 2025).
- Pottery, ceramics and plumbing fixture makers shipped $2.7 billion and employed 11,552 (U.S. Census Bureau, Apr 2025).
- Plastics pipe and pipe fitting makers shipped $14.8 billion (U.S. Census Bureau, Apr 2025).
- Copper rolling, drawing, extruding and alloying plants shipped $32.3 billion (U.S. Census Bureau, Apr 2025).
- The plumbing makers’ trade group says its members produce more than 90% of US plumbing products (Plumbing Manufacturers International, Aug 2026).
- Its members sell through more than 26,000 home improvement stores, hardware stores and showrooms (Plumbing Manufacturers International, Aug 2026).
How are the large plumbing brands doing?
Results are mixed. Some makers grew in 2025 and others shrank.
- Masco’s Plumbing Products segment had net sales of $4,992 million in 2025 (Masco, Feb 2026).
- The segment’s sales were $2,700 million in the first half of 2026, up 3% (Masco, Jul 2026).
- Fortune Brands’ Water segment, home of Moen, had net sales of $2,447.6 million in 2025, down 4.6% (Fortune Brands Innovations, Feb 2026).
- Its Water sales were $605.0 million in the second quarter of 2026, down 6.5% (Fortune Brands Innovations, Aug 2026).
- Watts Water Technologies had net sales of $2,438.5 million in 2025 (Watts Water Technologies, Feb 2026).
- Zurn Elkay had net sales of $1,695.9 million in 2025, up 8.3% (Zurn Elkay Water Solutions, Feb 2026).
- A. O. Smith’s North America water heaters and related parts had sales of $2,460.1 million in 2025 (A. O. Smith, Feb 2026).
- Plumbing was 7.6% of Home Depot’s net sales in fiscal 2025 (Home Depot, Mar 2026).
How do water heaters and efficient fixtures shape plumbing work?
Water heaters are a large replacement market, and federal efficiency rules shape what gets installed. Efficient fixtures add a second stream of retrofit work.
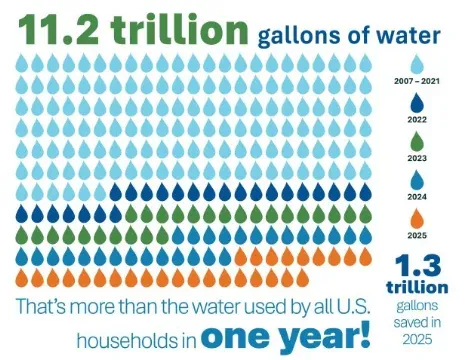 Figure 7: Cumulative water saved through WaterSense, shown by year, with each color band marking one year of savings. Source: EPA, WaterSense Accomplishments and History, Dec 2025. Chart published by the source, captured 20 Oct 2026.
How many homes have which kind of water heater?
The 2020 Residential Energy Consumption Survey is still the newest national count of home water heaters.
- The survey covered 123.53 million occupied US homes (Energy Information Administration, Mar 2023).
- 59.33 million homes used natural gas for the main water heater (Energy Information Administration, Mar 2023).
- 57.04 million used electricity (Energy Information Administration, Mar 2023).
- 8.03 million had a tankless unit (Energy Information Administration, Mar 2023).
- 25.10 million main water heaters were 10 to 14 years old (Energy Information Administration, Mar 2023).
- 10.35 million were 15 to 19 years old (Energy Information Administration, Mar 2023).
What do federal rules change for water heater jobs?
Rules set the clock for equipment switches.
- The Department of Energy’s May 2024 rule on consumer water heaters requires compliance on and after May 6, 2029 (Department of Energy, May 2024).
- A separate December 2024 rule on gas-fired instantaneous water heaters was withdrawn as of May 20, 2025 (Department of Energy, May 2025).
- A. O. Smith says a new federal rule for commercial water heaters takes effect in October 2026 (A. O. Smith, Feb 2026).
- It expects buying ahead of that change to lift 2026 commercial volumes (A. O. Smith, Feb 2026).
- Its North America water heater sales rose 1% in 2025, as pricing and higher commercial volumes outweighed lower wholesale residential volumes (A. O. Smith, Feb 2026).
How much water do efficient fixtures save?
The savings give plumbers a plain message for fixture swaps.
- WaterSense labeled products and programs saved 1.3 trillion gallons in 2025 alone (EPA, Sep 2026).
- More than 1 billion WaterSense labeled products have been shipped by manufacturers (EPA, Sep 2026).
- The label covers about 48,000 product models (EPA, Sep 2026).
- WaterSense has more than 2,300 organizational partners (EPA, Sep 2026).
How much water pipe work is coming from public money?
Cities and states face a long list of aging pipe. Federal funds and tougher lead rules turn some of that need into paid jobs.
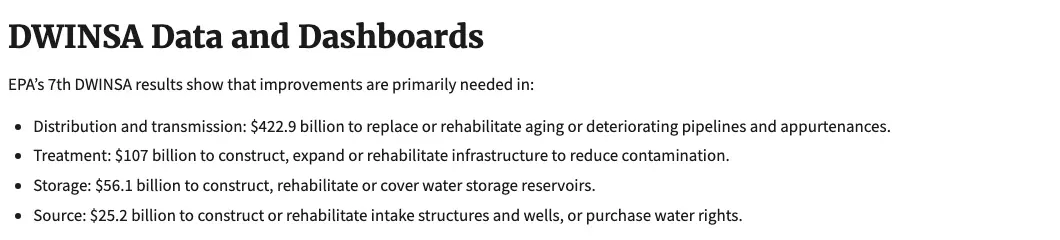 Figure 8: EPA breaks the 20-year drinking water bill into pipes, treatment, storage and sources, and pipes are by far the largest line. Source: EPA, 7th Drinking Water Infrastructure Needs Survey and Assessment, Sep 2023. Screenshot of the source page, captured 20 Oct 2026.
How much do water systems need to spend?
EPA’s survey covers public water systems, not private plumbing.
- Distribution and transmission pipes need $422.9 billion over 20 years (EPA, Sep 2023).
- Treatment needs $107 billion (EPA, Sep 2023).
- Storage needs $56.1 billion (EPA, Sep 2023).
- Sources need $25.2 billion (EPA, Sep 2023).
- Tribal systems have needs above $4 billion (EPA, Sep 2023).
- Census data show water supply construction at a $36.8 billion annual rate in August 2026, up 1.3% from a year earlier (U.S. Census Bureau, Oct 2026).
- Sewage and waste disposal construction ran at $53.8 billion, up 0.7% (U.S. Census Bureau, Oct 2026).
How many lead service lines remain?
Lead service lines run from the water main to the building, and replacing them is plumbing work.
- EPA now estimates 4 million lead service lines, made up of 3 million reported and 1 million predicted from unknown pipes (EPA, Nov 2025).
- An earlier update projected about 9 million (EPA, May 2024).
- The infrastructure law set aside $15 billion for lead service line replacement through state funds (EPA, Nov 2025).
- The October 2024 lead rule requires water systems to replace lead pipes within 10 years (EPA, Oct 2024).
What do engineers and utilities report about the water network?
The engineers’ report card gave drinking water a C-, the same grade as in 2021.
- ASCE puts the gap between drinking water needs and investment at $309 billion in 2024 (American Society of Civil Engineers, Mar 2025).
- That gap is projected to reach $620 billion by 2043 (American Society of Civil Engineers, Mar 2025).
- EPA counts about 48,000 community water systems in the states and territories (EPA, Nov 2025).
- Household water and sewer bills rose 5.1% in 2025, the steepest yearly increase in five years (Bluefield Research, Mar 2026).
- Bills are up 24.2% since 2020 (Bluefield Research, Mar 2026).
- Water rates rose 6.0% in 2025, against 4.8% for wastewater rates (Bluefield Research, Mar 2026).
Who supplies the water systems?
Core & Main is the largest specialist in water, wastewater, storm drainage and fire protection products.
- Core & Main had net sales of $7,647 million in fiscal 2025, up from $7,441 million (Core & Main, Mar 2026).
- It sizes its US and Canada addressable market at $44 billion and says it holds about 17% (Core & Main, Mar 2026).
- About 44% of its sales were to the municipal market, 38% non-residential and 18% residential (Core & Main, Mar 2026).
- It runs over 370 branches and serves over 60,000 customers (Core & Main, Mar 2026).
How are the biggest plumbing brands doing?
The largest plumbing distributor grew sales in 2025. The largest drain and plumbing service brand saw its margin fall in late 2025.
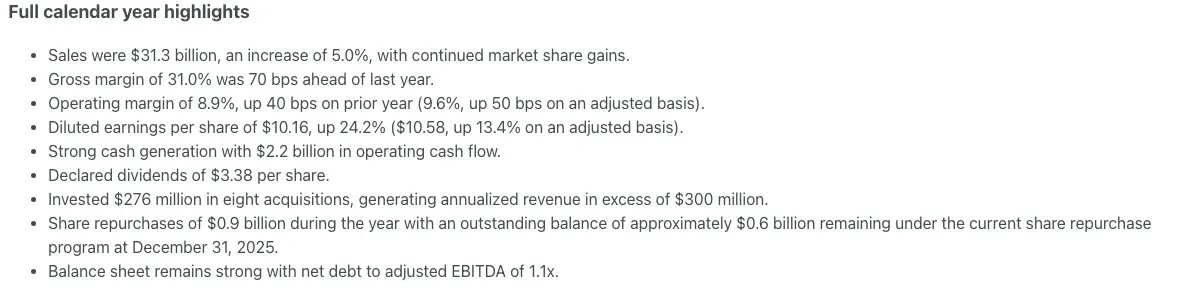 Figure 9: Ferguson’s calendar 2025 summary shows how much trade volume flows through one plumbing and waterworks distributor. Source: Ferguson, Calendar 2025 Results and 2026 Guidance, Feb 2026. Screenshot of the source page, captured 20 Oct 2026.
How large is the biggest distributor?
Ferguson serves plumbing, HVAC, waterworks and other trades.
- Ferguson’s net sales were $31,316 million in calendar 2025, up 5.0% (Ferguson, Feb 2026).
- Gross margin was 31.0%, up 70 basis points (Ferguson, Feb 2026).
- It puts the residential and non-residential construction markets it serves at $340 billion (Ferguson, Aug 2026).
- It has about 35,000 associates in over 1,700 locations (Ferguson, Aug 2026).
- It invested $276 million in eight acquisitions in 2025 (Ferguson, Feb 2026).
- Second-quarter 2026 net sales were $8,751 million, up 4.6% (Ferguson, Aug 2026).
How is the largest drain and plumbing service brand doing?
Roto-Rooter reports inside Chemed, which also runs a hospice business.
- Roto-Rooter revenue was $220.6 million in the fourth quarter of 2025, down 3.7% (Chemed, Feb 2026).
- Residential branch revenue was $155.6 million, down 3.1% (Chemed, Feb 2026).
- Residential plumbing revenue rose 6.3% while residential drain cleaning fell 3.2% (Chemed, Feb 2026).
- Commercial branch revenue was $55.2 million, up 1.6% (Chemed, Feb 2026).
- Gross margin was 49.8%, down from 51.3% a year earlier (Chemed, Feb 2026).
- Selling, general and administrative costs rose 10.5% to $63.2 million (Chemed, Feb 2026).
How are small plumbing and trade shops holding up?
Small shops face higher input costs, weaker revenue and costly credit at once. The survey data below cover all construction firms, the closest public read on a small plumbing business.
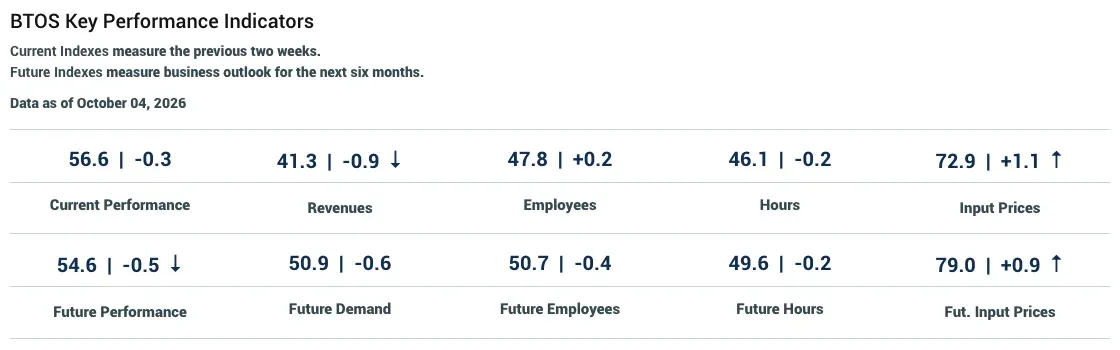 Figure 10: Input prices are the one index in the Census business survey that sits well above 50 now and is expected to climb, which means more firms report paying more. Source: U.S. Census Bureau, Business Trends and Outlook Survey, Oct 2026. Screenshot of the source page, captured 20 Oct 2026.
How are revenues and credit costs affecting construction firms?
The figures come from the survey’s two-week and six-month questions.
- 32.9% of construction firms said interest rate changes cut their profitability in the last six months (U.S. Census Bureau, Oct 2026).
- 11.4% said rates left them unable to invest in the business (U.S. Census Bureau, Oct 2026).
- 5.7% said rates left them unable to service debt (U.S. Census Bureau, Oct 2026).
- 5.1% lost money to an extreme weather event in the last six months (U.S. Census Bureau, Oct 2026).
- Small business owners in construction rated overall business health more positively than all firms, with 78% saying excellent or good in June 2026 (NFIB, Jul 2026).
How many trade businesses are adopting AI?
AI use is still a minority practice in construction, but a fifth of firms expect it soon.
- 75.5% of construction firms said they did not use AI in the last two weeks (U.S. Census Bureau, Oct 2026).
- 20.3% of construction firms expect to use AI in the next six months (U.S. Census Bureau, Oct 2026).
Methodology and Sources
Every number comes from the agency, regulator, association or company that produced it. We did not use roundups or market research reseller pages. Census Bureau data were read from the official data files, and each Census link points to the published table or program page for that file. Percent changes marked as our calculations are computed from published index values or counts. Company figures come from annual reports, SEC filings and earnings releases. The Census industry class used here, plumbing, heating and air-conditioning contractors, does not separate plumbing from heating and cooling except in the Economic Census kind-of-business table. We refresh the page monthly and update any figure when a newer release comes out.
Sources
- A. O. Smith
- American Society of Civil Engineers
- Bluefield Research
- Bureau of Labor Statistics
- Bureau of Labor Statistics
- Bureau of Labor Statistics
- Bureau of Labor Statistics
- Bureau of Labor Statistics
- Bureau of Labor Statistics
- Bureau of Labor Statistics
- Bureau of Labor Statistics
- Bureau of Labor Statistics, Employment and output by industry
- Bureau of Labor Statistics, Producer Price Index by Commodity: Copper and Brass Mill Shapes, via FRED
- Chemed
- Core & Main
- Department of Energy
- Energy Information Administration
- EPA
- EPA
- EPA
- EPA
- EPA
- EPA
- EPA, 7th Drinking Water Infrastructure Needs Survey and Assessment
- EPA, WaterSense Accomplishments and History
- Ferguson
- Ferguson
- Ferguson, Calendar 2025 Results and 2026 Guidance
- Fortune Brands Innovations
- Fortune Brands Innovations
- Home Depot
- Masco
- Masco
- Masco Corporation, Fourth Quarter and 2025 Year-End Results
- NFIB
- Plumbing Manufacturers International
- Plumbing Manufacturers International, Two Studies: Plumbing Manufacturing and Plumbing Industries Worth $442 Billion
- U.S. Census Bureau
- U.S. Census Bureau
- U.S. Census Bureau
- U.S. Census Bureau
- U.S. Census Bureau
- U.S. Census Bureau
- U.S. Census Bureau
- U.S. Census Bureau
- U.S. Census Bureau
- U.S. Census Bureau
- U.S. Census Bureau
- U.S. Census Bureau and HUD, Monthly New Residential Construction, September 2026
- U.S. Census Bureau, Business Trends and Outlook Survey
- U.S. Census Bureau, Industry profile 238220
- U.S. Geological Survey
- Watts Water Technologies
- White House
- White House
- Zurn Elkay Water Solutions
Glossary
- Economic Census: the Census Bureau’s five-year count of businesses, taken in years ending in 2 and 7.
- County Business Patterns: the Census Bureau’s yearly count of employer establishments, jobs and payroll.
- Establishment: one business location. A firm can run many establishments.
- Nonemployer firm: a business with no paid employees, often one person.
- NAICS: the North American Industry Classification System, the code list used to group businesses. Plumbing, heating and air-conditioning contractors are code 238220.
- PPI: Producer Price Index, which tracks prices sellers receive.
- BTOS: the Census Bureau’s Business Trends and Outlook Survey.
- SAAR: seasonally adjusted annual rate.
- IIJA: the Infrastructure Investment and Jobs Act of 2021.
- IEEPA: the International Emergency Economic Powers Act, the law behind some 2025 tariffs.
- WaterSense: EPA’s label for water-efficient products.
- Lead service line: the pipe that carries water from the main to a building.