Home renovation statistics show a market that keeps moving even when owners cannot move house. Nearly a third of renovating homeowners (31%) spent $50,000 or more in 2025 (Houzz, 2026 U.S. Houzz and Home Renovation Trends Study, Apr 2026), and the owners who plan projects mostly say they want to stay where they are.
That mix of big checks and staying put drives the rest of this page. Owners pay mostly with savings, borrow against equity for the large jobs, wait months before a crew starts, and often finish above budget. The page follows the money and the calendar, from why an owner starts to how long a job waits.
Every number comes from the group that ran the survey or kept the data, such as Houzz, the Harvard Joint Center for Housing Studies, the National Association of Realtors, the Federal Reserve and the National Association of Home Builders. For what projects cost, see home remodeling statistics. For who spends on the house and who does the work, see home improvement statistics.
Key Takeaways
- Cash paid for 76% of improvement projects in 2023, and home equity was the main source for 5% (Harvard JCHS, Improving America’s Housing 2025, Mar 2025).
- Home equity was the main source for 19.7% of projects costing $50,000 or more, against 3.9% of projects under $10,000 (Harvard JCHS, Improving America’s Housing 2025, Mar 2025).
- Home equity line of credit limits rose $19 billion in the second quarter of 2026, extending an expansion that began in 2022 (New York Fed, Household Debt and Credit Report Q2 2026, Aug 2026).
- Revolving home equity loans at US commercial banks grew at a 7.7% annual rate in the third quarter of 2026 (Federal Reserve Board, H.8 Assets and Liabilities of Commercial Banks, Oct 2026).
- The 30-year fixed mortgage rate averaged 7.40% on October 15, 2026, up from 6.27% a year earlier (Freddie Mac, Primary Mortgage Market Survey, Oct 2026).
- Owners 65 and over made up 27% of home improvement spending in 2023, nearly double their 14% share in 2003 (Harvard JCHS, Improving America’s Housing 2025, Mar 2025).
- Per owner improvement spending peaks at $5,700 for owners aged 35 to 44 and falls to $3,800 for owners 65 and over (Harvard JCHS, Improving America’s Housing 2025, Mar 2025).
- A quarter of renovating homeowners (25%) started their 2025 projects without a budget (Houzz, 2026 U.S. Houzz and Home Renovation Trends Study, Apr 2026).
- 63% of homeowners named rising product and material costs as their top concern for 2026 projects (Houzz, 2026 U.S. Houzz Renovation Plans Report, Dec 2025).
- Construction pros reported a 6.1-week project backlog at the start of the third quarter of 2026 (Houzz, Q3 2026 U.S. Houzz Pro Industry Barometer, Jul 2026).
- 44% of owners who finished a renovation said better schedule tracking would have improved the process (Houzz, Renovation Plans Report news release, Dec 2025).
- 89% of owners who remodeled said housing affordability was not a deciding factor (NAR, 2025 Remodeling Impact Report, Apr 2025).
- Energy-related projects reached $139 billion of owner spending in 2023, more than double the 2013 level (Harvard JCHS, Improving America’s Housing 2025, Mar 2025).
Why do homeowners start a renovation?
Owners do not wait for a trend. They renovate when they have the time, the money and a reason to stay, and attachment to the house and the street beats the math of buying. Selling soon is a smaller motive than comfort and wear.
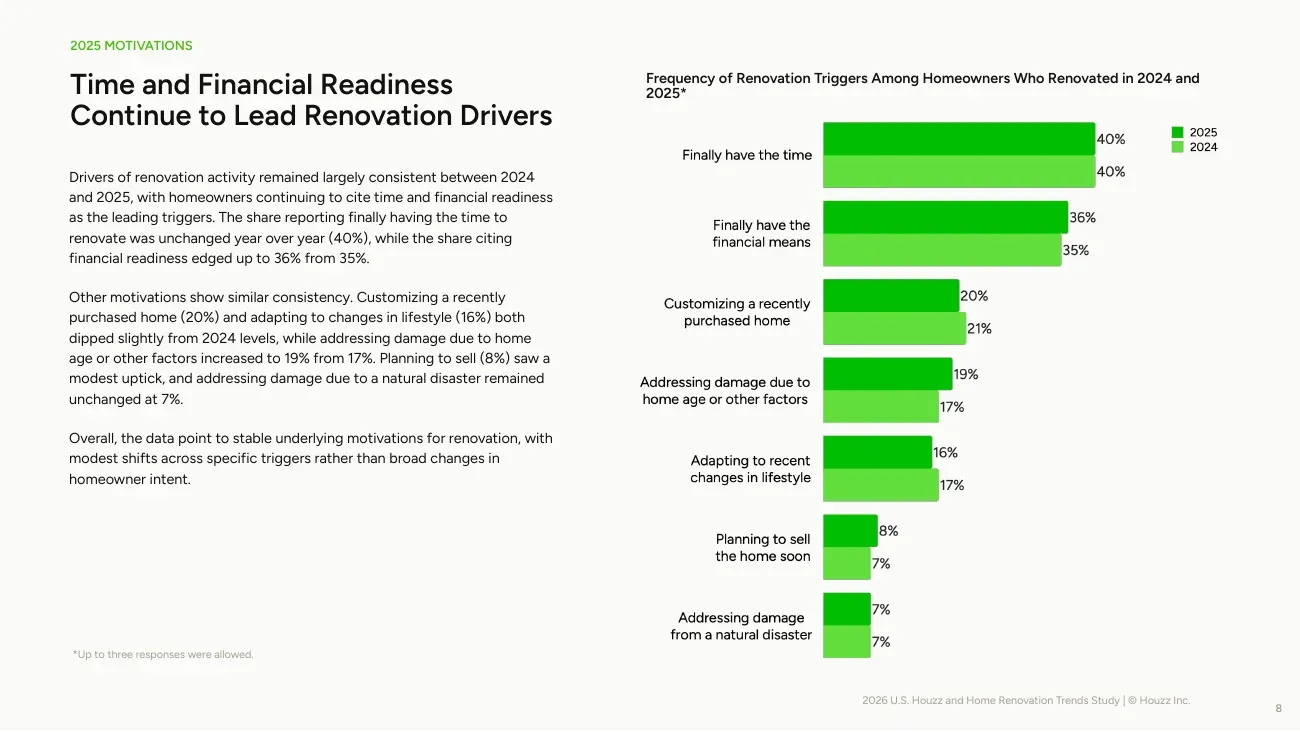 Figure 1: Time and money lead the list of reasons owners start a renovation, and planning to sell sits near the bottom. Source: Houzz, 2026 U.S. Houzz and Home Renovation Trends Study, Apr 2026. Page from the source report, captured 20 Oct 2026.
What sets a renovation off?
Having the time and having the money come first. In 2025, 40% of renovating homeowners said they finally had the time, and 36% said they finally had the financial means (Houzz, 2026 U.S. Houzz and Home Renovation Trends Study, Apr 2026).
- Customizing a recently purchased home drove 20% of renovations, adapting to lifestyle changes drove 16%, damage from home age or other causes drove 19% (up from 17%), planning to sell drove 8% and natural disaster damage drove 7% (Houzz, 2026 U.S. Houzz and Home Renovation Trends Study, Apr 2026).
What do owners name as the main reason?
Worn-out finishes lead. In NAR’s 2025 survey of 806 people who had finished a remodel, 27% named upgrading worn-out surfaces, finishes and materials as the main reason (NAR, 2025 Remodeling Impact Report, Apr 2025).
- 19% named improving energy efficiency as the main reason (NAR, 2025 Remodeling Impact Report, Apr 2025).
- 18% said it was time for a change, and 18% said they would sell within two years (NAR, 2025 Remodeling Impact Report, Apr 2025).
- 8% wanted to add features and improve livability, and 5% wanted to modernize (NAR, 2025 Remodeling Impact Report, Apr 2025).
- 4% had just moved in and wanted to customize, and 1% wanted better organization and storage (NAR, 2025 Remodeling Impact Report, Apr 2025).
Why renovate instead of buying another house?
Attachment beats arithmetic. Among homeowners planning a project for 2026, 79% said they want to stay in their current home (Houzz, 2026 U.S. Houzz Renovation Plans Report, Dec 2025).
- 40% want to stay in the neighborhood, and 29% want to add custom features (Houzz, 2026 U.S. Houzz Renovation Plans Report, Dec 2025).
- 28% said renovating gives a better return on investment, 26% said it is more affordable, and 7% said a lack of homes for sale pushed them to renovate (Houzz, 2026 U.S. Houzz Renovation Plans Report, Dec 2025).
- 5% said affordability was a factor and they did not want to move, and another 5% said they could not afford to move (NAR, 2025 Remodeling Impact Report, Apr 2025).
- Across all respondents to the New York Fed’s May 2026 housing survey, the mean chance of moving in the next 12 months was 13.5%, down from 15.4% a year earlier (New York Fed, Survey of Consumer Expectations Housing Survey 2026, May 2026).
- Nearly 70% of US mortgages outstanding at the end of 2023 carried a rate 3 percentage points below the prevailing rate (New York Fed, Liberty Street Economics, Aug 2024).
Do owners renovate for resale?
Mostly not. Even outdoors, where curb appeal matters, a small share renovates to raise resale value. Deteriorated or broken features triggered 41% of outdoor renovations, making the space more accommodating drove 25%, and improving resale value drove 15%, down 3 points from 2024 (Houzz, 2026 U.S. Houzz Outdoor Trends Study, Jun 2026).
- Owners who bought their homes within the prior three years spent an average of $6,600 on improvements in 2023, about 51% more than the $4,300 spent by owners who had not recently moved (Harvard JCHS, Improving America’s Housing 2025, Mar 2025).
- The number of owners who moved within the prior 12 months fell 16% between 2021 and 2023 to 4.7 million, and recent movers dropped from 6.8% to 5.5% of owners (Harvard JCHS, Improving America’s Housing 2025, Mar 2025).
How do renovation reasons and spending change with age?
Life stage sets the reason. Younger owners renovate right after they buy. Middle-aged owners go when they can afford it. Older owners fix what wears out, and they now supply more than a quarter of the spending.
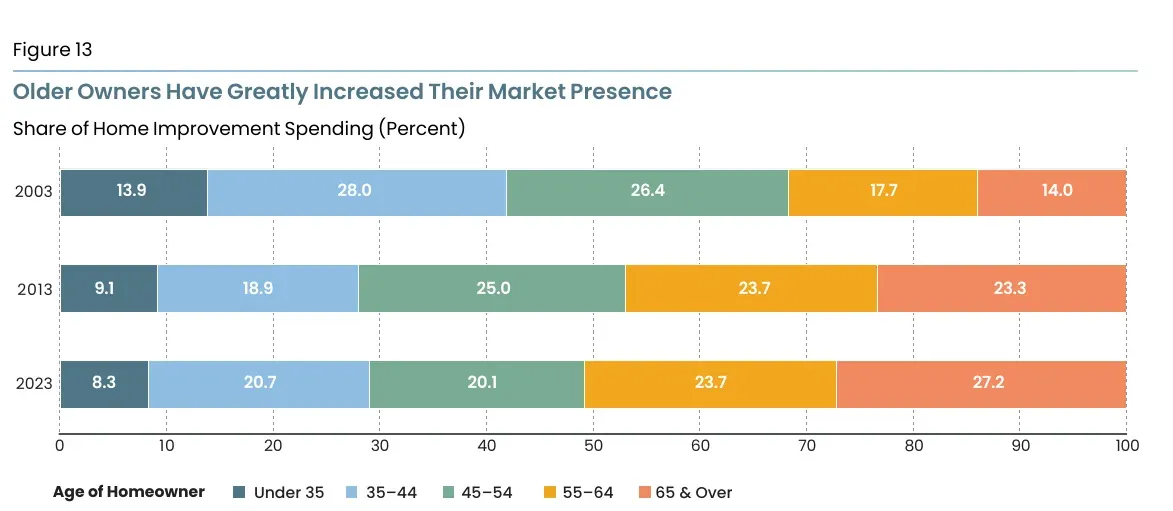 Figure 2: Owners 65 and over nearly doubled their share of improvement spending in two decades and now lead every age group, while owners under 35 lost share. Source: Harvard JCHS, Improving America’s Housing 2025, Mar 2025. Chart published by the source, captured 20 Oct 2026.
What triggers a renovation at each age?
Gen Z renovates after a purchase, and the oldest owners wait for time and damage. Nearly two-thirds of Gen Z homeowners (63%) named customizing a recently purchased home as their top trigger, and 44% named finally having the time (Houzz, 2026 U.S. Houzz and Home Renovation Trends Study, Apr 2026).
- Financial means was the leading trigger for Millennials and Gen X at 40% each, finally having the time led for Baby Boomers at 40% (financial readiness 34%), and 30% of Seniors renovated to address damage (Houzz, 2026 U.S. Houzz and Home Renovation Trends Study, Apr 2026).
How long have owners lived there, and will they move?
The older the owner, the longer the stay. Among Baby Boomers and Seniors, 72% and 77% have lived in their homes six years or more, against 67% of Gen X (Houzz, 2026 U.S. Houzz and Home Renovation Trends Study, Apr 2026).
- 22% of Gen Z and 12% of Millennials moved into their homes within the past year, and 39% of Gen Z plan to move within one to five years (Houzz, 2026 U.S. Houzz and Home Renovation Trends Study, Apr 2026).
- 51% of Baby Boomers and 61% of Seniors have no plans to move, against 37% of Gen X (Houzz, 2026 U.S. Houzz and Home Renovation Trends Study, Apr 2026).
- Owners 65 and over had lived in their homes for an average of 26 years, against 11 years for owners under 65 (Harvard JCHS, Improving America’s Housing 2025, Mar 2025).
Which age groups carry the spending?
Older and middle-aged owners. In 2023, households headed by someone 65 or older spent $110 billion on improvements (Harvard JCHS, Improving America’s Housing 2025, Mar 2025).
- Owners 55 to 64 accounted for 24% of spending, owners 35 to 44 for 21%, owners 45 to 54 for 20%, and owners under 35 for 8% (Harvard JCHS, Improving America’s Housing 2025, Mar 2025).
- The number of owners 65 and over rose 36% between 2013 and 2023, which made up 69% of all growth in homeowner households (Harvard JCHS, Improving America’s Housing 2025, Mar 2025).
- Owners 45 to 54 averaged $5,300 a year, owners 55 to 64 averaged $4,900, and owners under 35 averaged $4,200 (Harvard JCHS, Improving America’s Housing 2025, Mar 2025).
How do older and younger owners spend differently?
Older owners replace, and younger owners do more of the work themselves. Owners 65 and over spent 54% of their improvement dollars on replacements such as roofing, windows and HVAC, against 47% for owners under 65 (Harvard JCHS, Improving America’s Housing 2025, Mar 2025).
- Among owners with a project, 9.5% of those aged 65 to 79 and 11.5% of those 80 and over did one for accessibility, against 4.5% of owners under 65 (Harvard JCHS, Improving America’s Housing 2025, Mar 2025).
- 73% of remodelers said owners aged 65 and older ask for aging-in-place work, and 61% said owners aged 55 to 64 do (NAHB Eye on Housing, Aging in Place, May 2025).
- 91% of remodelers said customers take on aging-in-place projects to plan ahead for future needs, 48% said to live with older parents and 43% to address acute age-related disabilities (NAHB Eye on Housing, Aging in Place, May 2025).
- Grab bars were the most common aging-in-place job, done by 87% of remodelers in the last year, followed by curb-less showers at 78% (NAHB Eye on Housing, Aging in Place, May 2025).
- Owners under 35 put 24% of their improvement spending into DIY work, against 15% for owners 35 and over (Harvard JCHS, Improving America’s Housing 2025, Mar 2025).
- Younger owners spent $34 billion in 2023, a 51% rise since 2015 after inflation but still 14% below the 2007 peak (Harvard JCHS, Improving America’s Housing 2025, Mar 2025).
How big are renovation budgets?
Renovation checks run from small repairs to six-figure projects, and the heavy tail is getting heavier. A typical owner is not the owner who moves the market.
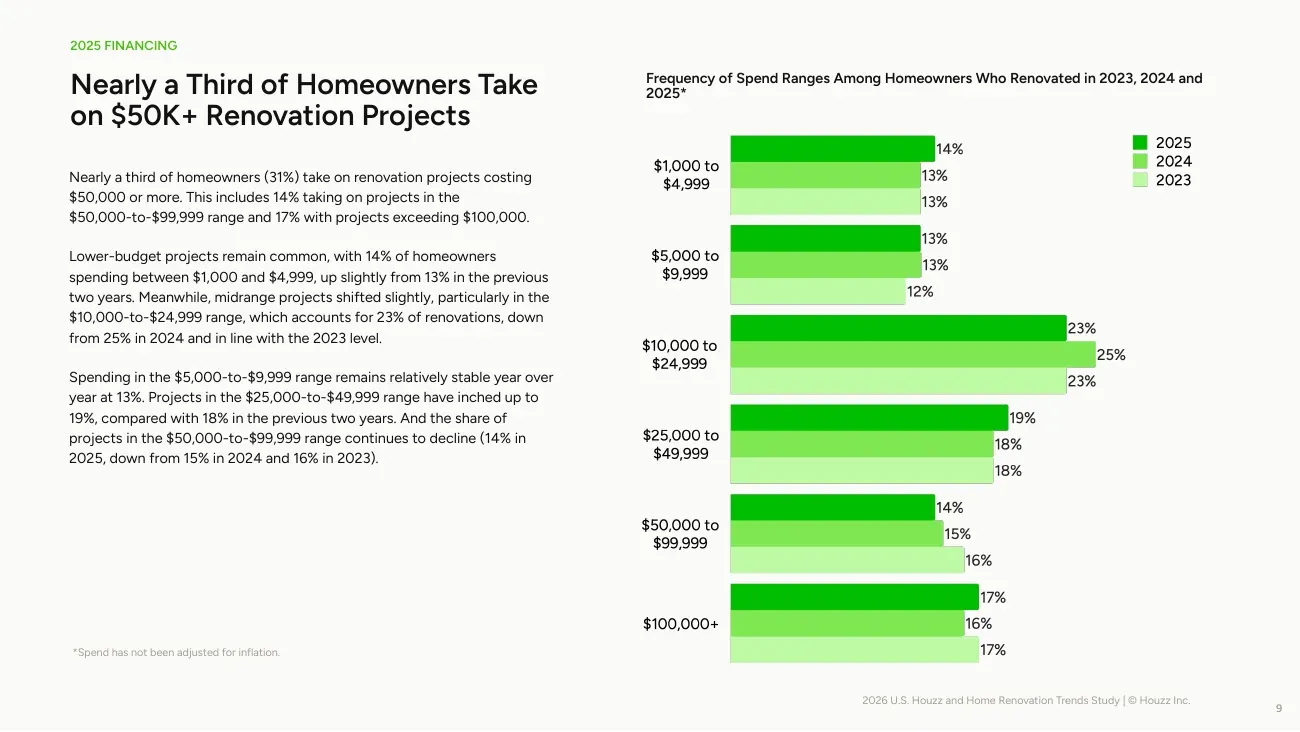 Figure 3: Projects of $10,000 to $24,999 are the single largest band, but the two top bands together make up nearly a third of renovations. Source: Houzz, 2026 U.S. Houzz and Home Renovation Trends Study, Apr 2026. Page from the source report, captured 20 Oct 2026.
How much does the typical owner spend in a year?
Less than the headlines suggest. Per owner improvement spending averaged $4,700 in 2023 (Harvard JCHS, Improving America’s Housing 2025, Mar 2025).
- 29.7% of owners had at least one improvement project in 2023, nearly 26 million households and a two-decade high (Harvard JCHS, Improving America’s Housing 2025, Mar 2025).
- Improvements to owner-occupied homes reached $405 billion in 2023, up 54% from 2019, or 29% after inflation (Harvard JCHS, Improving America’s Housing 2025, Mar 2025).
- Owner improvement spending grew 153% over ten years, far ahead of the spending growth on new multifamily (84%) and single-family (90%) development (Harvard JCHS, State of the Nation’s Housing 2026 Key Facts, Jun 2026).
- One in five owners (20%) reported no improvement or repair spending in 2023, and another 14% spent less than $500 (Harvard JCHS, Improving America’s Housing 2025, Mar 2025).
How are 2025 projects spread across price bands?
Most projects sit in the middle. 23% of renovating homeowners spent $10,000 to $24,999 in 2025, down from 25% in 2024 (Houzz, 2026 U.S. Houzz and Home Renovation Trends Study, Apr 2026).
- 17% spent more than $100,000, 14% spent $50,000 to $99,999, 19% spent $25,000 to $49,999, 13% spent $5,000 to $9,999 and 14% spent $1,000 to $4,999 (Houzz, 2026 U.S. Houzz and Home Renovation Trends Study, Apr 2026).
What do owners plan to budget for 2026?
Three in four plan real money. 75% of homeowners plan to spend more than $10,000 on their 2026 projects, and 29% plan to spend $50,000 or more (Houzz, 2026 U.S. Houzz Renovation Plans Report, Dec 2025).
- 30% plan $10,000 to $29,999, 16% plan $30,000 to $49,999, and 25% plan to spend less than $10,000 (Houzz, 2026 U.S. Houzz Renovation Plans Report, Dec 2025).
- In a Freddie Mac survey fielded in May and June 2022, potential renovators said a minor renovation should cost about $4,700 and take less than a month (Freddie Mac, Homeowners Hold Positive Attitudes Toward Renovating, Nov 2022).
- The same respondents said a major renovation, such as a kitchen or bath remodel, should cost about $35,300 and take more than three months (Freddie Mac, Homeowners Hold Positive Attitudes Toward Renovating, Nov 2022).
Who drives the biggest spending?
A small group of high spenders. Owners who spent $50,000 or more held 44% of the improvement market in 2023, the highest concentration since the mid-2000s (Harvard JCHS, Improving America’s Housing 2025, Mar 2025).
- From 2021 to 2023, real spending by owners at $50,000 or more grew 17%, against 7% for owners at $10,000 to $49,999 and a drop of 11% for owners under $10,000 (Harvard JCHS, Improving America’s Housing 2025, Mar 2025).
How do owners pay for a renovation?
Savings pay for most jobs, and equity pays for the big ones. Credit is shifting toward home equity lines, and the rate on those lines is not low.
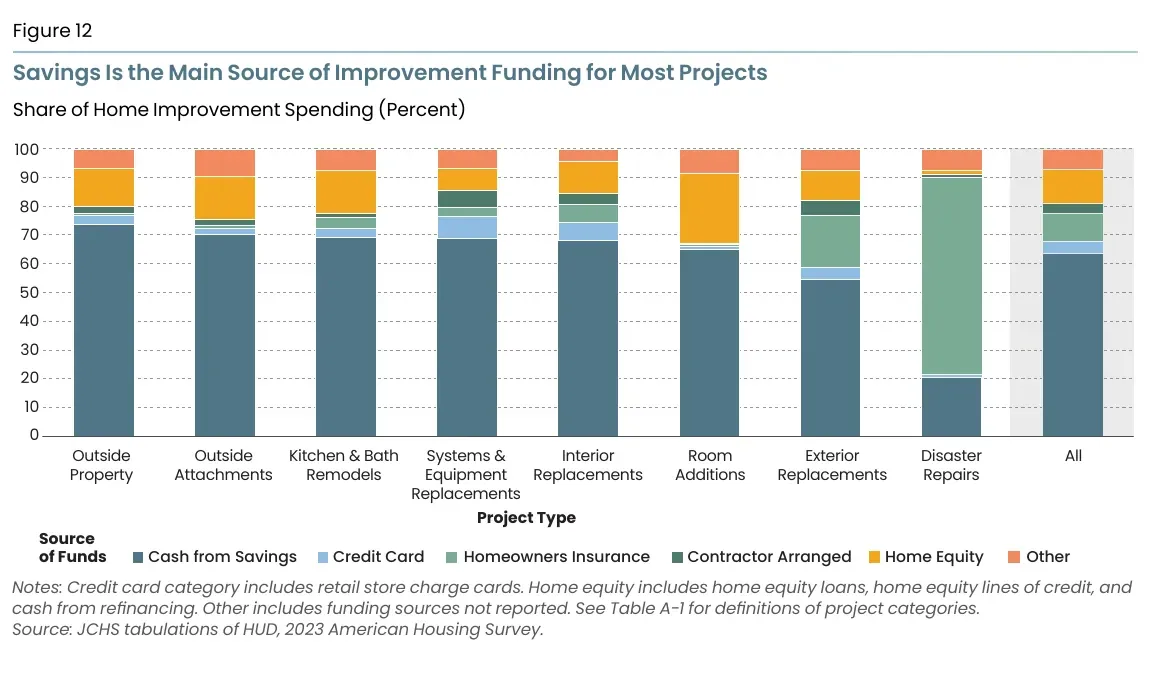 Figure 4: Savings fund most project types, while insurance funds most disaster repairs and home equity takes its biggest slice on room additions. Source: Harvard JCHS, Improving America’s Housing 2025, Mar 2025. Chart published by the source, captured 20 Oct 2026.
How does project size change the funding?
The bigger the job, the more equity. 82% of projects costing $2,000 or less were paid for with cash, and those small projects were more than half of all projects in 2023 (Harvard JCHS, Improving America’s Housing 2025, Mar 2025).
- 11.7% of projects costing $10,000 to $49,999 were funded mainly with home equity (Harvard JCHS, Improving America’s Housing 2025, Mar 2025).
- Credit cards were the main source for 6% of projects, insurance settlements for 4%, and contractor-arranged financing for 2% (Harvard JCHS, Improving America’s Housing 2025, Mar 2025).
- Average project spending was $13,000 when owners tapped equity, $14,900 when insurance paid, $10,600 with contractor financing, $5,000 with savings and $4,000 with cards (Harvard JCHS, Improving America’s Housing 2025, Mar 2025).
- About a quarter of room addition spending came from home equity, against 15% for kitchen and bath remodels (Harvard JCHS, Improving America’s Housing 2025, Mar 2025).
- From 2019 to 2023, the number of projects costing $50,000 or more rose 48%, while large projects funded with home equity rose 51% (Harvard JCHS, Improving America’s Housing 2025, Mar 2025).
What do renovating owners say they used?
Owners name more than one source, and the mix shifts with the size of the job. 13% of renovating homeowners used a secured home loan, with home equity lines the most common at 7%, and another 10% used proceeds from a home sale (Houzz, 2026 U.S. Houzz and Home Renovation Trends Study, Apr 2026).
- 23% of owners spending $50,000 to $200,000 used a secured home loan, against 6% of owners spending $1,000 to $5,000, while credit cards were used by 29% of the largest-budget owners and 37% of the smallest (Houzz, 2026 U.S. Houzz and Home Renovation Trends Study, Apr 2026).
- In NAR’s survey of people who had remodeled, 54% used a home equity loan or line of credit, 29% used savings and 10% used credit cards (NAR, 2025 Remodeling Impact Report, Apr 2025).
- In the same survey, 4% used another type of loan, 3% used a gift and 3% financed through the remodeler or a store (NAR, 2025 Remodeling Impact Report, Apr 2025).
What is happening in home equity credit?
Borrowing against the house keeps growing. Outstanding home equity line of credit balances sit $142 billion above the low reached in the first quarter of 2022 (New York Fed, Household Debt and Credit Report Q2 2026, Aug 2026).
- Revolving home equity loans at banks fell 12.6% in 2021 and grew 6.1% in 2025 (Federal Reserve Board, H.8 Assets and Liabilities of Commercial Banks, Oct 2026).
- A modest net share of banks reported stronger demand for home equity lines of credit in the second quarter of 2026 (Federal Reserve Board, July 2026 Senior Loan Officer Opinion Survey, Aug 2026).
- Second-lien lines had a median outstanding balance of $44,000 and a median rate of 7.4% (ICE, October 2026 Mortgage Monitor, Oct 2026).
- A 25 basis point rate increase would add about $9 to the median monthly payment on those lines (ICE, October 2026 Mortgage Monitor, Oct 2026).
- The average homeowner had $295,000 in home equity at the end of 2025 (Harvard JCHS, State of the Nation’s Housing 2026 Key Facts, Jun 2026).
- 6.6% of US families had a home equity line of credit in 2025, down from 6.9% in 2022, and 3.7% had one with a balance (Federal Reserve Board, 2025 Survey of Consumer Finances, Oct 2026).
- 2.1% of families had a junior-lien mortgage in 2025, up from 1.2% in 2022 (Federal Reserve Board, 2025 Survey of Consumer Finances, Oct 2026).
- Of 1.8 million home equity lines opened from 2023 through the second quarter of 2024, about 57% went to borrowers aged 50 and older, 24% to borrowers in their 40s and 19% to younger borrowers (New York Fed, Liberty Street Economics, Aug 2024).
- Home improvement loan applications fell 3% in 2024 while the dollar volume held near $144 billion (NAHB Eye on Housing, 2024 Home Improvement Loan Applications, Mar 2026).
- There were 3.5 home improvement loan applications for every 1,000 people in 2024 (NAHB Eye on Housing, 2024 Home Improvement Loan Applications, Mar 2026).
When do renovations start, stall or finish?
Most owners keep going, and few cancel. The top reasons for waiting are about timing, not price.
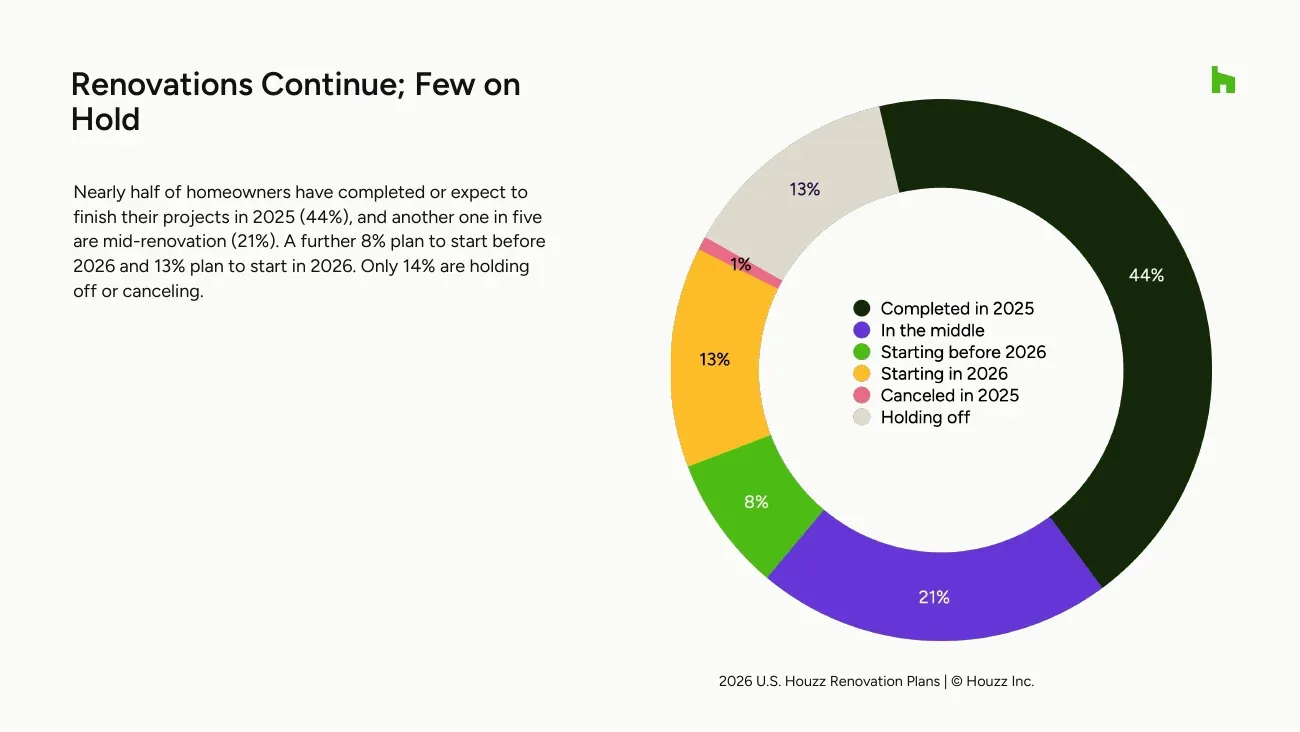 Figure 5: Nearly half of owners finished or expected to finish a project in 2025, and only a small slice was holding off or canceling. Source: Houzz, 2026 U.S. Houzz Renovation Plans Report, Dec 2025. Page from the source report, captured 20 Oct 2026.
Where do renovation plans stand?
Mostly in motion. 44% of homeowners completed or expected to finish their projects in 2025, and 21% were in the middle of a renovation (Houzz, 2026 U.S. Houzz Renovation Plans Report, Dec 2025).
- 8% planned to start before 2026, 13% planned to start in 2026, and only 14% were holding off or canceling (Houzz, 2026 U.S. Houzz Renovation Plans Report, Dec 2025).
Why do owners hold off?
Timing, then price. 30% of homeowners who delayed or canceled said the timing, such as weather or work, was not ideal (Houzz, 2026 U.S. Houzz Renovation Plans Report, Dec 2025).
- High prices and budget constraints were each cited by 17%, and economic uncertainty by 16% (Houzz, 2026 U.S. Houzz Renovation Plans Report, Dec 2025).
- Pro availability and time commitment were each cited by 13%, inability to find a pro by 12%, product or material availability by 4%, and permitting delays by 3% (Houzz, 2026 U.S. Houzz Renovation Plans Report, Dec 2025).
How busy are the pros who run these jobs?
Busy enough to schedule weeks out. Build-only remodelers reported a 6.0-week project backlog at the start of the third quarter of 2026, and design-build remodelers reported 6.2 weeks (Houzz, Q3 2026 U.S. Houzz Pro Industry Barometer, Jul 2026).
- At the start of the fourth quarter of 2025 the backlog was 5.4 weeks, which was 5.1 weeks shorter than a year earlier (Houzz, Q4 2025 U.S. Houzz Renovation Barometer, Oct 2025).
Do projects finish on time?
Timing splits three ways. In NAR’s survey, 37% of owners said their project took the same time as planned, 31% said it took more time, and 31% said it took less (NAR, 2025 Remodeling Impact Report, Apr 2025).
Why do renovation budgets break?
Most overruns come from price and scope, not one big surprise. A written number and a change log are the simplest defense.
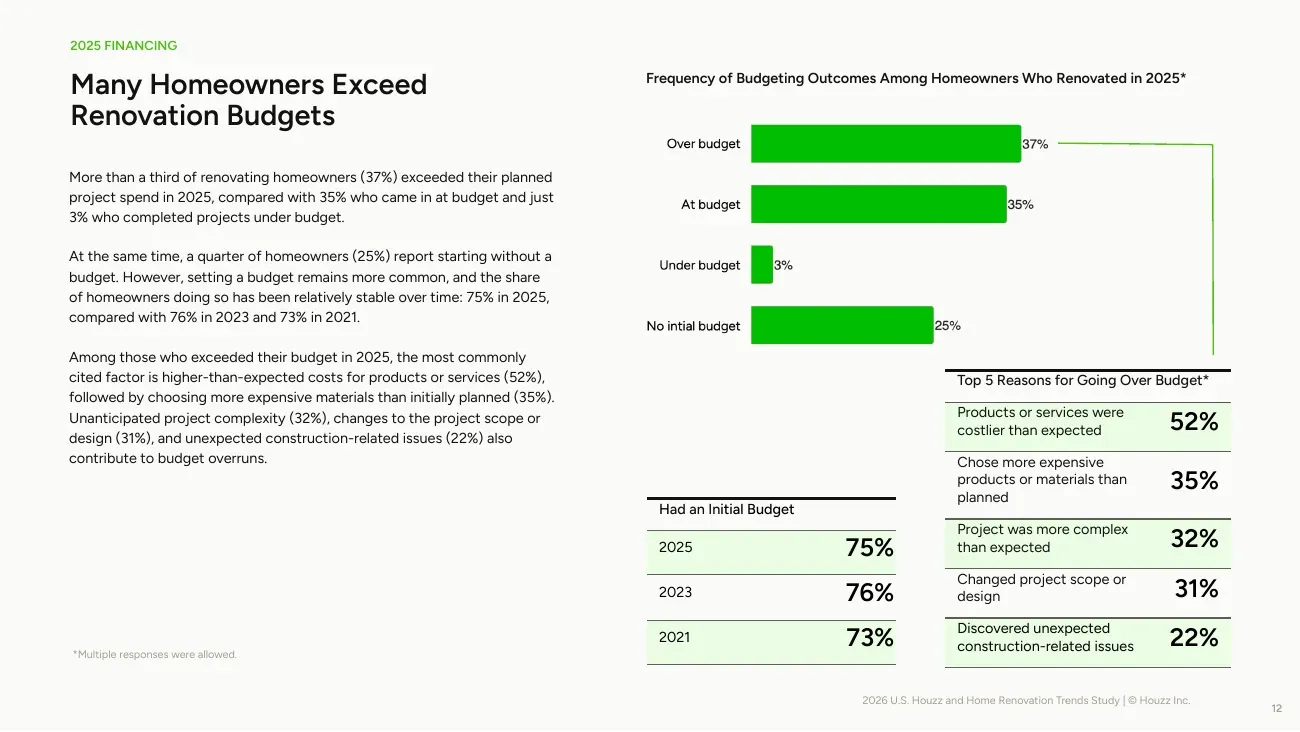 Figure 6: Going over budget is more common than coming in on target, and costlier products or services are the most cited cause. Source: Houzz, 2026 U.S. Houzz and Home Renovation Trends Study, Apr 2026. Page from the source report, captured 20 Oct 2026.
How many owners start with a budget?
Three in four. 75% of renovating homeowners had an initial budget in 2025, compared with 76% in 2023 and 73% in 2021, and only 3% finished under budget (Houzz, 2026 U.S. Houzz and Home Renovation Trends Study, Apr 2026).
What pushes the bill up?
Owners spend more on purpose, and prices have climbed under them. Among owners who went over budget, 35% chose more expensive products or materials than planned, and 31% changed the project scope or design (Houzz, 2026 U.S. Houzz and Home Renovation Trends Study, Apr 2026).
- In the third quarter of 2024, lumber and plywood prices were 21% above 2019, and glass, tile and cement stayed 26% to 36% above (Harvard JCHS, Improving America’s Housing 2025, Mar 2025).
- Insulation, gypsum and plastic construction products were 42% to 50% above 2019 prices in 2024 (Harvard JCHS, Improving America’s Housing 2025, Mar 2025).
What do owners expect to go wrong?
Cost first, then people. 31% of homeowners expected higher labor costs in 2026, and 25% expected trouble finding available professionals (Houzz, 2026 U.S. Houzz Renovation Plans Report, Dec 2025).
- 25% expected problems with product or material availability, 24% expected disruption to day-to-day life, and 22% expected trouble with design decisions (Houzz, 2026 U.S. Houzz Renovation Plans Report, Dec 2025).
How are pros protecting their margins?
By raising prices and picking jobs. 40% of construction firms raised prices or rates, 34% became more selective about project size and budgets, and 33% named client financial uncertainty as a recent challenge (Houzz, Q3 2026 U.S. Houzz Pro Industry Barometer, Jul 2026).
What do owners expect from the pros they hire?
Owners buy certainty. They want to see the schedule, understand the price and pay without friction. Any shop that sends a clear quote and keeps the job visible can meet that bar.
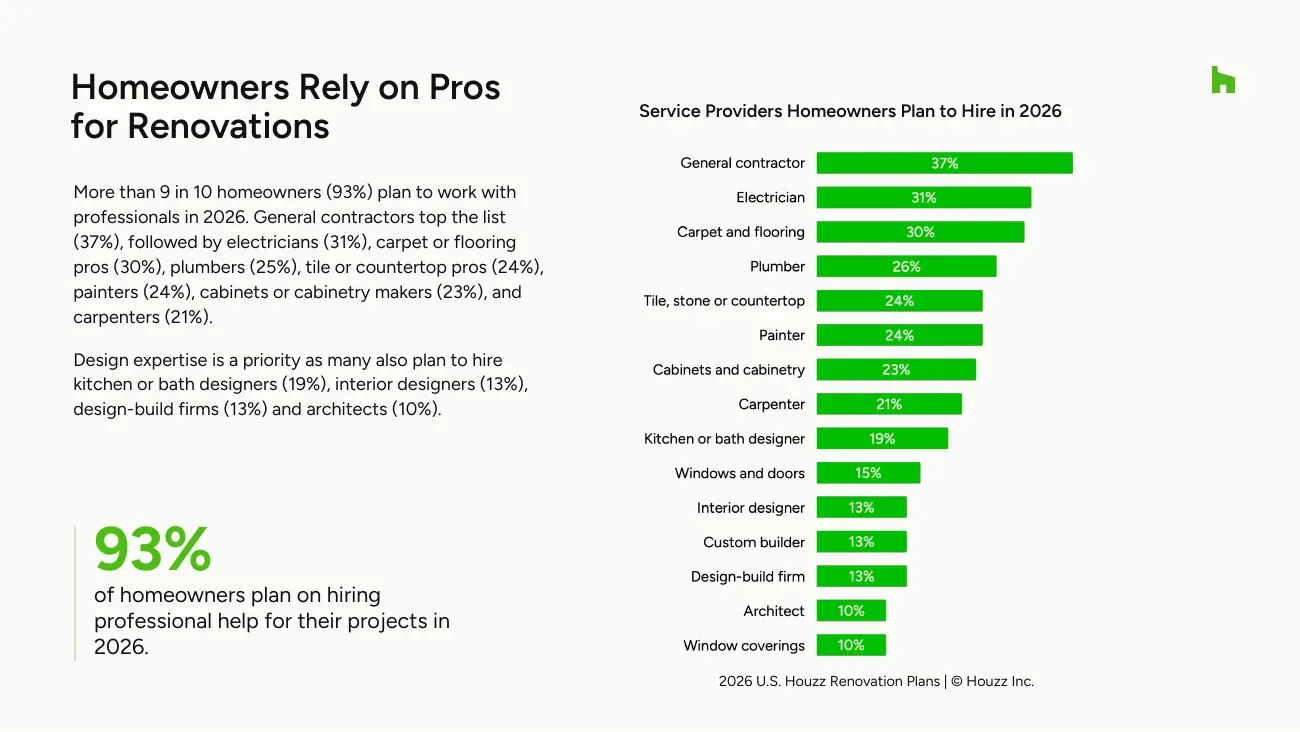 Figure 7: General contractors lead the hiring plans, with electricians and flooring pros next, so one renovation can bring several trades to the same house. Source: Houzz, 2026 U.S. Houzz Renovation Plans Report, Dec 2025. Page from the source report, captured 20 Oct 2026.
How many owners hire help?
Almost all of them, and more as owners age. 93% of homeowners plan to hire professional help for 2026 projects (Houzz, 2026 U.S. Houzz Renovation Plans Report, Dec 2025).
- Among 2025 renovators, 99% of Seniors, 92% of Baby Boomers, 90% of Gen X, 86% of Millennials and 75% of Gen Z hired a pro (Houzz, 2026 U.S. Houzz and Home Renovation Trends Study, Apr 2026).
- In NAR’s survey, 29% hired a professional for the whole job, 24% hired the labor but bought the materials, and 24% did everything themselves (NAR, 2025 Remodeling Impact Report, Apr 2025).
Which pros do owners plan to hire?
General contractors first, then the trades. 37% of homeowners plan to hire a general contractor and 31% plan to hire an electrician (Houzz, 2026 U.S. Houzz Renovation Plans Report, Dec 2025).
- For projects of $50,000 or more, 55% plan to hire a general contractor, 33% a custom builder, 30% a kitchen or bath designer, 24% a design-build firm and 20% an interior designer (Houzz, 2026 U.S. Houzz Renovation Plans Report, Dec 2025).
What would owners change about the process?
The weak spots are the schedule, the talk and the price. Among owners who finished a renovation in 2025, 35% said clearer communication would have improved the process, 26% said greater cost transparency would have, 14% wanted more effective visualization tools and 12% wanted easier digital payment options (Houzz, Renovation Plans Report news release, Dec 2025).
Do owners use AI to plan a project?
For ideas, yes. For contracts, rarely. 22% of renovating homeowners used AI tools for their projects in 2026, 64% of those users sought renovation ideas and 6% used AI to understand contracts, and 41% of Millennials used it against 7% of Seniors (Houzz, 2026 U.S. Houzz State of AI in Construction and Design Report, Sep 2026).
What rules apply to the crew?
Paid work in older homes carries a lead rule. Approximately three-quarters of US homes built before 1978 still contain some lead-based paint, and anyone paid to disturb painted surfaces in those homes must be certified in lead-safe work practices and have trained employees (EPA, Lead Renovation, Repair and Painting Program, Jun 2026).
How much renovation spending is need, not choice?
Replacement work is the largest slice of what owners spend. Roofs, windows and HVAC wear out on their own schedule, and energy-related projects are now more than a third of the market.
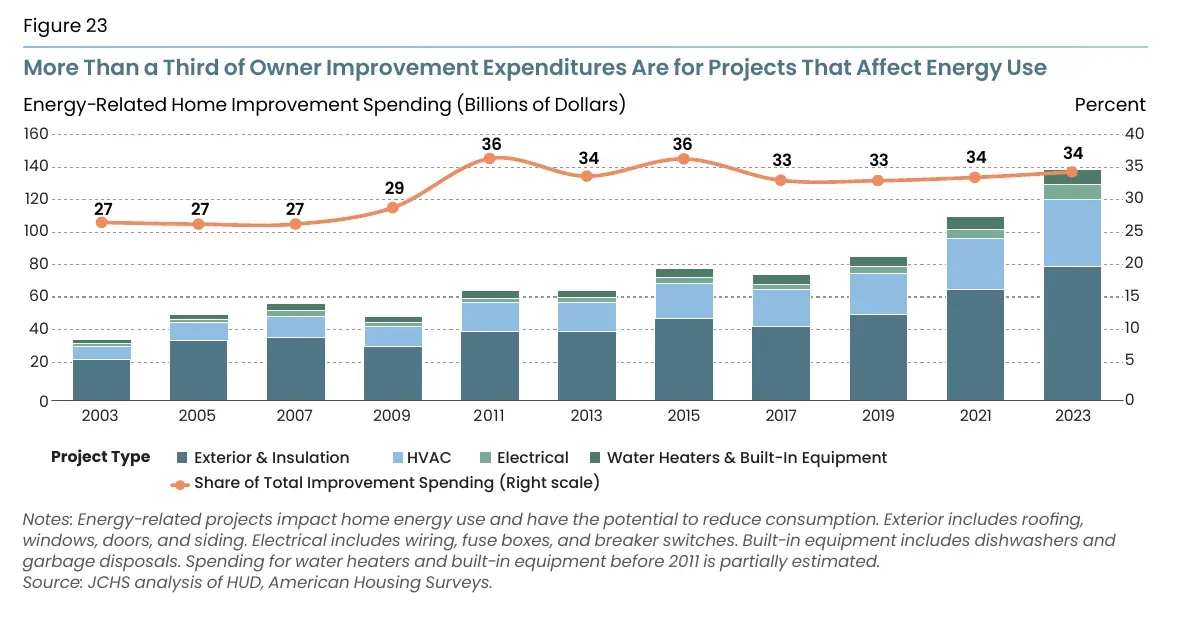 Figure 8: Spending on projects that change a home’s energy use has climbed to nearly four times its 2003 level and now exceeds a third of all improvement dollars. Source: Harvard JCHS, Improving America’s Housing 2025, Mar 2025. Chart published by the source, captured 20 Oct 2026.
How much is replacement and how much is upgrade?
Wants are the smaller share. In 2023, discretionary projects such as kitchen and bath remodels were 30% of aggregate owner improvement spending, outside property projects such as fencing and sheds were 15%, and disaster repairs were 6% (Harvard JCHS, Improving America’s Housing 2025, Mar 2025).
- In homes built before 1940, replacements were half of all remodeling spending, against 9% in homes built in 2020 or later (Harvard JCHS, Improving America’s Housing 2025, Mar 2025).
How big is energy-related spending?
Bigger than ever. Energy-related spending rose 25% from $111 billion in 2021, ahead of the 22% gain for improvements overall (Harvard JCHS, Improving America’s Housing 2025, Mar 2025).
- Energy-related projects were 34% of all improvement spending in 2023, up from 27% in 2003 (Harvard JCHS, Improving America’s Housing 2025, Mar 2025).
- Roofing replacements were a third of that spending ($46 billion), and HVAC was 29% ($40 billion) (Harvard JCHS, Improving America’s Housing 2025, Mar 2025).
Who does energy work, and why?
Owners of older homes. In 2022 and 2023, 17% of owners (14.7 million households) completed a project to improve energy efficiency, up from 15% in 2018 and 2019 (Harvard JCHS, Improving America’s Housing 2025, Mar 2025).
- 19% of owners in homes built before 1960 did an energy-efficiency project, against 7% in homes built since 2010 (Harvard JCHS, Improving America’s Housing 2025, Mar 2025).
- The typical owner in the lowest income fifth spent 26% of monthly housing costs on energy bills, against 12% for the highest fifth (Harvard JCHS, Improving America’s Housing 2025, Mar 2025).
- Owners in homes built before 2010 spent $1,700 in 2023 on energy-related improvements, nearly three times the $600 spent in homes built since 2010 (Harvard JCHS, Improving America’s Housing 2025, Mar 2025).
What do owners get from a finished renovation?
Livability beats looks, and looks beat resale. Owners judge the job by how the house works, and most would not change how they did it.
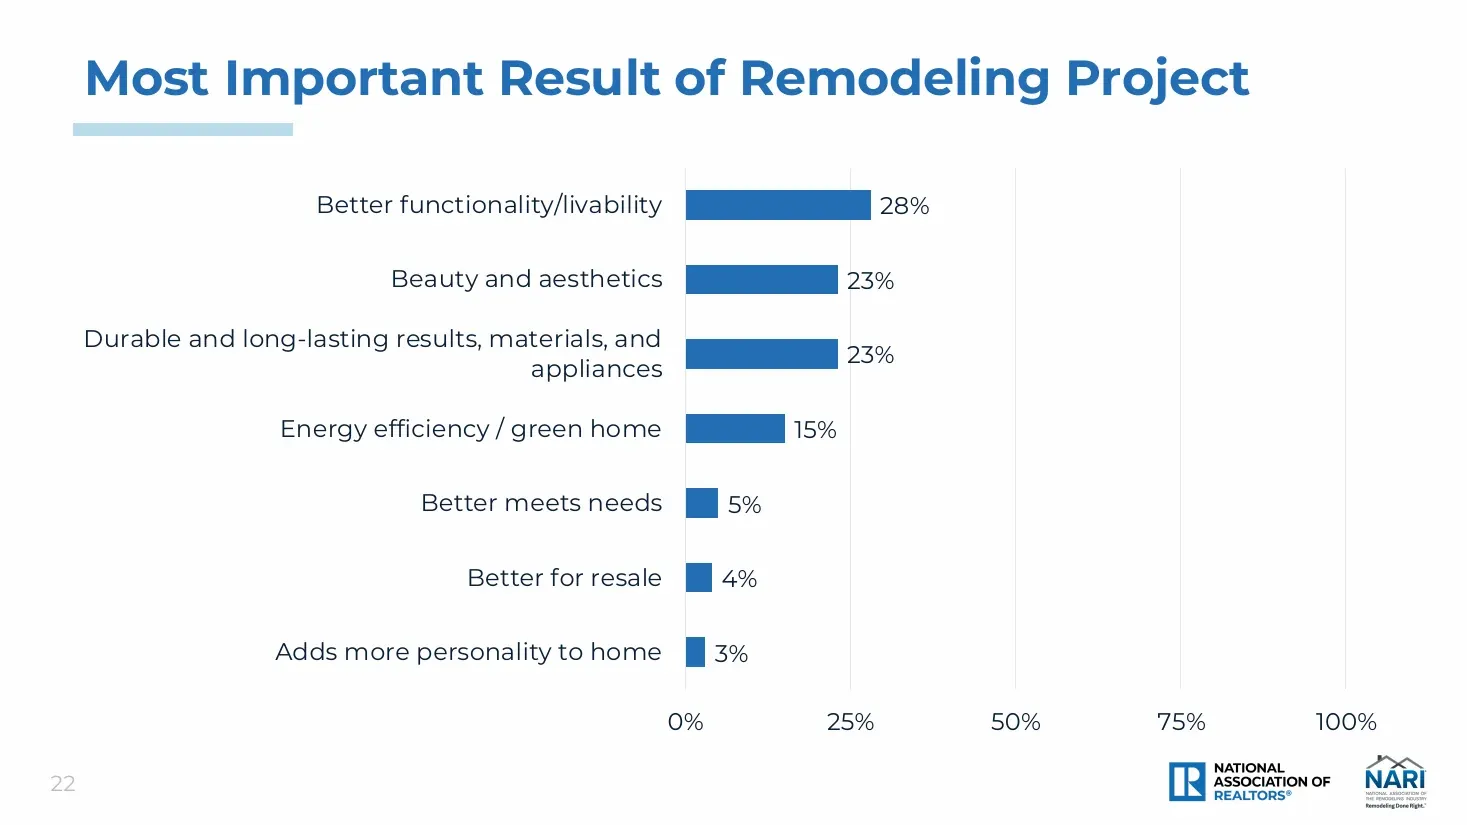 Figure 9: Better functionality and livability is the result owners rank first, ahead of looks and durability, and resale ranks near the bottom. Source: NAR, 2025 Remodeling Impact Report, Apr 2025. Page from the source report, captured 20 Oct 2026.
What result matters most?
Function. 28% of owners said better functionality and livability was the most important result of their project (NAR, 2025 Remodeling Impact Report, Apr 2025).
- 23% named beauty and aesthetics, and 23% named durable, long-lasting results, materials and appliances (NAR, 2025 Remodeling Impact Report, Apr 2025).
- 15% named energy efficiency or a green home, and 4% named better resale (NAR, 2025 Remodeling Impact Report, Apr 2025).
Would owners do it the same way?
Mostly yes. 46% of owners said they would do the project exactly the same way, 30% would make a few different choices on materials, finishes or appliances, and 23% would use a professional (NAR, 2025 Remodeling Impact Report, Apr 2025).
- 43% of owners felt happy and 38% felt satisfied when they saw the finished project, for a typical Joy Score of 8.2 (NAR, 2025 Remodeling Impact Report, Apr 2025).
- 55% felt a major sense of accomplishment when they thought about the finished project, and 25% felt a minor one (NAR, 2025 Remodeling Impact Report, Apr 2025).
- 38% reported the same level of enjoyment in the home, and 16% reported decreased enjoyment (NAR, 2025 Remodeling Impact Report, Apr 2025).
Where is renovation demand heading?
Steady, not hot. Remodelers rate the market well above the break-even line but far below the 2021 peak, and owners say they will keep going with their plans.
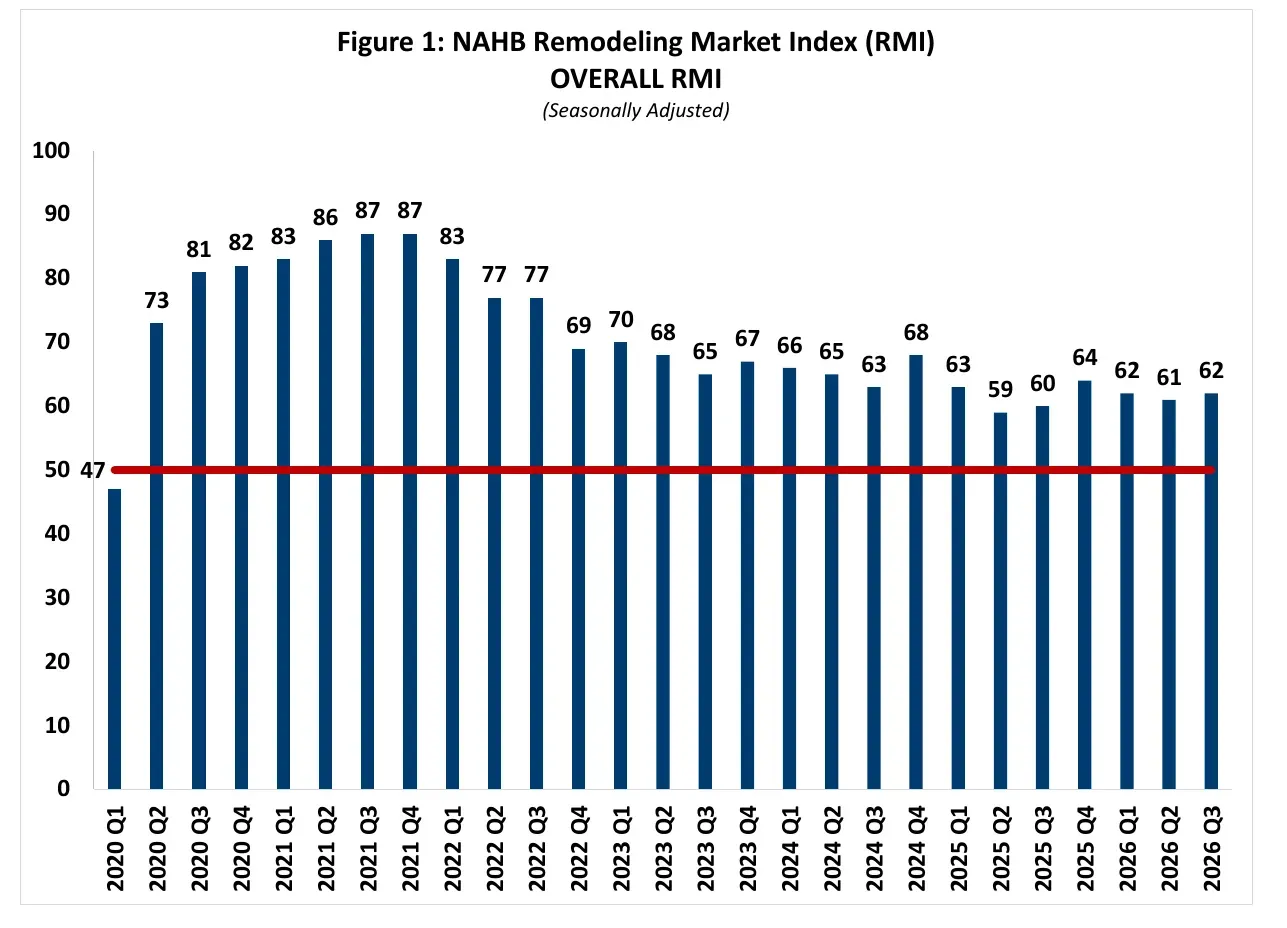 Figure 10: The remodeler sentiment index has settled in the low 60s, well under its 2021 peak but above the 50 line that separates good from poor conditions. Source: NAHB, Remodeling Market Index Q3 2026, Oct 2026. Chart published by the source, captured 20 Oct 2026.
How do remodelers rate the market?
Good, but cooler than 2021. The index peaked at 87 in the third and fourth quarters of 2021 and read 62 in the third quarter of 2026 (NAHB, Remodeling Market Index Q3 2026, Oct 2026).
- The leads and inquiries component read 53, and the backlog component read 56 (NAHB, Remodeling Market Index Q3 2026, Oct 2026).
What do owners say about 2026 plans?
They are going ahead. 91% of homeowners said they will move forward with their planned renovation projects in 2026 (Houzz, Renovation Plans Report news release, Dec 2025).
- Among households earning $150,000 to $200,000, 64% were very confident about their plans, against 32% of households earning $50,000 to $100,000 (Houzz, 2026 U.S. Houzz Renovation Plans Report, Dec 2025).
Methodology and Sources
Every statistic comes from the organization that produced the data, such as Houzz, the Harvard Joint Center for Housing Studies, the National Association of Realtors, the Federal Reserve, the Federal Reserve Bank of New York, ICE, Freddie Mac, NAHB Eye on Housing, the Environmental Protection Agency and the National Association of Home Builders. Roundups and republished lists are not used. Houzz surveys reach registered Houzz users, so they describe engaged online homeowners, not every owner. NAR’s remodeling survey reached 806 people who had finished a project. The Harvard JCHS figures come from the HUD American Housing Survey and describe 2023. Where two sources count different things, such as projects in the Harvard data and survey respondents in the NAR data, the page keeps both and names the difference. The page is reviewed every month and updated when a source publishes new data.
Glossary
- HELOC: home equity line of credit, a revolving loan secured by the home.
- JCHS: the Joint Center for Housing Studies at Harvard University.
- NAR: the National Association of Realtors.
- NAHB: the National Association of Home Builders.
- RMI: the NAHB Remodeling Market Index, a quarterly survey of remodelers where a reading above 50 means more view conditions as good than poor.
- Backlog: the weeks of signed work a contractor has booked ahead.
- Secured home loan: a loan backed by the home, such as a HELOC, a home equity loan or a cash-out refinance.
- Gen Z, Millennials, Gen X, Baby Boomers, Seniors: Pew Research Center age ranges used by Houzz: 18 to 29, 30 to 45, 46 to 61, 62 to 80 and 81 and over.
Sources
- Houzz, 2026 U.S. Houzz and Home Renovation Trends Study, Apr 2026
- Houzz, 2026 U.S. Houzz Renovation Plans Report, Dec 2025
- Houzz, Renovation Plans Report news release, Dec 2025
- Houzz, 2026 U.S. Houzz Outdoor Trends Study, Jun 2026
- Houzz, 2026 U.S. Houzz State of AI in Construction and Design Report, Sep 2026
- Houzz, Q3 2026 U.S. Houzz Pro Industry Barometer, Jul 2026
- Houzz, Q4 2025 U.S. Houzz Renovation Barometer, Oct 2025
- Harvard JCHS, Improving America’s Housing 2025, Mar 2025
- Harvard JCHS, State of the Nation’s Housing 2026 Key Facts, Jun 2026
- NAR, 2025 Remodeling Impact Report, Apr 2025
- New York Fed, Household Debt and Credit Report Q2 2026, Aug 2026
- New York Fed, Survey of Consumer Expectations Housing Survey 2026, May 2026
- Federal Reserve Board, H.8 Assets and Liabilities of Commercial Banks, Oct 2026
- Federal Reserve Board, July 2026 Senior Loan Officer Opinion Survey, Aug 2026
- ICE, October 2026 Mortgage Monitor, Oct 2026
- Freddie Mac, Primary Mortgage Market Survey, Oct 2026
- NAHB, Remodeling Market Index Q3 2026, Oct 2026
- EPA, Lead Renovation, Repair and Painting Program, Jun 2026
- Federal Reserve Board, 2025 Survey of Consumer Finances, Oct 2026
- New York Fed, Liberty Street Economics, Aug 2024
- Freddie Mac, Homeowners Hold Positive Attitudes Toward Renovating, Nov 2022
- NAHB Eye on Housing, Aging in Place, May 2025
- NAHB Eye on Housing, 2024 Home Improvement Loan Applications, Mar 2026