Home maintenance statistics show a job that most owners know they should do and few do on schedule. Spending climbs with the age of the owner, the equipment in the walls is older than the warranty, and the checks that cost nothing, like testing an alarm, are the ones people skip.
This page collects the numbers behind that gap. It covers what owners spend on upkeep, how old the furnaces, water heaters, appliances and windows are, what yearly heating and cooling care involves, how well smoke and carbon monoxide alarms work, and what septic, radon and moisture checks protect against. Every figure comes from the agency, regulator or research body that produced it.
For a shop that sells service, these numbers describe the customer. An owner with old equipment, a skipped tune-up and a repair fund that is too small is the person who calls when something stops working. Last updated November 2026. For related numbers, see homeowner statistics, home repair statistics and HVAC industry statistics.
Key Takeaways
- Households headed by someone 55 to 64 spend $4,155 a year on owned-home maintenance, repairs, insurance and other costs. Under-25 households spend $267 (BLS, Dec 2025).
- More than 90% of homeowners have outstanding repair or maintenance needs. Paint, flooring and windows top the list (Synchrony, Mar 2026).
- 14.68 million owned homes run main heating equipment that is 20 years old or more (EIA, Mar 2023).
- 23.33 million US homes are poorly insulated, and another 3.44 million have no insulation (EIA, Mar 2026).
- 5.46 million US homes run a clothes dryer that is 20 years old or more (EIA, Mar 2026).
- 22.5% of nonconfined home heating fires trace to operational deficiency, which includes failure to clean equipment (USFA, Dec 2021).
- 33% of households with smoke alarms never test them. Only 7% test monthly (CPSC, Sep 2024).
- 16% of homes that believed all alarms would work had at least one alarm with a problem (CPSC, Sep 2024).
- 59% of home fire deaths happened in homes with no smoke alarm or one that failed to operate (NFPA, Jun 2024).
- A septic tank costs $250 to $500 to maintain every three to five years. Replacing a failed system costs $5,000 to $15,000 (EPA, Mar 2026).
- Radon causes about 21,000 lung cancer deaths a year (EPA, Jun 2026).
- EPA advises a furnace or HVAC filter rated at least MERV 13, or as high as the system will take (EPA, Oct 2026).
- 70% of homeowners plan routine upkeep and minor fixes in 2026, more than any other project type (Housecall Pro, May 2026).
How much do owners spend each year to keep a house up?
Upkeep spending is not flat. It rises with the age of the owner and the age of the house, and most of it goes to paid help, not to materials. The plan an owner carries in their head is usually far smaller than the bill that arrives.
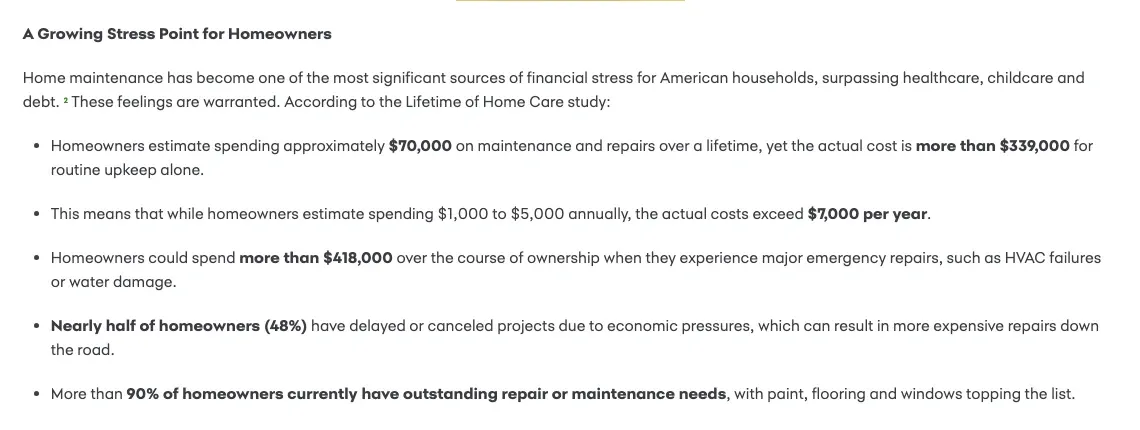 Figure 1: Owners expect to spend far less on upkeep than the study found it costs, and emergency repairs push the total higher still. Source: Synchrony, Lifetime of Home Care study announcement, Mar 2026. Screenshot of the source page, captured 20 Oct 2026.
How does upkeep spending change with the age of the owner?
Spending on owned-home maintenance, repairs, insurance and other costs grows from the first home into the late fifties, then levels off.
- The average household headed by someone 25 to 34 spent $1,298 a year on this line in 2024 (BLS Consumer Expenditure Survey by age, Dec 2025).
- Households headed by someone 35 to 44 spent $2,243 (BLS Consumer Expenditure Survey by age, Dec 2025).
- Households headed by someone 45 to 54 spent $3,520 (BLS Consumer Expenditure Survey by age, Dec 2025).
- Households headed by someone 65 or older spent $3,578 (BLS Consumer Expenditure Survey by age, Dec 2025).
- The line takes 6.5% of the total spending of households headed by someone 75 or older (BLS Consumer Expenditure Survey by age, Dec 2025).
- Across all households it averaged $2,926.47, or 3.7% of spending (BLS Consumer Expenditure Survey, Dec 2025).
- 49.57% of households reported spending on it (BLS Consumer Expenditure Survey, Dec 2025).
What do owners buy when they fix and maintain a house?
Most of the money goes to people, not parts. Services outweigh materials by a wide margin, and few households buy a service plan.
- The average household spent $1,742.55 on maintenance and repair services for owned homes, and 23.01% reported any such spending (BLS Consumer Expenditure Survey, Dec 2025).
- Other repair and maintenance services averaged $462.16, with 6.61% of households reporting them (BLS Consumer Expenditure Survey, Dec 2025).
- Maintenance and repair materials averaged $211.39, with 10.27% of households reporting them (BLS Consumer Expenditure Survey, Dec 2025).
- Flooring installation, repair and replacement averaged $129.09 (BLS Consumer Expenditure Survey, Dec 2025).
- Insulation and other maintenance materials averaged $56.38 (BLS Consumer Expenditure Survey, Dec 2025).
- Warranties and service contracts on household appliances averaged $20.82, and 2.22% of owner households reported one (BLS Consumer Expenditure Survey, Dec 2025).
- Electricity for owned homes averaged $1,358.90, and 63.15% of households reported it (BLS Consumer Expenditure Survey, Dec 2025).
- Water and sewer for owned homes averaged $461.52 (BLS Consumer Expenditure Survey, Dec 2025).
- Natural gas for owned homes averaged $400.78, and 39.1% of households reported it (BLS Consumer Expenditure Survey, Dec 2025).
How far do owner plans fall short of the real bill?
Synchrony surveyed 1,522 homeowners aged 18 to 80 in September 2025 and compared their expectations with its own cost model.
- Homeowners could spend more than $418,000 over the course of ownership when major emergency repairs, such as HVAC failures or water damage, are included (Synchrony, Mar 2026).
- 48% of homeowners have delayed or canceled projects because of economic pressure (Synchrony, Mar 2026).
Which jobs are owners planning for 2026?
Two surveys of owners point the same way. Plans lean toward upkeep and repair, and away from optional upgrades.
- 36% of homeowners plan major repairs in 2026, and 44% plan optional improvements (Housecall Pro, May 2026).
- 61% of homeowners named maintain and repair as a main motivation for projects in Q1 2026, down from 71% in Q1 2025 (HIRI, May 2026).
How old are the systems and structures that need upkeep?
Age sets the maintenance bill. A furnace past 20 years and a window with one pane both ask for attention, and the national stock is full of both. The Energy Information Administration counts them every few years.
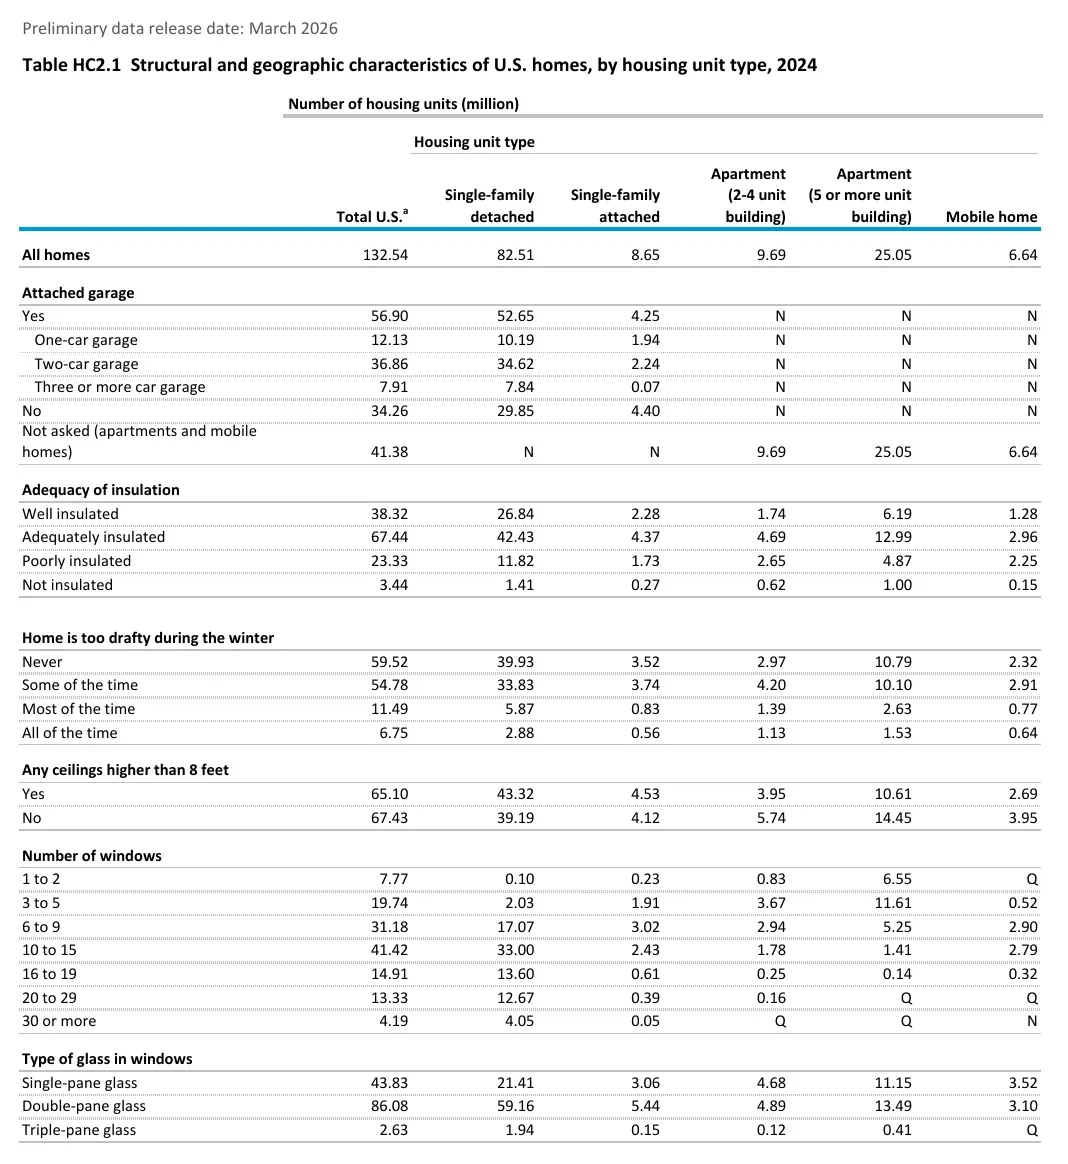 Figure 2: Millions of US homes by insulation, winter drafts and window glass. Tens of millions have thin insulation or single-pane windows, which raises the load on heating and cooling equipment. Source: EIA, Residential Energy Consumption Survey 2024, Table HC2.1, Mar 2026. Screenshot of the source table, rendered from the source PDF, captured 20 Oct 2026.
How old is the heating equipment in owned homes?
Owners hold most of the old equipment, and they are the ones who pay to keep it running.
- 8.85 million rented homes had main heating equipment that was 20 years old or more in 2020 (EIA RECS 2020, Table HC6.2, Mar 2023).
- 10.01 million owned homes had main heating equipment 15 to 19 years old (EIA RECS 2020, Table HC6.2, Mar 2023).
- 15.15 million owned homes had main heating equipment 10 to 14 years old (EIA RECS 2020, Table HC6.2, Mar 2023).
- 9.77 million owned homes had main heating equipment less than 2 years old (EIA RECS 2020, Table HC6.2, Mar 2023).
- Across all homes, 22.29 million had main heating equipment 10 to 14 years old and 26.77 million had equipment 5 to 9 years old (EIA RECS 2020, Table HC6.1, Mar 2023).
How old is the air conditioning in owned homes?
The pattern repeats for cooling, with a long middle of units in the years when parts start to wear.
- 7.46 million owned homes had main air conditioning that was 20 years old or more, against 3.08 million rented homes (EIA RECS 2020, Table HC7.2, Mar 2023).
- 7.71 million owned homes had main air conditioning 15 to 19 years old (EIA RECS 2020, Table HC7.2, Mar 2023).
- 14.13 million owned homes had main air conditioning 10 to 14 years old (EIA RECS 2020, Table HC7.2, Mar 2023).
- 20.56 million owned homes had main air conditioning 5 to 9 years old, and 10.98 million had a unit less than 2 years old (EIA RECS 2020, Table HC7.2, Mar 2023).
How old are water heaters?
Most water heaters are still young, which means the big wave of replacements sits a few years ahead.
- 38.96 million US homes had a main water heater 5 to 9 years old in 2020 (EIA RECS 2020, Table HC8.1, Mar 2023).
- 22.49 million had one 2 to 4 years old (EIA RECS 2020, Table HC8.1, Mar 2023).
- 17.65 million had one less than 2 years old (EIA RECS 2020, Table HC8.1, Mar 2023).
How old are kitchen and laundry appliances?
Appliances age quietly. A count by age shows how many homes sit on machines near the end of their life.
- 7.86 million US homes ran a main refrigerator 15 to 19 years old in 2024, and 6.29 million ran one 20 years old or more (EIA RECS 2024, Table HC3.1, Mar 2026).
- 5.24 million homes had a dishwasher 20 years old or more (EIA RECS 2024, Table HC3.1, Mar 2026).
- 4.26 million homes had a clothes washer 20 years old or more (EIA RECS 2024, Table HC3.1, Mar 2026).
- 111.33 million homes had a clothes dryer, 90.96 million of them electric and 19.09 million natural gas (EIA RECS 2024, Table HC3.1, Mar 2026).
What shape is the building envelope in?
The shell of the house decides how hard the equipment inside has to work.
- 43.83 million homes had single-pane windows in 2024 (EIA RECS 2024, Table HC2.1, Mar 2026).
- 11.49 million homes were too drafty most of the time in winter, and 6.75 million all of the time (EIA RECS 2024, Table HC2.1, Mar 2026).
- 54.05 million homes had an unfinished attic (EIA RECS 2024, Table HC2.1, Mar 2026).
- 39.14 million homes had a basement (EIA RECS 2024, Table HC2.1, Mar 2026).
Which extra equipment adds to the list?
- 10.08 million homes had a hot tub and 9.6 million had a swimming pool (EIA RECS 2024, Table HC2.1, Mar 2026).
- 6.61 million homes had a whole-home or standby generator, and 20.26 million had a portable one (EIA RECS 2024, Table HC2.1, Mar 2026).
- 28.72 million homes reported a power outage lasting at least 24 hours (EIA RECS 2024, Table HC2.1, Mar 2026).
What do HVAC maintenance statistics show about furnaces, filters and heating fires?
Heating and cooling is the part of the house where skipped upkeep turns into a fire report. The fire data below is the clearest record of what fails when furnaces, boilers and chimneys are not looked after.
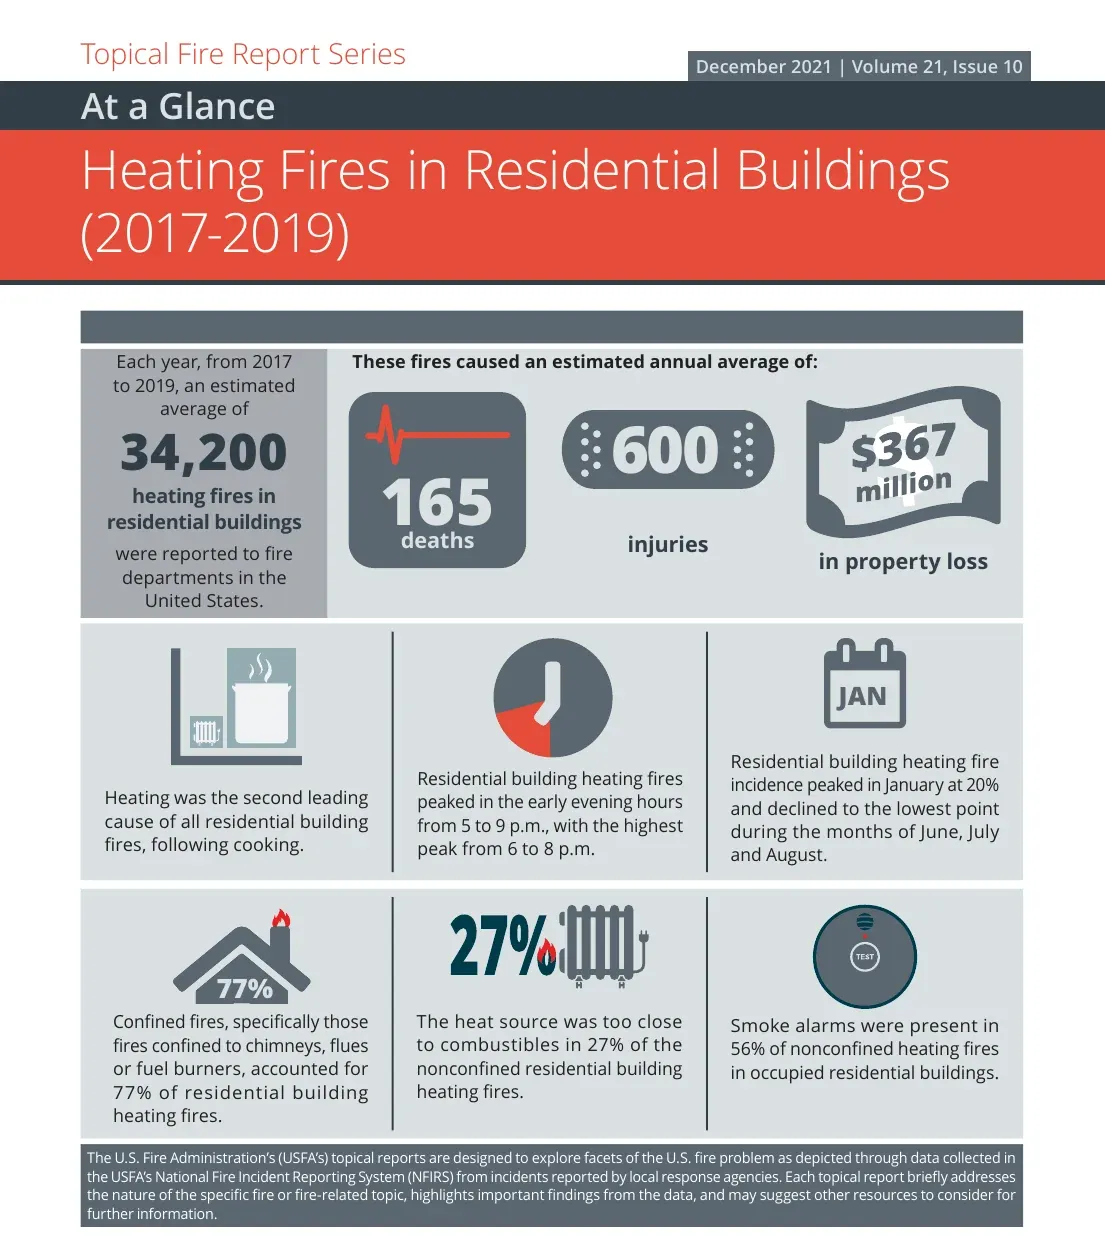 Figure 3: Heating is the second leading cause of residential building fires, and most of these fires start in chimneys, flues and fuel burners that need regular cleaning and checks. Source: USFA, Heating Fires in Residential Buildings (2017-2019) at a glance, Dec 2021. Chart published by the source, captured 20 Oct 2026.
What kinds of furnaces and controls do homes have?
- 53.26 million homes used a natural gas central warm-air furnace as main heating in 2020 (EIA RECS 2020, Table HC6.1, Mar 2023).
- 13.82 million used an electric furnace (EIA RECS 2020, Table HC6.1, Mar 2023).
- 4.03 million used a propane furnace and 3.1 million an oil furnace (EIA RECS 2020, Table HC6.1, Mar 2023).
- 9.29 million used a steam or hot water system (EIA RECS 2020, Table HC6.1, Mar 2023).
- 52.59 million homes had a programmable thermostat and 44.08 million had a non-programmable one (EIA RECS 2020, Table HC6.1, Mar 2023).
- 12.73 million homes had no thermostat (EIA RECS 2020, Table HC6.1, Mar 2023).
- 29.25 million homes used a humidifier, and 4.12 million used it all or almost all of the year (EIA RECS 2020, Table HC6.1, Mar 2023).
What does EPA say about filters?
A filter only works while the system runs, and the system does not run most of the day.
- HVAC systems usually run less than 25% of the time during heating and cooling seasons (EPA, Oct 2026).
- Filters rated MERV 13 and above must show at least 50% removal efficiency for the smallest particles tested (EPA, Oct 2026).
Where do home heating fires start?
- Heating fires in residential buildings averaged 34,200 a year from 2017 to 2019, with 165 deaths, 600 injuries and $367 million in property loss (USFA, Dec 2021).
- Heating was the second leading cause of residential building fires, at 9% of the total (USFA, Dec 2021).
- 77% of heating fires were confined fires (USFA, Dec 2021).
- 49.43% of heating fires were chimney or flue fires confined to the chimney or flue (USFA, Dec 2021).
- 27.16% were fuel burner or boiler malfunction fires confined to the equipment (USFA, Dec 2021).
- Fuel burner and boiler malfunction fires were 45% of the heating fires in June, July and August (USFA, Dec 2021).
- Heating fires peaked in January at 20% and fell to 2% a month in June, July and August (USFA, Dec 2021).
- 80% of heating fires happened in one- and two-family homes (USFA, Dec 2021).
Why do the larger heating fires start?
USFA coded the factors behind nonconfined heating fires, the larger ones that spread beyond the equipment.
- The heat source was too close to combustibles in 27% of nonconfined heating fires (USFA, Dec 2021).
- Misuse of material or product was named in 33.9% (USFA, Dec 2021).
- Electrical failure or malfunction was named in 21% (USFA, Dec 2021).
- Mechanical failure or malfunction was named in 19.3% (USFA, Dec 2021).
- Design, manufacture or installation deficiency was named in 5.7% (USFA, Dec 2021).
- Smoke alarms were present in 56% of nonconfined heating fires in occupied homes, and automatic extinguishing systems in 5% (USFA, Dec 2021).
How have heating fires changed since then?
- USFA estimated 115 deaths, 525 injuries and $488 million in losses from residential heating fires in 2023 (USFA, Feb 2025).
- Heating fires fell 31% from 2014 to 2023, and heating fire deaths fell 44% (USFA, Feb 2025).
- NFPA counted 44,210 home heating equipment fires a year in 2016 to 2020, with 480 deaths and 1,370 injuries (NFPA heating equipment report, Dec 2022).
- Heating equipment caused 13% of home structure fires and 18% of home fire deaths in that period (NFPA heating equipment report, Dec 2022).
- Space heaters caused one-third of home heating equipment fires and nearly nine in ten of the deaths (NFPA heating equipment report, Dec 2022).
- 46% of heating equipment fires happened from December through February (NFPA heating equipment report, Dec 2022).
- Fires from midnight to 6 a.m. were 13% of the total but 43% of the deaths (NFPA heating equipment report, Dec 2022).
- Fireplace and chimney fires that grew large were 7% of fires and 22% of the property damage (NFPA heating equipment report, Dec 2022).
- NFPA advises that heating equipment and chimneys be inspected and cleaned every year by a qualified professional (NFPA heating equipment report, Dec 2022).
Do smoke and carbon monoxide alarms work when a fire starts?
An alarm is the cheapest piece of upkeep in the house, and the survey record shows it is the one owners trust most and test least. Owning an alarm and having a working alarm are two different things.
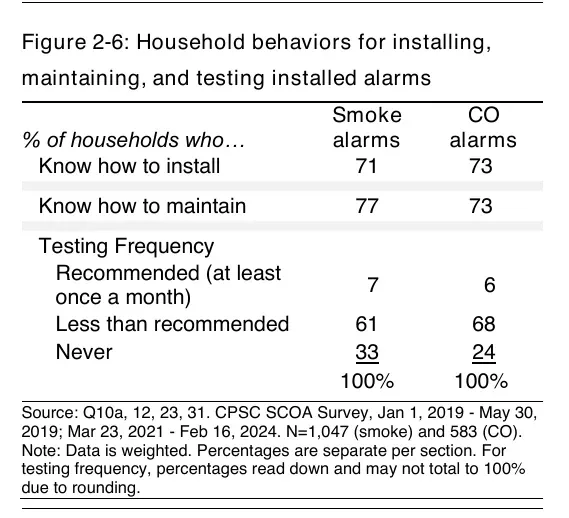 Figure 4: Most households say they know how to maintain an alarm, yet one in three never tests a smoke alarm and almost none test monthly. Source: CPSC, Survey on Use and Functionality of Smoke and Carbon Monoxide Alarms in Households, Figure 2-6, Sep 2024. Screenshot of the source table, rendered from the source PDF, captured 20 Oct 2026.
Do homes have working alarms?
The Consumer Product Safety Commission tested 1,314 alarms in 985 households and surveyed 1,060 households in total.
- 98.6% of households had a smoke alarm, and 54.9% had a carbon monoxide alarm (CPSC, Sep 2024).
- 84% of households had at least one fully functional alarm, with a margin of error of plus or minus 3 percentage points (CPSC, Sep 2024).
- 15% of households had alarms but none that worked, and 1% had no alarms at all (CPSC, Sep 2024).
- Only 51% of households were accurate about the age of all their tested alarms (CPSC, Sep 2024).
- 54% of tested alarms ran on a replaceable battery, 27% on AC power and 16% on a sealed battery (CPSC, Sep 2024).
- 80% of tested alarms were standalone devices, and 20% were part of an interconnected system (CPSC, Sep 2024).
How often do owners test and replace alarms?
- 77% of households with smoke alarms said they know how to maintain them (CPSC, Sep 2024).
- 61% of households with smoke alarms test them less often than recommended (CPSC, Sep 2024).
- 24% of households with carbon monoxide alarms never test them, and 6% test monthly (CPSC, Sep 2024).
- 90% of households called a smoke alarm extremely necessary, against 66% for a carbon monoxide alarm (CPSC, Sep 2024).
- 61% of households said they know little or nothing about carbon monoxide alarms, including 26% who know nothing at all (CPSC, Sep 2024).
- Among homes without a carbon monoxide alarm, 33% said none came with the residence, 19% thought they did not need one and 11% never got around to replacing an old one (CPSC, Sep 2024).
- Only 18% of households looked for fire or carbon monoxide safety information in the prior 12 months (CPSC, Sep 2024).
What do fire records show about alarms?
- Smoke alarms were present in 74% of reported home fires from 2018 to 2022 (NFPA smoke alarm report, Jun 2024).
- Fire departments responded to an estimated 336,848 home structure fires a year in that period (NFPA smoke alarm report, Jun 2024).
- The death rate per 1,000 home fires is about 60% lower in homes with working smoke alarms (NFPA smoke alarm report, Jun 2024).
- Alarms failed to operate in an estimated 19,119 home fires a year where they should have, causing an average of 403 deaths and 1,052 injuries a year (NFPA smoke alarm report, Jun 2024).
- Disconnected or non-working power sources, most often batteries, were the usual reason an alarm failed (NFPA smoke alarm report, Jun 2024).
- Hardwired alarms operated in 94% of fires large enough to trigger them, and battery-only alarms in 85% (NFPA smoke alarm report, Jun 2024).
- 66% of fatal injuries in homes with smoke alarms happened in homes with battery-only alarms (NFPA smoke alarm report, Jun 2024).
- When present, smoke alarms operated in 90% of the reported fires large enough to activate them (NFPA smoke alarm report, Jun 2024).
What do septic systems and water lines need each year?
Water problems rarely announce themselves. EPA’s guidance turns them into schedules and thresholds that an owner or a service shop can check, and the price gap between care and failure is wide.
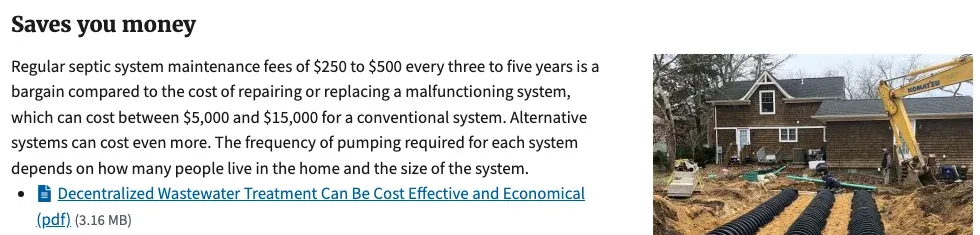 Figure 5: EPA sets a routine septic maintenance fee against the cost of repairing or replacing a failed system. Source: EPA, Why Maintain Your Septic System, Mar 2026. Screenshot of the source page, captured 20 Oct 2026.
How often should a septic tank be inspected and pumped?
- One in five US homes has a septic system (EPA, Aug 2026).
- A septic tank should be inspected every 1 to 3 years and pumped every 3 to 5 years (EPA, Mar 2026).
- A tank should be pumped when the scum layer is within 6 inches of the bottom of the outlet, when the sludge layer is within 12 inches of the outlet, or when more than 25% of the liquid depth is sludge and scum (EPA, Aug 2026).
- A concrete septic tank may last 50 years or more (EPA, Mar 2026).
- Many septic pumps and controls need replacing every 10 to 20 years (EPA, Mar 2026).
- A drainfield older than 25 to 30 years can clog as the natural biomat thickens (EPA, Mar 2026).
- More than four billion gallons of wastewater are dispersed below the ground’s surface every day (EPA, Mar 2026).
What water checks does EPA recommend?
- A family of four that uses more than 12,000 gallons a month in winter, with no outdoor use, likely has a serious leak (EPA WaterSense, Jun 2026).
- Incoming water pressure works best between 45 and 60 pounds per square inch (EPA WaterSense, Jun 2026).
- A toilet dye test takes 10 minutes and should be repeated at least once a year (EPA WaterSense, Jun 2026).
- Replacement kitchen faucets should have a flow rate between 1.5 and 1.8 gallons per minute (EPA WaterSense, Jun 2026).
- A single leaky or running toilet can add as much as 200 gallons of water per day (EPA, Aug 2026).
- Toilets account for 25 to 30 percent of household water use (EPA, Aug 2026).
Which air and moisture checks protect health?
Some upkeep protects the people in the house, not the house. Radon and mold both cost little to check and a great deal to ignore.
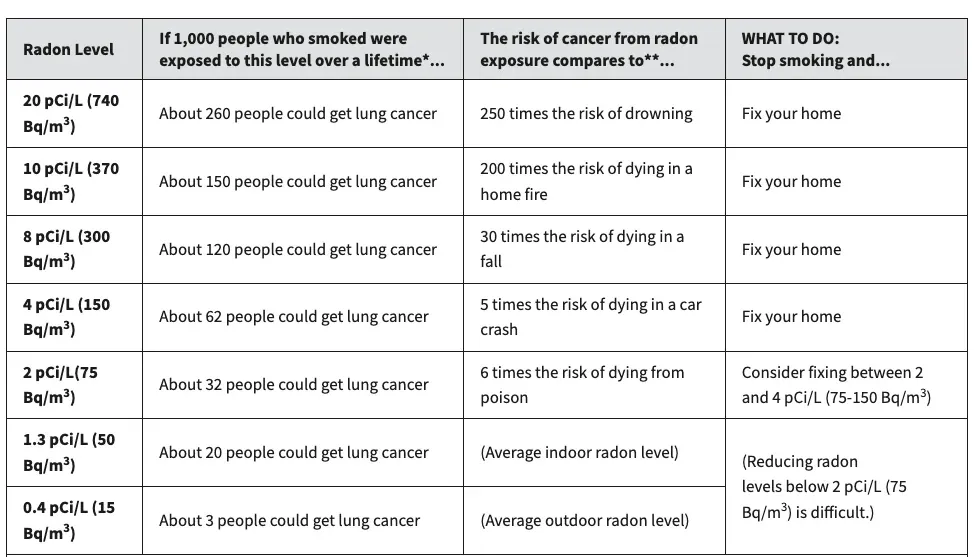 Figure 6: Lung cancer risk for smokers rises with the radon level in the home, and EPA says to fix a home at 4 picocuries per liter or higher. Source: EPA, Health Risk of Radon, Jun 2026. Screenshot of the source page, captured 20 Oct 2026.
How big is the radon risk?
- About 2,900 radon lung cancer deaths a year occur among people who have never smoked (EPA, Jun 2026).
- Radon is the number one cause of lung cancer among non-smokers (EPA, Jun 2026).
- At 4 pCi/L, about 62 of every 1,000 people who smoked could get lung cancer (EPA, Jun 2026).
- At 2 pCi/L the figure is about 32 in 1,000 for people who smoked (EPA, Jun 2026).
- EPA puts the average indoor radon level at 1.3 pCi/L and the average outdoor level at 0.4 pCi/L (EPA, Jun 2026).
- Between 11 and 15 percent of people diagnosed with lung cancer live beyond five years (EPA, Jun 2026).
How fast does moisture turn into mold?
- Wet or damp materials dried within 24 to 48 hours will in most cases not grow mold (EPA, Feb 2026).
- EPA advises keeping indoor humidity below 60 percent, ideally between 30 and 50 percent (EPA, Feb 2026).
- A moldy area under about 10 square feet can usually be handled by the owner (EPA, Feb 2026).
- A humidity meter costs $10 to $50 (EPA, Feb 2026).
Methodology and Sources
Each figure comes from the agency, regulator or research body that produced it, and each link opens the source report, table or release. BLS and EIA numbers come from the downloadable tables. Spending lines from the Consumer Expenditure Survey are averages across all households, so they include households that spent nothing. EIA home counts are in millions of occupied housing units. Where a survey sample is small, the source’s own margin of error applies. The page is refreshed monthly.
Glossary
- BLS: Bureau of Labor Statistics
- CPSC: Consumer Product Safety Commission
- EIA: Energy Information Administration
- EPA: Environmental Protection Agency
- HIRI: Home Improvement Research Institute
- HVAC: heating, ventilation and air conditioning
- MERV: Minimum Efficiency Reporting Value, a rating of how well a filter catches particles
- NFPA: National Fire Protection Association
- pCi/L: picocuries per liter, a unit of radon in air
- RECS: Residential Energy Consumption Survey
- USFA: US Fire Administration
Sources
- BLS, Dec 2025
- BLS Consumer Expenditure Survey, Dec 2025
- CPSC, Sep 2024
- EIA, Mar 2023
- EIA, Mar 2026
- EIA, Mar 2026
- EIA RECS 2020, Table HC6.1, Mar 2023
- EIA RECS 2020, Table HC7.2, Mar 2023
- EIA RECS 2020, Table HC8.1, Mar 2023
- EPA, Mar 2026
- EPA, Jun 2026
- EPA, Oct 2026
- EPA, Aug 2026
- EPA, Aug 2026
- EPA, Feb 2026
- EPA WaterSense, Jun 2026
- HIRI, May 2026
- Housecall Pro, May 2026
- NFPA, Jun 2024
- NFPA heating equipment report, Dec 2022
- Synchrony, Mar 2026
- USFA, Dec 2021
- USFA, Dec 2021
- USFA, Feb 2025
- USFA, Heating Fires in Residential Buildings (2017-2019) at a glance, Dec 2021