Home repair statistics describe a bill that arrives without warning and falls hardest on the owners with the least to spare. A repair need costing $10,000 or more reached 4.1% of occupied homes in 2024, which is 5.4 million households (Federal Reserve Bank of Philadelphia, Home Repair Costs 2025, Dec 2025). Insurance settlements funded 18% of spending on exterior replacements such as roofing, windows and siding in 2023 (Harvard JCHS, Improving America’s Housing 2025 Key Facts, Mar 2025). Savings remain the most common source of funding for home improvements overall.
This page gathers the numbers that matter to homeowners, reporters and the trade shops that do the work: what repairs cost, which parts of a house fail, who can afford the fix, and what storms, fires and power failures add. Most figures come from the American Housing Survey, the federal survey of home condition run by the Census Bureau for HUD, and from the Federal Reserve, Harvard’s Joint Center for Housing Studies, the insurance industry, NFPA and the Energy Information Administration.
Every figure links to the report that produced it and carries a date. The page is refreshed monthly.
Key Takeaways
- Needed repairs to occupied homes were estimated at $198.4 billion in 2024. (Federal Reserve Bank of Philadelphia, Home Repair Costs 2025, Dec 2025)
- Lower-income households live in 29.0% of occupied homes but carry 37.6% of the repair bill. (Federal Reserve Bank of Philadelphia, Home Repair Costs 2025, Dec 2025)
- The average structural repair was estimated at $5,179 in 2024, up 21.3% in two years. (Federal Reserve Bank of Philadelphia, Home Repair Costs 2025, Dec 2025)
- Owners who replaced an HVAC system in 2023 spent an average of $8,398. (Harvard JCHS, Improving America’s Housing 2025, Mar 2025)
- Plumbing repairs averaged $1,841 in 2024, up 31.5% in two years, the steepest rise of any repair type. (Federal Reserve Bank of Philadelphia, Home Repair Costs 2025, Dec 2025)
- Cooling repair needs hit 7.9 million households in 2024, at an average estimated cost of $2,170. (Federal Reserve Bank of Philadelphia, Home Repair Costs 2025, Dec 2025)
- The average homeowners insurance claim cost $20,062 in 2023. (Triple-I, Homeowners and renters insurance, Oct 2026)
- Wind and hail caused 42.5% of homeowners insurance claims in 2023. (Triple-I, Homeowners and renters insurance, Oct 2026)
- $34 billion, or 30%, of homeowners’ 2023 disaster losses was not covered by insurance, according to the Congressional Budget Office. (Harvard JCHS, Improving America’s Housing 2025, Mar 2025)
- Home fires cause an average of $8.9 billion in direct property damage a year. (NFPA, Home Structure Fires, Aug 2025)
- A breakdown of the main cooling equipment was the major culprit in 4.9 million, or 42.1%, of the air-conditioned homes that were uncomfortably hot. (Census Bureau, 13.2 Million Households Were Uncomfortably Hot, Sep 2025)
- 33.9 million households, 1 in 4, lost power at least once in a year. (Census Bureau, 1 in 4 Households Experienced a Power Outage, Oct 2024)
Home repair cost statistics: how big is the national repair bill?
The national repair bill is large, but it is spread thin. Most homes with a problem face a modest fix, and a small group faces a bill that can break a budget.
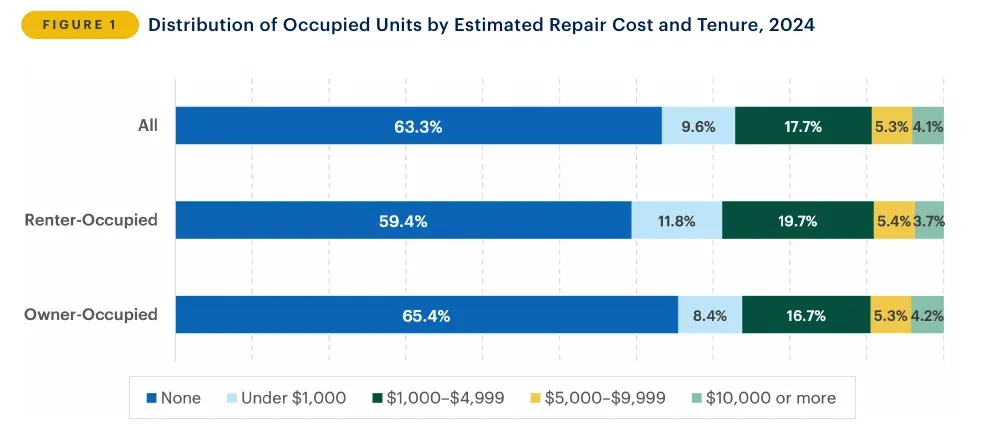 Figure 1: Almost two in three occupied homes had no estimated repair need, and about one in twenty-five faced a bill of $10,000 or more. Source: Federal Reserve Bank of Philadelphia, Home Repair Costs 2025, Dec 2025. Chart published by the source, cropped from the PDF, captured 20 Oct 2026.
How many homes need a repair?
- 36.7% of households in the 2023 American Housing Survey, nearly 49 million, reported at least one repair need (Federal Reserve Bank of Philadelphia, Home Repair Costs 2025, Dec 2025).
- Renters reported a repair need more often than owners, at 40.6% against 34.6% (Federal Reserve Bank of Philadelphia, Home Repair Costs 2025, Dec 2025).
- Among homes with a repair need, the median estimated cost was $1,906 and the average was $4,062 (Federal Reserve Bank of Philadelphia, Home Repair Costs 2025, Dec 2025).
- Owner-occupied homes accounted for $128.2 billion of the estimate and rented homes for $70.1 billion (Federal Reserve Bank of Philadelphia, Home Repair Costs 2025, Dec 2025).
How big are the individual bills?
- Nearly three-quarters of households with a repair need had estimated costs under $5,000 (Federal Reserve Bank of Philadelphia, Home Repair Costs 2025, Dec 2025).
- Another 5.3% of occupied homes faced an estimated bill of $5,000 to $9,999 (Federal Reserve Bank of Philadelphia, Home Repair Costs 2025, Dec 2025).
- The authors call their estimates conservative because the survey does not ask about every problem, and costs rest on 2024 prices for residential contractors (Federal Reserve Bank of Philadelphia, Home Repair Costs 2025, Dec 2025).
Where is the repair bill largest?
- The South carries the largest regional estimate at $80.4 billion (Federal Reserve Bank of Philadelphia, Home Repair Costs 2025, Dec 2025).
- The West follows at $43.2 billion, the Midwest at $41.9 billion and the Northeast at $32.8 billion (Federal Reserve Bank of Philadelphia, Home Repair Costs 2025, Dec 2025).
- Homes outside metro areas averaged $5,082 in estimated repairs, against $3,880 in metro areas (Federal Reserve Bank of Philadelphia, Home Repair Costs 2025, Dec 2025).
- 44.3% of manufactured homes had a repair need, and the average estimate was $5,076 (Federal Reserve Bank of Philadelphia, Home Repair Costs 2025, Dec 2025).
Which repairs are most common, and what do they cost?
Leaks and structural damage are the repairs people report most often, and structural work is the one that eats the budget. Heating, cooling, electrical and plumbing problems are less common and cheaper per job, but they are the calls a trade shop answers.
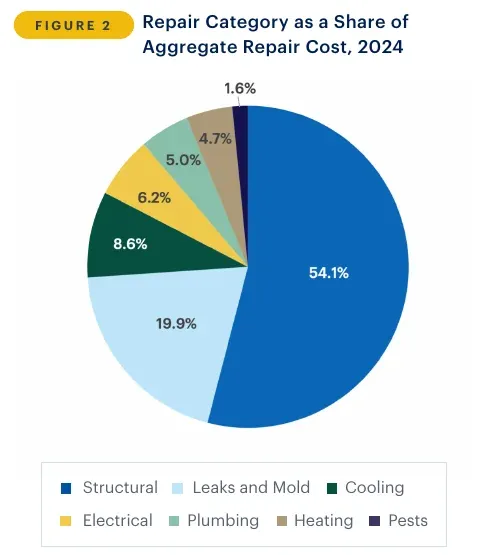 Figure 2: Structural work is more than half of the estimated repair bill, while electrical, plumbing and heating each take about 5% or 6%. Source: Federal Reserve Bank of Philadelphia, Home Repair Costs 2025, Dec 2025. Chart published by the source, cropped from the PDF, captured 20 Oct 2026.
Which problems do households report most?
- 15.7% of households reported leaks and mold, which is 20.9 million homes (Federal Reserve Bank of Philadelphia, Home Repair Costs 2025, Dec 2025).
- 15.6% reported structural problems with doors, windows, roofs, foundations, walls or floors (Federal Reserve Bank of Philadelphia, Home Repair Costs 2025, Dec 2025).
- 5.8% reported electrical problems and 5.6% reported heating problems (Federal Reserve Bank of Philadelphia, Home Repair Costs 2025, Dec 2025).
- 4.3% reported pests and 4.1% reported plumbing problems (Federal Reserve Bank of Philadelphia, Home Repair Costs 2025, Dec 2025).
What does each repair type cost?
- Structural issues made up 54% of the total estimated repair cost, and leaks and mold made up another one-fifth (Federal Reserve Bank of Philadelphia, Home Repair Costs 2025, Dec 2025).
- Electrical repairs averaged $1,595 in 2024, up 18.7% from $1,344 in 2022 (Federal Reserve Bank of Philadelphia, Home Repair Costs 2025, Dec 2025).
- Heating repairs averaged $1,249, up 17.2% from $1,066 (Federal Reserve Bank of Philadelphia, Home Repair Costs 2025, Dec 2025).
- Leak and mold repairs averaged $1,885, up 5.6%, and pest repairs were flat at $539 (Federal Reserve Bank of Philadelphia, Home Repair Costs 2025, Dec 2025).
Are repairs getting more expensive faster than prices overall?
- The aggregate cost of the repair categories tracked in both survey years rose 13.3% after inflation from 2022 to 2024 (Federal Reserve Bank of Philadelphia, Home Repair Costs 2025, Dec 2025).
- Their average nominal cost rose 16.7%, to $3,937, while inflation over the period was 6.4% (Federal Reserve Bank of Philadelphia, Home Repair Costs 2025, Dec 2025).
- 72 of the 80 repair scenarios the Fed priced cost more than in 2022, with a median increase of 10.7% (Federal Reserve Bank of Philadelphia, Home Repair Costs 2025, Dec 2025).
- The number of households with these needs grew 3.3%, slower than the 3.7% growth in households, so higher costs per fix drove most of the increase (Federal Reserve Bank of Philadelphia, Home Repair Costs 2025, Dec 2025).
Does damage invite pests?
- Homes with a sagging roof were about 3.9 times more likely to report roach sightings (Census Bureau, Roaches and Rodents in American Homes, Apr 2021).
- Homes with outside walls that slope, lean or buckle were about 5.6 times more likely to report rodents (Census Bureau, Roaches and Rodents in American Homes, Apr 2021).
- 14.8 million housing units reported seeing mice or rats in the 12 months before the 2019 survey (Census Bureau, Roaches and Rodents in American Homes, Apr 2021).
What do the big replacement jobs cost owners?
Owners now spend more on must-do replacements than on remodels, and the price tags are where a quote either holds or falls apart. These are 2023 averages for owners who did the project, so they mix hired work and do-it-yourself. Total remodeling spending is covered in home improvement statistics.
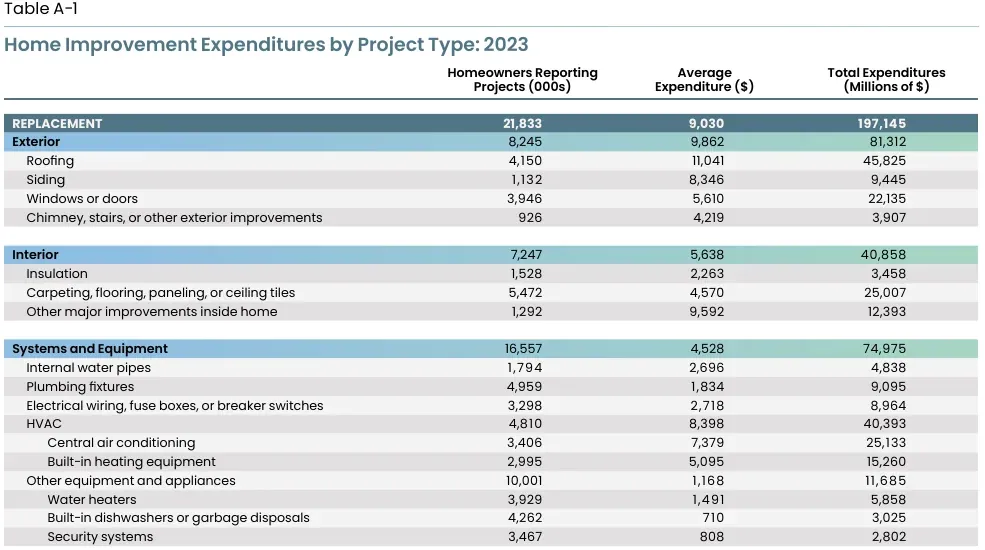 Figure 3: Among exterior and systems jobs, roofing, HVAC and siding cost owners the most per project in 2023, well above plumbing fixtures and water heaters. Source: Harvard JCHS, Improving America’s Housing 2025, Mar 2025, using HUD American Housing Survey data. Table published by the source, cropped from the PDF, captured 20 Oct 2026.
What do HVAC, water heater and plumbing jobs cost?
- 4.81 million owners reported an HVAC project in 2023 (Harvard JCHS, Improving America’s Housing 2025, Mar 2025).
- Central air conditioning projects averaged $7,379 (Harvard JCHS, Improving America’s Housing 2025, Mar 2025).
- Built-in heating equipment projects averaged $5,095 (Harvard JCHS, Improving America’s Housing 2025, Mar 2025).
- Water heater projects averaged $1,491 across 3.93 million owners (Harvard JCHS, Improving America’s Housing 2025, Mar 2025).
- Internal water pipe jobs averaged $2,696, and plumbing fixture jobs averaged $1,834 (Harvard JCHS, Improving America’s Housing 2025, Mar 2025).
- Electrical wiring, fuse box and breaker jobs averaged $2,718 (Harvard JCHS, Improving America’s Housing 2025, Mar 2025).
What do roofing and other building jobs cost?
- Roof replacements averaged $11,041 across 4.15 million owners (Harvard JCHS, Improving America’s Housing 2025, Mar 2025).
- Siding replacements averaged $8,346 (Harvard JCHS, Improving America’s Housing 2025, Mar 2025).
- Window and door replacements averaged $5,610 (Harvard JCHS, Improving America’s Housing 2025, Mar 2025).
- Flooring, carpeting, paneling and ceiling tile replacements averaged $4,570 across 5.47 million owners (Harvard JCHS, Improving America’s Housing 2025, Mar 2025).
How much owner spending goes to must-do work?
- Maintenance spending on owner-occupied homes grew 61% from 2019 to 2023, to $105 billion (Harvard JCHS, Improving America’s Housing 2025 Key Facts, Mar 2025).
- Professionally installed projects made up 84.1% of owner spending in 2023, and do-it-yourself work fell to $64 billion (Harvard JCHS, Improving America’s Housing 2025 Key Facts, Mar 2025).
- Maintenance spending per owner hit a new high of $1,200 in 2023 (Harvard JCHS, Improving America’s Housing 2025 Key Facts, Mar 2025).
Who can afford the fix when a repair hits?
A repair is rarely planned, and the owners who can least absorb it are the ones who spend least on their homes. Harvard’s housing center shows that lower-income owners put what they have into the jobs that cannot wait. Plans that pay for some repairs are covered in home warranty statistics.
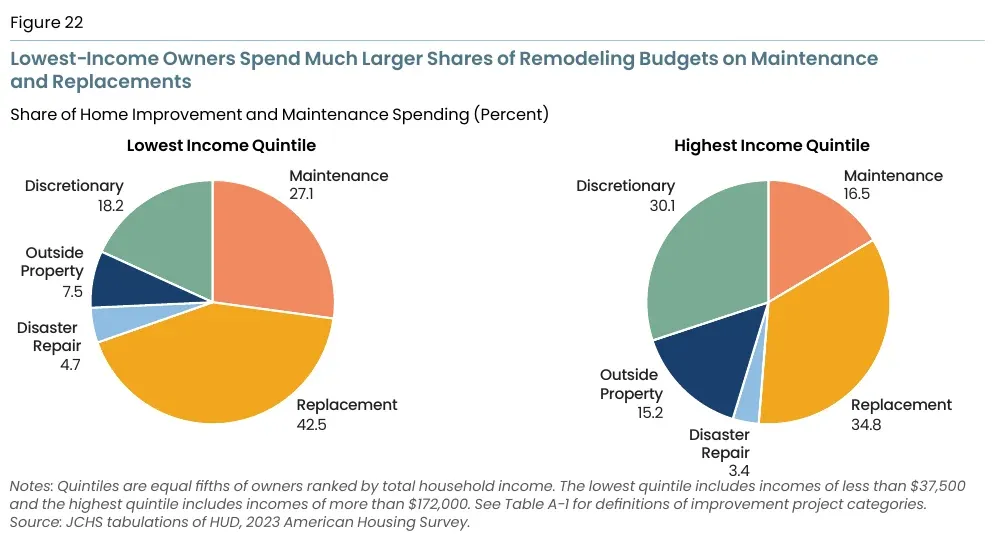 Figure 4: Lower-income owners spend a far larger share of their budget on maintenance and replacements, while higher-income owners put more into discretionary projects. Source: Harvard JCHS, Improving America’s Housing 2025, Mar 2025, using HUD American Housing Survey data. Chart published by the source, cropped from the PDF, captured 20 Oct 2026.
How much do lower-income owners spend on their homes?
- Owners overall spent an average of $7,100 on improvements and repairs in 2023 (Harvard JCHS, Home Repairs Are Out of Reach, Jul 2025).
- 28% of bottom-fifth owners spent nothing on their homes, against 14% of higher-income owners (Harvard JCHS, Home Repairs Are Out of Reach, Jul 2025).
- 18% of bottom-fifth owners spent under $500, against 7% of higher-income owners (Harvard JCHS, Home Repairs Are Out of Reach, Jul 2025).
- Only 14% of lower-income owners spent $10,000 or more, against 38% of higher-income owners (Harvard JCHS, Home Repairs Are Out of Reach, Jul 2025).
What do they spend it on?
- Routine maintenance took 27% of lower-income owners’ spending, against 16% for higher-income owners (Harvard JCHS, Home Repairs Are Out of Reach, Jul 2025).
- Replacements such as roofing, windows, exterior siding, insulation and HVAC took 43%, against 35% (Harvard JCHS, Home Repairs Are Out of Reach, Jul 2025).
- Disaster repairs took 5%, against 3% (Harvard JCHS, Home Repairs Are Out of Reach, Jul 2025).
- Maintenance, replacements and disaster repairs together made up 74% of lower-income owners’ spending, against 55% for higher-income owners (Harvard JCHS, Home Repairs Are Out of Reach, Jul 2025).
- Discretionary projects such as kitchen and bath remodels and room additions took 18% of lower-income owners’ spending, against 30% for higher-income owners (Harvard JCHS, Home Repairs Are Out of Reach, Jul 2025).
Who carries more of the bill?
- Households below the poverty line had a repair need 42.1% of the time, with an average estimate of $4,920 (Federal Reserve Bank of Philadelphia, Home Repair Costs 2025, Dec 2025).
- Households at 200% of poverty or more averaged $3,765 (Federal Reserve Bank of Philadelphia, Home Repair Costs 2025, Dec 2025).
- Native American householders averaged $5,872 in estimated repairs (Federal Reserve Bank of Philadelphia, Home Repair Costs 2025, Dec 2025).
- 46.4% of single women raising children had a repair need (Federal Reserve Bank of Philadelphia, Home Repair Costs 2025, Dec 2025).
Do surprise bills lead to hardship?
- 41% of adults who faced a major unexpected expense also hit a money hardship such as unpaid bills, too little food or skipped medical care, against 28% of those who did not (Federal Reserve Board, Economic Well-Being of U.S. Households in 2025, May 2026).
How does the age of a home change what breaks?
Older homes break more often and cost more to keep up, and the owners of the oldest homes tend to have the least to spend. The housing stock has never been older, and who owns it is covered in homeowner statistics.
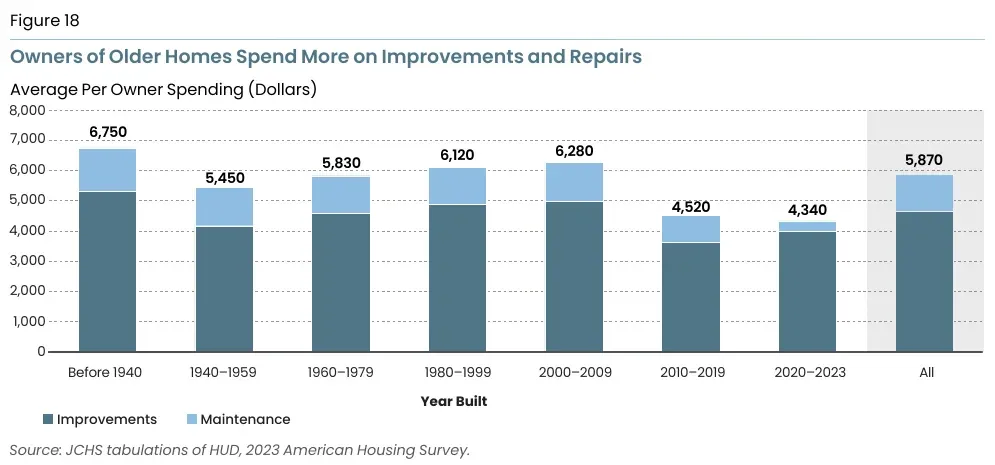 Figure 5: Owners of homes built before 1940 spent far more on upkeep than owners of homes built since 2010, and maintenance is a bigger slice of their budget. Source: Harvard JCHS, Improving America’s Housing 2025, Mar 2025, using HUD American Housing Survey data. Chart published by the source, cropped from the PDF, captured 20 Oct 2026.
How old is the US housing stock?
- The median age of owner-occupied homes hit 42 years in 2023, up from 37 in 2013 and 31 in 2003 (Harvard JCHS, Improving America’s Housing 2025 Key Facts, Mar 2025).
- Counting all homes, the median age was 44 years in 2023, up from 28 years in 1993 (Harvard JCHS, Many Owners Cannot Afford to Maintain Aging Homes, Jul 2026).
- One in four homeowners, 22 million households, lived in a home built before 1960 (Harvard JCHS, Many Owners Cannot Afford to Maintain Aging Homes, Jul 2026).
Do older homes need more repairs?
- 47.7% of owner-occupied homes built in 1939 or earlier had a repair need, against 26.4% of those built in 2000 or later (Federal Reserve Bank of Philadelphia, Home Repair Costs 2025, Dec 2025).
- The average estimate for those oldest owner-occupied homes was $5,228, against $3,596 for the newest (Federal Reserve Bank of Philadelphia, Home Repair Costs 2025, Dec 2025).
- Repairs to those pre-1940 owner-occupied homes add up to an estimated $23.9 billion (Federal Reserve Bank of Philadelphia, Home Repair Costs 2025, Dec 2025).
- Among owner-occupied homes built before 1940, 6.8% were rated inadequate, more than five times the 1.3% rate for homes built in 2010 or later (Harvard JCHS, Improving America’s Housing 2025, Mar 2025).
Do older homes cost more to keep up?
- Owners of homes built before 1960 spent an average of $6,000 on improvements and maintenance, against $4,500 for homes built in 2010 or later (Harvard JCHS, Many Owners Cannot Afford to Maintain Aging Homes, Jul 2026).
- Replacements were 39% of spending on pre-1960 homes and 24% on homes built in 2010 or later (Harvard JCHS, Many Owners Cannot Afford to Maintain Aging Homes, Jul 2026).
- 29% of owners in the lowest income fifth lived in a home built before 1960 (Harvard JCHS, Many Owners Cannot Afford to Maintain Aging Homes, Jul 2026).
- 2.9 million homeowner households, 3.3%, lived in homes HUD rates moderately or severely inadequate (Harvard JCHS, Improving America’s Housing 2025, Mar 2025).
What do homeowners insurance claims show about damage?
Claims are the one place where damage gets a price tag from a third party. They show that wind and hail drive the count of claims, and that fire is rare but costs far more per claim. Water damage claims are covered on the plumbing statistics page.
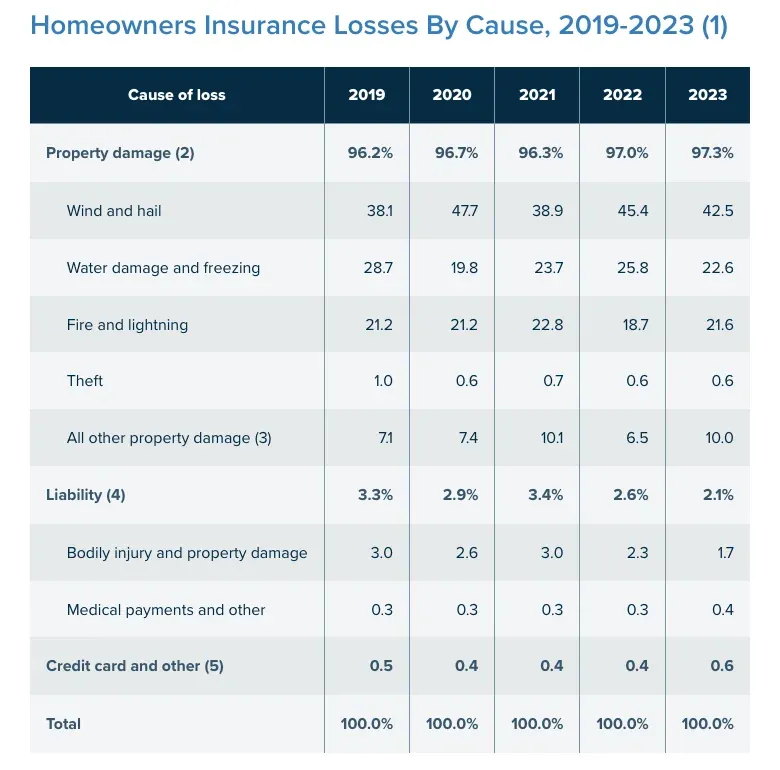 Figure 6: Wind and hail account for the largest share of homeowners insurance claims in every year from 2019 to 2023. Source: Triple-I, Homeowners and renters insurance, Oct 2026, using ISO data. Screenshot of the source page, captured 20 Oct 2026.
How often do owners file a claim?
- 5.3% of insured homes had a claim in 2023, down from 6.4% in 2020 (Triple-I, Homeowners and renters insurance, Oct 2026).
- About 1 in 18 insured homes files a claim each year (Triple-I, Homeowners and renters insurance, Oct 2026).
- About 1 in 35 files a wind or hail claim, and about 1 in 425 files a fire or lightning claim (Triple-I, Homeowners and renters insurance, Oct 2026).
- Property damage, including theft, accounted for 97.3% of claims in 2023 (Triple-I, Homeowners and renters insurance, Oct 2026).
Which causes drive the claims?
- Fire and lightning were 21.6% of claims in 2023 (Triple-I, Homeowners and renters insurance, Oct 2026).
- All other property damage, including vandalism, was 10.0% (Triple-I, Homeowners and renters insurance, Oct 2026).
- Liability claims were 2.1% and theft was 0.6% (Triple-I, Homeowners and renters insurance, Oct 2026).
How much does a claim pay?
- The average claim was $13,884 in 2019, $16,601 in 2021 and $19,740 in 2022 (Triple-I, Homeowners and renters insurance, Oct 2026).
- Fire and lightning claims averaged $88,170 over 2019 to 2023 (Triple-I, Homeowners and renters insurance, Oct 2026).
- Wind and hail claims averaged $14,747, and claims from all other property damage averaged $9,043 (Triple-I, Homeowners and renters insurance, Oct 2026).
- Theft claims averaged $5,524 (Triple-I, Homeowners and renters insurance, Oct 2026).
- 47% of homeowners said they had prepared an inventory of their belongings to document losses, in a 2023 Triple-I and Munich Re survey (Triple-I, Homeowners and renters insurance, Oct 2026).
What do storms and floods add to the repair bill?
Disasters have moved from rare events to a steady line in the repair budget. The number of billion-dollar events keeps climbing, and a share of the damage is never insured. Roof work after storms is covered in roofing industry statistics.
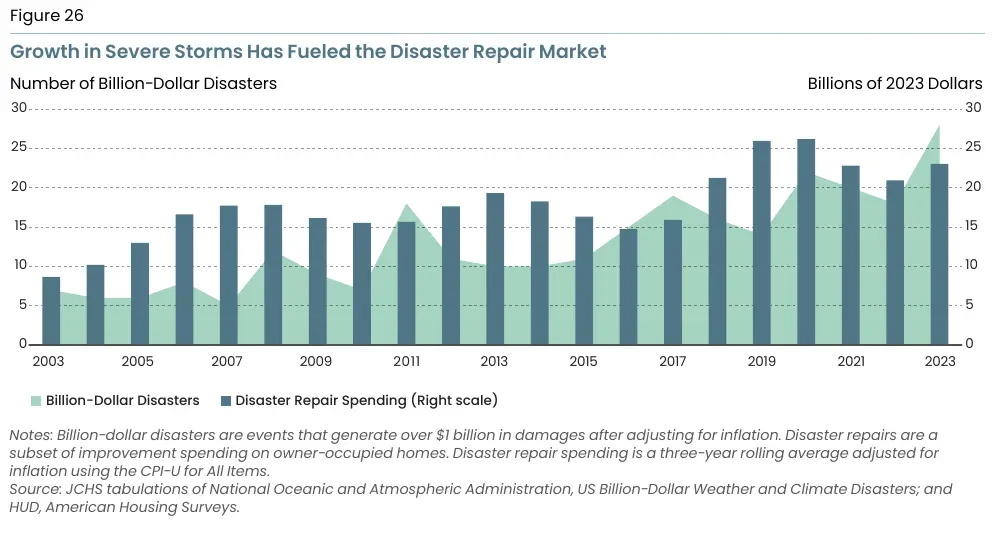 Figure 7: Disaster repair spending by homeowners has risen along with the count of billion-dollar disasters, with spikes after the worst storm seasons. Source: Harvard JCHS, Improving America’s Housing 2025, Mar 2025, using NOAA and HUD data. Chart published by the source, cropped from the PDF, captured 20 Oct 2026.
How fast is the disaster repair market growing?
- Spending to repair disaster damage was 6% of all improvement spending in 2022 and 2023 combined, up from under 4% two decades earlier (Harvard JCHS, Disasters Are a Growing Force, Sep 2025).
- The 2020s have averaged 23.0 billion-dollar disasters a year, against 13.1 in the 2010s (Harvard JCHS, Disasters Are a Growing Force, Sep 2025).
- The count was 6.7 a year in the 2000s, 5.7 in the 1990s and 3.3 in the 1980s (Harvard JCHS, Disasters Are a Growing Force, Sep 2025).
- 2023 set a record at 28 disasters of $1 billion or more, and 2024 came close with 27 (Harvard JCHS, Improving America’s Housing 2025, Mar 2025).
- Homeowners spent an average of $23 billion a year on disaster repairs in 2021 to 2023, against under $9 billion in real terms 20 years earlier (Harvard JCHS, Disasters Are a Growing Force, Sep 2025).
What does a disaster repair cost one owner?
- Owners who restored a home after a disaster spent an average of $22,100 in 2023, up from an inflation-adjusted $17,900 in 2003 (Harvard JCHS, Disasters Are a Growing Force, Sep 2025).
- Hurricanes and tornadoes caused 31% of disaster repair spending in 2023, fires 16% and flooding 8% (Harvard JCHS, Disasters Are a Growing Force, Sep 2025).
- Hail, snow and wind storms caused the largest share at 45% (Harvard JCHS, Disasters Are a Growing Force, Sep 2025).
- Disaster repairs were 51% of home improvement spending in New Orleans in 2022 and 2023 after Hurricane Ida (Harvard JCHS, Disasters Are a Growing Force, Sep 2025).
- FEMA Individual Assistance paid out $1.3 billion to households in 2023 (Harvard JCHS, Disasters Are a Growing Force, Sep 2025).
How large are the biggest insured storm losses?
- Aon estimated insured losses from Hurricane Ian at $54 billion, or $58.9 billion in 2025 dollars (Triple-I, Hurricanes, Jan 2026).
- Aon put Hurricane Ida at $36 billion, or $42.7 billion in 2025 dollars (Triple-I, Hurricanes, Jan 2026).
- Aon estimated the August 2020 Midwest derecho at $9.2 billion in insured losses, or $11.5 billion in 2025 dollars (Triple-I, Tornadoes and thunderstorms, Jan 2026).
- About 1,000 tornadoes are reported in an average year (Triple-I, Tornadoes and thunderstorms, Jan 2026).
Are owners covered?
- The national average homeowner insurance premium jumped 17% between 2021 and 2023, according to the American Housing Survey (Harvard JCHS, Improving America’s Housing 2025, Mar 2025).
- The average homeowners insurance premium rose 11.2% in 2022, according to a May 2025 study by the National Association of Insurance Commissioners (Triple-I, Homeowners and renters insurance, Oct 2026).
- 22% of homeowners said they are at risk of flood, and 78% of those bought flood insurance, 43% through the National Flood Insurance Program and 35% from a private insurer (Triple-I, Flood insurance, Jan 2026).
What do fires and faulty wiring cost?
Fire is rare next to wind and hail claims and costs far more per claim. Wiring and lighting equipment cause the most fire damage by dollars, even though cooking starts more fires. The people who do the wiring are covered in electrician statistics.
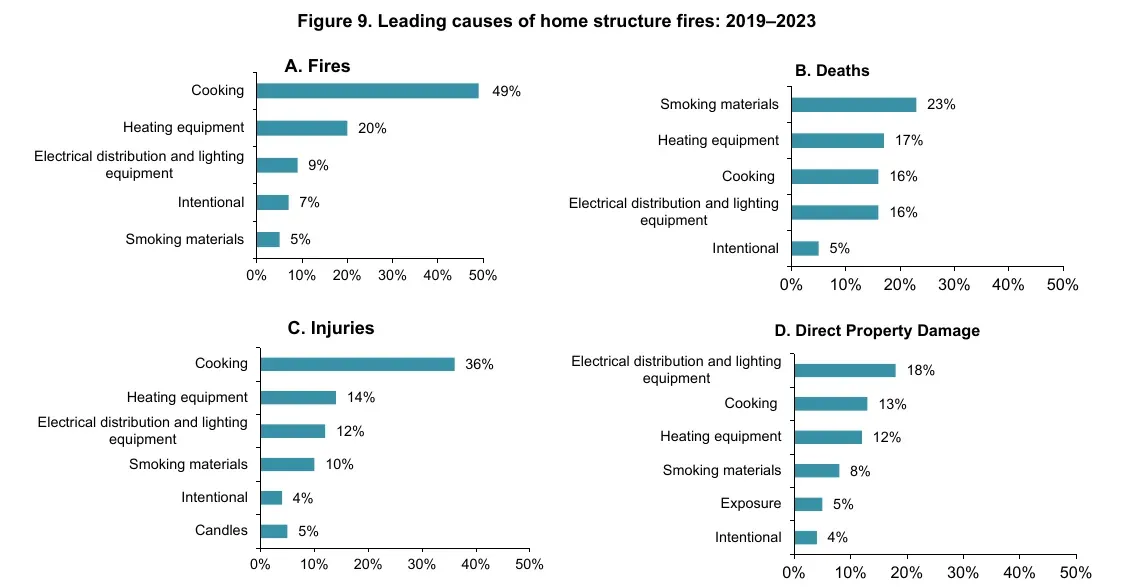 Figure 8: Cooking starts about half of home fires, but electrical distribution and lighting equipment lead on direct property damage. Source: NFPA, Home Structure Fires, Aug 2025. Chart published by the source, cropped from the PDF, captured 20 Oct 2026.
How many home fires happen each year?
- US fire departments responded to an average of 328,590 home structure fires a year in 2019 to 2023 (NFPA, Home Structure Fires, Aug 2025).
- Those fires caused an average of 2,600 civilian deaths and 10,770 civilian injuries a year (NFPA, Home Structure Fires, Aug 2025).
- 24% of all reported fires happened in homes (NFPA, Home Structure Fires, Aug 2025).
- The 2023 estimate of 332,000 home fires was 55% below the 734,000 estimate for 1980 (NFPA, Home Structure Fires, Aug 2025).
What starts home fires?
- Cooking caused 49% of home fires, an average of 159,400 a year, and $1.16 billion in damage (NFPA, Home Structure Fires, Aug 2025).
- Heating equipment caused 20% of fires, an average of 65,000 a year, and $1.1 billion in damage (NFPA, Home Structure Fires, Aug 2025).
- Electrical distribution and lighting equipment caused 31,650 fires a year and $1.6 billion in damage, the leading cause of direct property damage (NFPA, Home Structure Fires, Aug 2025).
- 46% of home fires happened from November to March (NFPA, Home Structure Fires, Aug 2025).
How common are electrical fires in homes?
- Fire departments responded to an average of 46,652 home electrical fires a year in 2020 to 2024 (NFPA, Home Electrical Fires, May 2026).
- They caused an average of 527 civilian deaths, 1,580 civilian injuries and $2.4 billion in direct property damage a year (NFPA, Home Electrical Fires, May 2026).
- Home electrical fires rose from 41,390 in 2010 to 48,757 in 2024 (NFPA, Home Electrical Fires, May 2026).
- The peak was 49,940 fires in 2022 (NFPA, Home Electrical Fires, May 2026).
- They started most often in a kitchen or cooking area (15%), a bedroom (12%) or an attic or ceiling (9%) (NFPA, Home Electrical Fires, May 2026).
- Fires between midnight and 8:00 a.m. were 22% of the total but 52% of the deaths (NFPA, Home Electrical Fires, May 2026).
How often do heating, cooling and power fail?
Equipment that breaks in the worst weather is the repair call that cannot wait. Government surveys count how many homes lose cooling, heat or power each year, and what it does to the house. The workforce that answers those calls is covered in HVAC technician statistics.
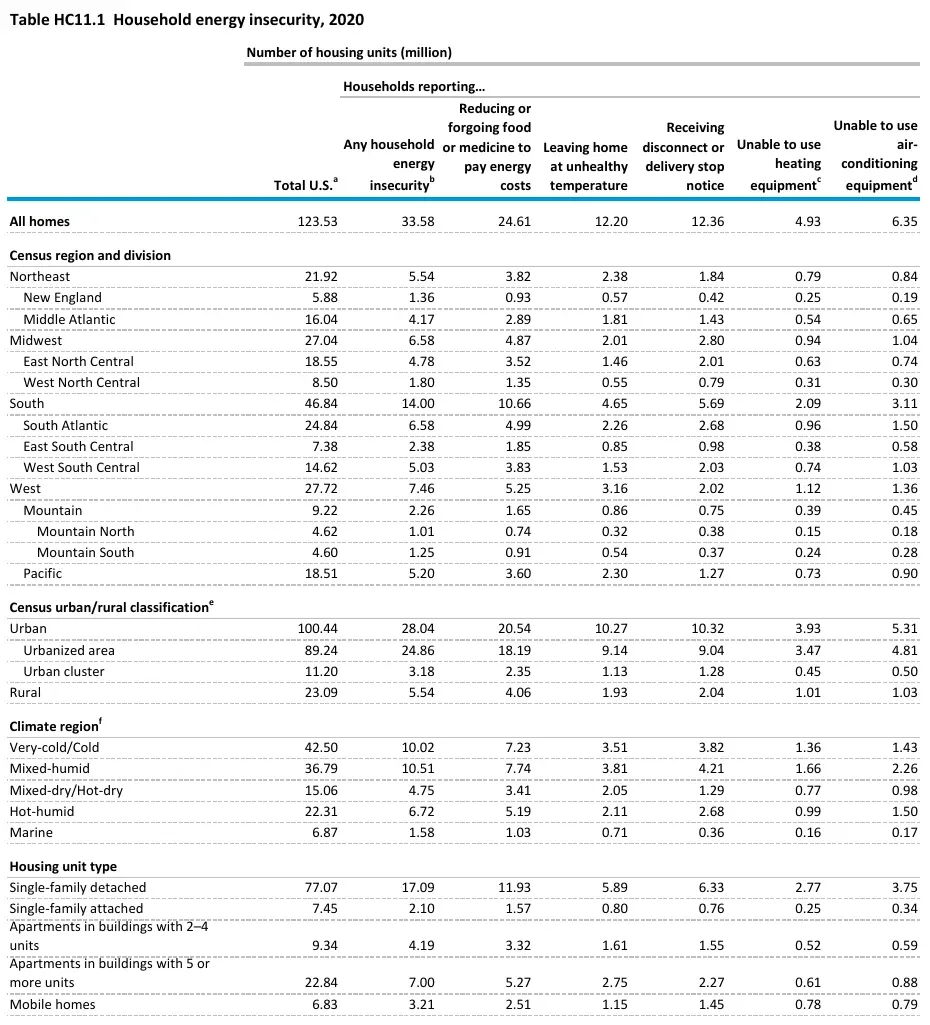 Figure 9: Millions of homes in every region could not run heating or cooling equipment in 2020, either because it was broken and could not be repaired or because of a disruption tied to nonpayment. Source: EIA, RECS 2020 table HC11.1, Aug 2025. Table published by the source, cropped from the PDF, captured 20 Oct 2026.
How many homes lose cooling in the heat?
- 13.2 million households, about 10% of the 133.2 million total, were uncomfortably hot for 24 hours or more at least once in the year before the 2023 American Housing Survey (Census Bureau, 13.2 Million Households Were Uncomfortably Hot, Sep 2025).
- Renters reported it more often than owners, at 13.6% against 8.0% (Census Bureau, 13.2 Million Households Were Uncomfortably Hot, Sep 2025).
- 9.2 million occupied homes, 6.9%, had no air conditioning of any kind (Census Bureau, 13.2 Million Households Were Uncomfortably Hot, Sep 2025).
- Among 124 million homes with air conditioning, 11.6 million, 9.4%, were still uncomfortably hot (Census Bureau, 13.2 Million Households Were Uncomfortably Hot, Sep 2025).
- Nearly 3 million households had one main cooling equipment breakdown lasting six hours or more, and 1.8 million had multiple extended breakdowns (Census Bureau, 13.2 Million Households Were Uncomfortably Hot, Sep 2025).
- Inadequate cooling capacity was reported by 2.6 million households, and utility or power interruptions by 1.3 million (Census Bureau, 13.2 Million Households Were Uncomfortably Hot, Sep 2025).
- Households with cooling needs were more often renters, at 49.2% against 36.5% for households with only other repair needs (Federal Reserve Bank of Philadelphia, Home Repair Costs 2025, Dec 2025).
How many homes cannot run heat or air conditioning?
- 4.93 million homes could not use their main heating equipment at some point in 2020, and 6.35 million could not use air conditioning (EIA, RECS 2020 table HC11.1, Aug 2025).
- The count includes equipment that was broken and could not be repaired, and disruptions caused by missed payment (EIA, RECS 2020 table HC11.1, Aug 2025).
- Owned homes accounted for 2.84 million of the heating cases and 3.83 million of the cooling cases (EIA, RECS 2020 table HC11.1, Aug 2025).
- 1.08 million homes built before 1950 could not use their heating equipment (EIA, RECS 2020 table HC11.1, Aug 2025).
- Under the HUD rating, 1.6 million homes were severely inadequate in 2023, and counting cooling failures the same way would add more than 860,000 homes, a 52% increase (Federal Reserve Bank of Philadelphia, Home Repair Costs 2025, Dec 2025).
What do power outages do to a home?
- 70% of households with an outage, 23.6 million, had at least one that lasted six hours or more (Census Bureau, 1 in 4 Households Experienced a Power Outage, Oct 2024).
- Homeowners reported outages more often than renters, at 28.3% against 19.9% (Census Bureau, 1 in 4 Households Experienced a Power Outage, Oct 2024).
- Rural households reported them at 35.4%, against 22.8% in urban areas (Census Bureau, 1 in 4 Households Experienced a Power Outage, Oct 2024).
- Frozen pipes affected an estimated 673,000 housing units in the previous 12 months (Census Bureau, 1 in 4 Households Experienced a Power Outage, Oct 2024).
- About 343,000 households found water in the basement or crawl space after a sump pump stopped working during an outage (Census Bureau, 1 in 4 Households Experienced a Power Outage, Oct 2024).
- 2.9 million households, 8.4%, reported having to stay away from home overnight because of an outage (Census Bureau, 1 in 4 Households Experienced a Power Outage, Oct 2024).
What are the safety risks of failing equipment?
- More than 400 Americans die each year from unintentional carbon monoxide poisoning not linked to fires (CDC, Carbon Monoxide Poisoning, Jan 2026).
- More than 100,000 people visit an emergency department and more than 14,000 are hospitalized each year (CDC, Carbon Monoxide Poisoning, Jan 2026).
- The CDC lists gas and oil furnaces and water heaters among the sources of carbon monoxide (CDC, Carbon Monoxide Poisoning, Jan 2026).
Methodology and Sources
Every figure comes from the body that produced it: federal agencies and the Federal Reserve system, the American Housing Survey data they publish, university and research bodies, the insurance industry’s research arm and NFPA. No aggregator or roundup is cited. Each number was read in the source text, in a downloaded PDF or in a chart the source published. Repair cost estimates from the Philadelphia Fed are modeled from survey answers and 2024 contractor cost data, so they describe need, not money spent. Survey figures from the Federal Reserve describe adults, not households. The Triple-I homeowners page is an undated rolling page of ISO data, so it carries the month it was read. The page is refreshed monthly.
Glossary
- AHS: the American Housing Survey, run by the Census Bureau for the Department of Housing and Urban Development.
- HUD: the US Department of Housing and Urban Development.
- JCHS: the Harvard Joint Center for Housing Studies.
- SHED: the Federal Reserve’s Survey of Household Economics and Decisionmaking.
- RECS: the Residential Energy Consumption Survey, run by the Energy Information Administration.
- NFPA: the National Fire Protection Association.
- Triple-I: the Insurance Information Institute.
- ISO: the Verisk unit whose claims data Triple-I reports.
- Inadequate home: a home HUD rates as having multiple structural deficiencies or serious problems with plumbing, electrical or heating.
- Structural repair: work on doors, windows, roofs, foundations, walls or floors.
Sources
- Federal Reserve Bank of Philadelphia, Home Repair Costs 2025, Dec 2025
- Harvard JCHS, Improving America’s Housing 2025 Key Facts, Mar 2025
- Harvard JCHS, Improving America’s Housing 2025, Mar 2025
- Triple-I, Homeowners and renters insurance, Oct 2026
- NFPA, Home Structure Fires, Aug 2025
- Census Bureau, 13.2 Million Households Were Uncomfortably Hot, Sep 2025
- Census Bureau, 1 in 4 Households Experienced a Power Outage, Oct 2024
- Census Bureau, Roaches and Rodents in American Homes, Apr 2021
- Harvard JCHS, Home Repairs Are Out of Reach, Jul 2025
- Federal Reserve Board, Economic Well-Being of U.S. Households in 2025, May 2026
- Harvard JCHS, Many Owners Cannot Afford to Maintain Aging Homes, Jul 2026
- Harvard JCHS, Disasters Are a Growing Force, Sep 2025
- Triple-I, Hurricanes, Jan 2026
- Triple-I, Tornadoes and thunderstorms, Jan 2026
- Triple-I, Flood insurance, Jan 2026
- NFPA, Home Electrical Fires, May 2026
- EIA, RECS 2020 table HC11.1, Aug 2025
- CDC, Carbon Monoxide Poisoning, Jan 2026