Homeowner statistics show who owns a home, how long they keep it, what it is worth and what it costs to run. For a home service shop, that is the customer list: the people who call when the furnace quits, the roof leaks or the water heater fails.
This page collects the latest numbers from the Census Bureau, the Bureau of Labor Statistics, the Federal Reserve, the Energy Information Administration and other primary sources. Every figure links to the report that published it, with its date. Where two surveys measure ownership in different ways, the page says so.
The pattern is steady ownership, older homes, record equity and rising upkeep. Owners hold more wealth than ever, yet a repair bill still lands in cash. Last updated November 2026.
Key Takeaways
- 65.0% of US households owned their home in the second quarter of 2026 (Census Bureau, Housing Vacancies and Homeownership, Jul 2026).
- There are about 87 million owner-occupied homes in the United States (Census Bureau, HVS Table 4, Jul 2026).
- Only 35.2% of householders under 35 own, against 78.6% of those 65 and older (Census Bureau, Housing Vacancy Survey, Jul 2026).
- The ownership rate is 74.5% for non-Hispanic White households and 45.4% for Black households (Census Bureau, Housing Vacancy Survey, Jul 2026).
- First-time buyers fell to a record low 21% of buyers, and their median age rose to a record 40 (NAR, 2025 Profile of Home Buyers and Sellers, Nov 2025).
- The median owner-occupied home is 42 years old, up from 31 in 2005 (NAHB Eye on Housing, Almost Half of the Owner-Occupied Homes Built Before 1980, Mar 2026).
- The median homeowner holds $458,900 in net worth, against $10,600 for the median renter (Federal Reserve, 2025 Survey of Consumer Finances, Oct 2026).
- Owners’ equity in household real estate reached $35.8 trillion in the second quarter of 2026 (Federal Reserve, Financial Accounts Z.1, Sep 2026).
- Each homeowner with a mortgage has an average of $310,000 in equity they could borrow against (Cotality, Homeowner Equity Insights Q2 2026, Sep 2026).
- Homeowners spend $4,481 a year on maintenance, repairs, insurance and other upkeep (BLS, Consumer Expenditure Survey housing tenure table, Dec 2025).
- A mortgage on the median home takes about 33% of median family income, an all-time high and up from 26% in 2022 (Federal Reserve, 2025 Survey of Consumer Finances, Oct 2026).
- Owners with a mortgage pay a median $1,904 a month on housing, against $629 for owners without one (Census Bureau, Housing Availability and Affordability: 2023, Sep 2025).
- Almost two in three homeowners have debt secured by their home (Federal Reserve, 2025 Survey of Consumer Finances, Oct 2026).
How many Americans own their home?
Ownership has barely moved in five years, and that stability is the point. The owner base is large, it changes slowly, and it is the group that pays for repairs.
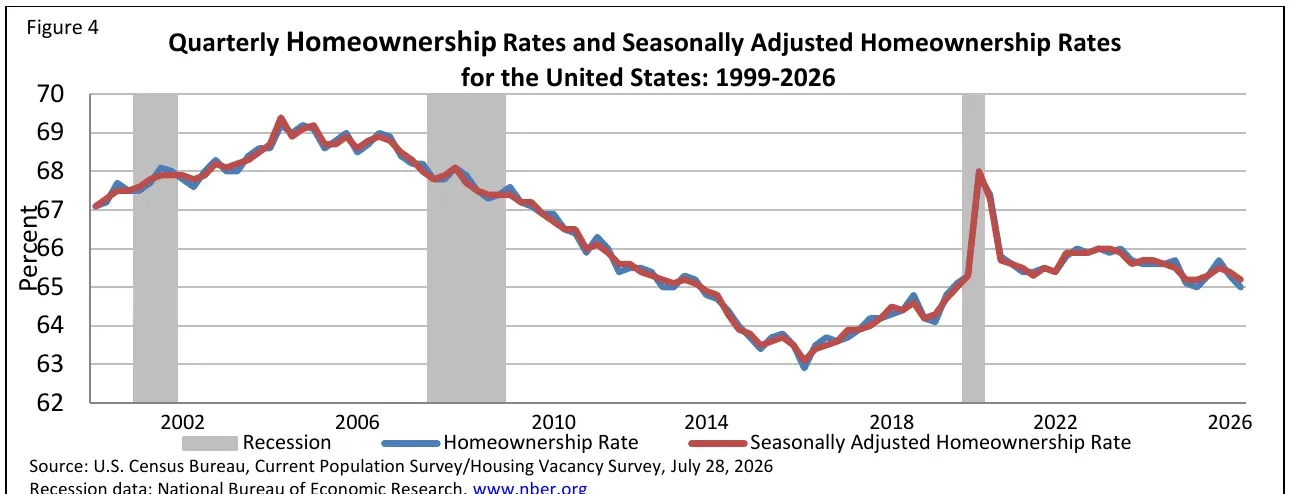 Figure 1: The rate climbed to a peak in the mid-2000s, fell for a decade, spiked in 2020 and has held in a narrow band since, which tells a shop that the owner base is steady. Source: Census Bureau, Quarterly Residential Vacancies and Homeownership, Q2 2026, Jul 2026. Chart published by the source, cropped from its PDF, captured 20 Oct 2026.
How has the rate changed over time?
- The rate peaked at 69.2% in 2004 (Census Bureau, HVS Table 5, Jul 2026).
- It fell to 62.9% in the second quarter of 2016 (Census Bureau, Housing Vacancy Survey, Jul 2026).
- It spiked to 67.9% in the second quarter of 2020, a year the Census Bureau says was affected by pandemic data collection changes (Census Bureau, Housing Vacancy Survey, Jul 2026).
Do other surveys give the same rate?
Each survey counts a different group, so the rates differ by a few points.
- The Federal Reserve’s family survey put the rate at 65.6% in 2025, down from 66.1% in 2022 (Federal Reserve, 2025 Survey of Consumer Finances, Oct 2026).
- The American Community Survey measured 65.2% in 2023 (Census Bureau, Housing Availability and Affordability: 2023, Sep 2025).
- 63% of adults, not households, said they owned their home (Federal Reserve, Economic Well-Being of U.S. Households in 2025, May 2026).
- 65% of consumer units in the spending survey were homeowners (BLS, Consumer Expenditure Survey housing tenure table, Dec 2025).
How many owner-occupied homes are there?
- The American Community Survey counted 86.6 million owner-occupied homes in 2024, against 46.1 million renter-occupied homes (Census Bureau, Homeowner and Rental Vacancies in the ACS, May 2026).
- In 2023, 85.7 million of the 131.3 million occupied homes were owner-occupied (Census Bureau, Housing Availability and Affordability: 2023, Sep 2025).
- The country added 1.0 million owner-occupied homes between 2022 and 2023, and 425,000 rentals (Census Bureau, Housing Availability and Affordability: 2023, Sep 2025).
- Owner-occupied homes make up 58.2% of all housing units, including vacant ones (Census Bureau, HVS Table 4, Jul 2026).
- The Energy Information Administration counts 89.54 million owner-occupied homes in its preliminary 2024 residential survey tables (EIA, RECS 2024 Table HC2.2, Mar 2026).
- The spending survey represents 88.1 million homeowner consumer units (BLS, Consumer Expenditure Survey housing tenure table, Dec 2025).
How many owner homes are for sale?
- The homeowner vacancy rate was 1.2% in the second quarter of 2026, against 1.1% a year earlier (Census Bureau, Housing Vacancy Survey, Jul 2026).
- 1.019 million homes were vacant and for sale only, up from 952,000 a year earlier (Census Bureau, HVS Table 4, Jul 2026).
- The homeowner vacancy rate was 1.5% in principal cities and 1.0% in suburbs (Census Bureau, Housing Vacancy Survey, Jul 2026).
- The American Community Survey put the 2024 rate at 1.0%, down from 2.7% in 2008 (Census Bureau, Homeowner and Rental Vacancies in the ACS, May 2026).
Who owns homes in America?
Age and income predict ownership better than anything else. Young households are far behind older ones, and the gap by income is wider still.
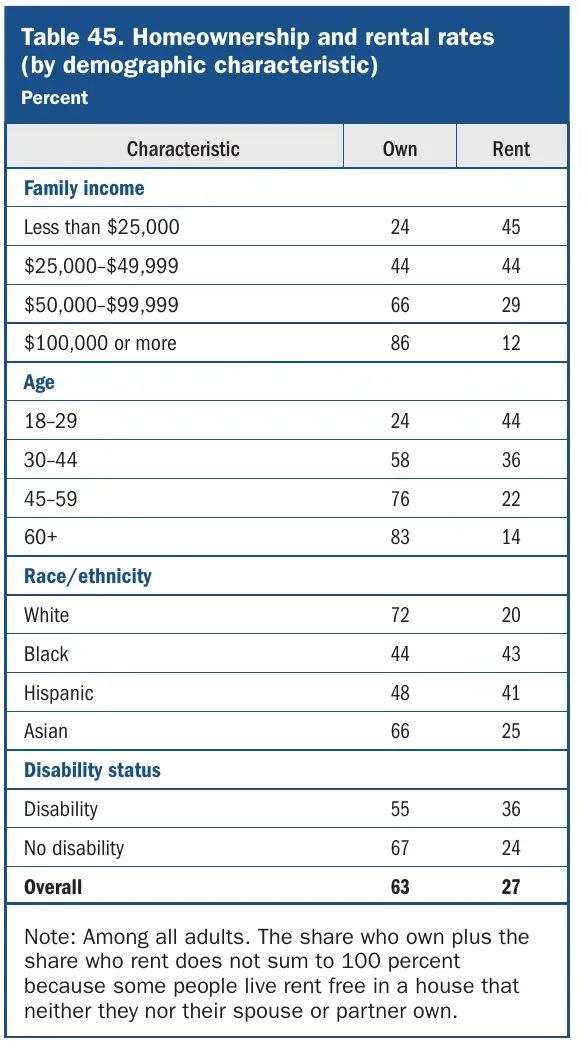 Figure 2: Ownership climbs with income and age, and it differs sharply by race and ethnicity, so the owner base skews older and higher income. Source: Federal Reserve, Economic Well-Being of U.S. Households in 2025, May 2026. Table cropped from the source’s PDF, captured 20 Oct 2026.
How does ownership change with age?
- 23.7% of householders under 25 and 31.3% of those aged 25 to 29 own (Census Bureau, HVS Table 7, Jul 2026).
- Among householders aged 30 to 34, the rate fell to 44.4% from 46.4% a year earlier (Census Bureau, HVS Table 7, Jul 2026).
- The rate peaks at 79.9% for householders aged 70 to 74 (Census Bureau, HVS Table 7, Jul 2026).
- Among adults, 24% of those aged 18 to 29 own, against 58% of those 30 to 44, 76% of those 45 to 59 and 83% of those 60 and older (Federal Reserve, Economic Well-Being of U.S. Households in 2025, May 2026).
- The average age of a homeowner reference person is 56.2, against 44.7 for a renter (BLS, Consumer Expenditure Survey housing tenure table, Dec 2025).
- 54% of consumer units headed by someone 65 or older own their home with no mortgage (BLS, Consumer Expenditure Survey age table, Dec 2025).
How does ownership change with income?
- 77.9% of households with family income at or above the median own, down from 78.7% a year earlier (Census Bureau, Housing Vacancy Survey, Jul 2026).
- 52.1% of households below the median own, up from 51.4% (Census Bureau, Housing Vacancy Survey, Jul 2026).
- 33% of adults with income under $50,000 own, against 86% of those with income of $100,000 or more (Federal Reserve, Economic Well-Being of U.S. Households in 2025, May 2026).
- The average homeowner household has $125,105 in income before taxes, against $65,555 for renters (BLS, Consumer Expenditure Survey housing tenure table, Dec 2025).
- 25.89 million owner homes have household income of $100,000 to $199,999, and 12.61 million have $200,000 or more (EIA, RECS 2024 Table HC9.2, Mar 2026).
How does ownership change by race and ethnicity?
- The rate for Asian, Native Hawaiian and Pacific Islander householders is 58.6%, and for Hispanic householders it is 48.1% (Census Bureau, Housing Vacancy Survey, Jul 2026).
- A year earlier the rate was 40.6% for Black householders and 73.1% for non-Hispanic White householders (Census Bureau, Housing Vacancy Survey, Jul 2026).
- Among adults, 72% of White, 66% of Asian, 48% of Hispanic and 44% of Black adults own (Federal Reserve, Economic Well-Being of U.S. Households in 2025, May 2026).
- Owner householders include 76.30 million who are White alone, 8.24 million who are Hispanic or Latino of any race, 5.84 million who are Black alone and 4.39 million who are Asian alone (EIA, RECS 2024 Table HC9.2, Mar 2026).
Which kinds of households own?
- Married-couple households own at 81.9%, and nonfamily households at 49.7% (Census Bureau, Housing Availability and Affordability: 2023, Sep 2025).
- Householders with a bachelor’s degree or higher own at 72.0%, against 64.1% for those with some college or an associate degree (Census Bureau, Housing Availability and Affordability: 2023, Sep 2025).
- 55% of adults with a disability own, against 67% of adults without one (Federal Reserve, Economic Well-Being of U.S. Households in 2025, May 2026).
- 25.26 million owner homes are one-person households, and 32.48 million are two-person households (EIA, RECS 2024 Table HC9.2, Mar 2026).
- 23.82 million owner homes have children under 18 (EIA, RECS 2024 Table HC9.2, Mar 2026).
- 35.20 million owner householders are retired (EIA, RECS 2024 Table HC9.2, Mar 2026).
Where do owners live?
Ownership runs highest in the Midwest and lowest in the West. The split between city and suburb is wider than the split between regions.
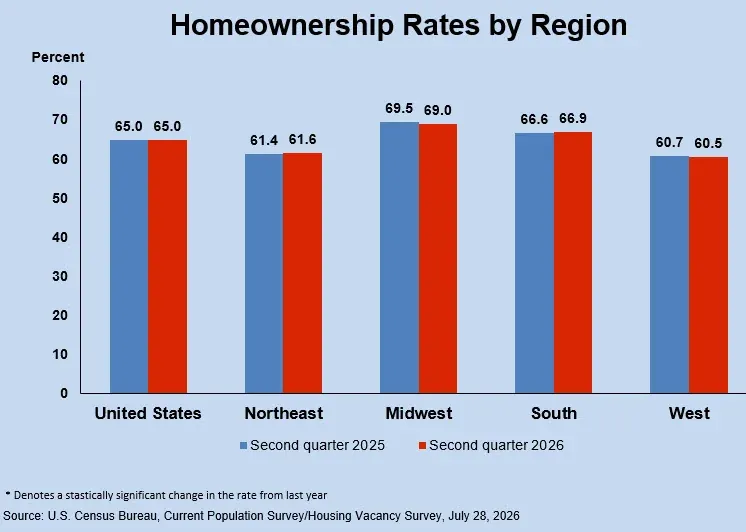 Figure 3: Ownership is highest in the Midwest and lowest in the West, and no region moved much in a year, so regional demand for home services is stable. Source: Census Bureau, Housing Vacancies and Homeownership, Jul 2026. Chart published by the source, captured 20 Oct 2026.
Which regions have the highest ownership?
- The Midwest rate is 69.0% and the South rate is 66.9% (Census Bureau, HVS Table 6, Jul 2026).
- The Northeast rate is 61.6% and the West rate is 60.5% (Census Bureau, HVS Table 6, Jul 2026).
- The South has the most owner-occupied homes at 35.58 million, followed by the Midwest at 20.44 million, the West at 19.06 million and the Northeast at 14.46 million (EIA, RECS 2024 Table HC2.2, Mar 2026).
Do cities and suburbs differ?
- The rate is 50.3% in principal cities, 72.6% in suburbs and 72.8% outside metro areas (Census Bureau, HVS Table 6, Jul 2026).
- 66.68 million owner homes are in urban areas and 22.86 million are in rural areas (EIA, RECS 2024 Table HC2.2, Mar 2026).
What kinds of homes do owners live in?
- 74.25 million owners live in detached single-family homes (EIA, RECS 2024 Table HC2.2, Mar 2026).
- 5.10 million owners live in mobile homes and 4.78 million live in apartments (EIA, RECS 2024 Table HC2.2, Mar 2026).
- 42.80 million owner homes have one story and 32.12 million have two (EIA, RECS 2024 Table HC2.2, Mar 2026).
- 42.90 million owner homes have three bedrooms and 22.60 million have four (EIA, RECS 2024 Table HC2.2, Mar 2026).
How old are owner-occupied homes?
The owner-occupied stock is aging fast because new building has not kept up. Older homes need more repairs and more part replacements.
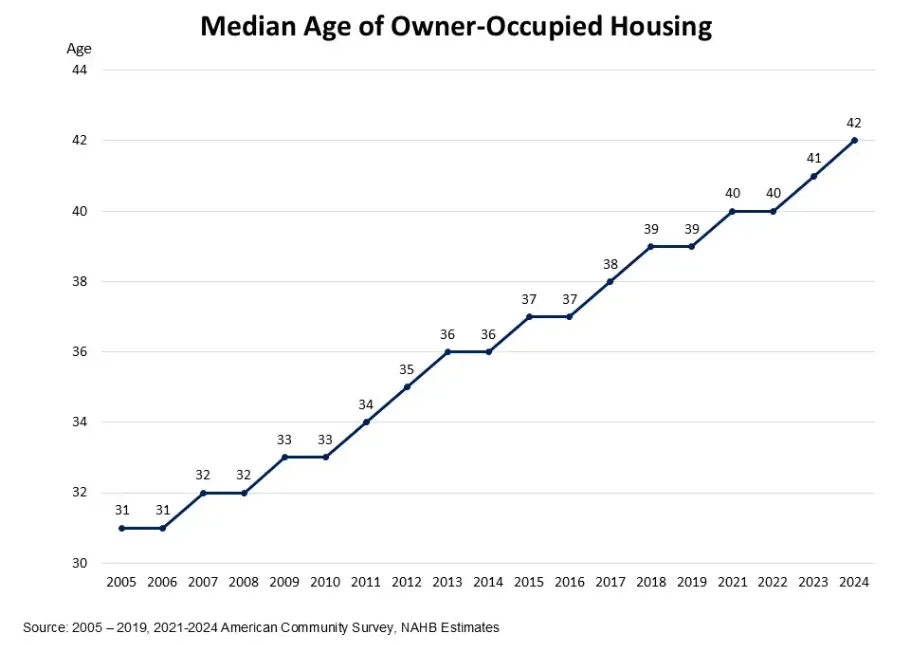 Figure 4: The median owner-occupied home has aged by more than a decade since 2005, which keeps repair and replacement work growing. Source: NAHB Eye on Housing, Almost Half of the Owner-Occupied Homes Built Before 1980, Mar 2026. Screenshot of the source page, cropped to the chart, captured 20 Oct 2026.
How much of the stock is old?
- 47% of owner-occupied homes were built before 1980, and 34% before 1970 (NAHB Eye on Housing, Almost Half of the Owner-Occupied Homes Built Before 1980, Mar 2026).
- The share of owner homes at least 45 years old rose from 39% in 2014 to 47% in 2024 (NAHB Eye on Housing, Almost Half of the Owner-Occupied Homes Built Before 1980, Mar 2026).
- The share built in the past 14 years fell from 18% in 2014 to 13% in 2024 (NAHB Eye on Housing, Almost Half of the Owner-Occupied Homes Built Before 1980, Mar 2026).
- New construction added nearly 3.6 million owner-occupied homes from 2020 to 2024, only 4% of the stock (NAHB Eye on Housing, Almost Half of the Owner-Occupied Homes Built Before 1980, Mar 2026).
- 13.49 million owner homes were built before 1950, and 12.14 million were built in the 1970s (EIA, RECS 2024 Table HC2.2, Mar 2026).
- 4.07 million owner homes were built from 2020 to 2024 (EIA, RECS 2024 Table HC2.2, Mar 2026).
Which states have the oldest homes?
- New York has the oldest owner-occupied homes at a median of 64 years, followed by Massachusetts and Rhode Island at 59 (NAHB Eye on Housing, Age of Housing Stock by State, Mar 2026).
- Nevada has the newest at 25 years, followed by Texas at 28 (NAHB Eye on Housing, Age of Housing Stock by State, Mar 2026).
- 14 of the 15 Sun Belt states sit below the national median, and California is the exception at 45 years (NAHB Eye on Housing, Age of Housing Stock by State, Mar 2026).
How old are the homes of older owners?
- About half of owners aged 55 and older live in homes built before 1980, and 25.4% live in homes built before 1960 (NAHB Eye on Housing, Single-Family Detached Homes Still Dominate Among the 55+ Population, Sep 2026).
- Households headed by someone 55 or older own about 55% of all owner-occupied homes (NAHB Eye on Housing, Single-Family Detached Homes Still Dominate Among the 55+ Population, Sep 2026).
How long do owners stay in their homes?
Owners are staying longer than at any time on record, and today’s mortgage rates give them a reason to stay. Long stays mean the same roof, the same furnace and the same repair calls for years.
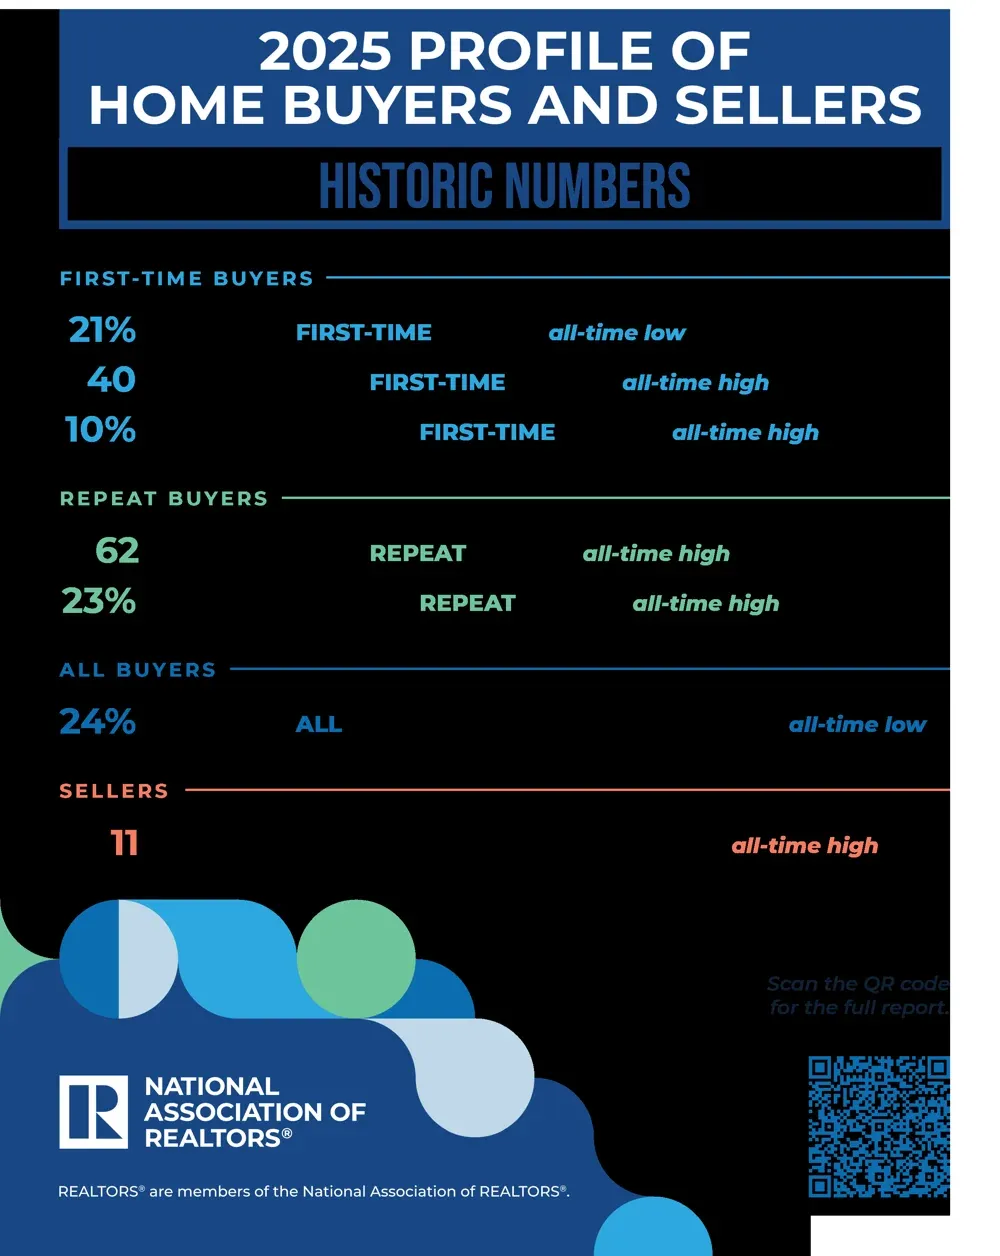 Figure 5: Sellers had owned their home for a record 11 years before selling, while first-time buyers hit a record low share, so fewer homes change hands and owners hold systems longer. Source: NAR, 2025 Profile of Home Buyers and Sellers, Nov 2025. Infographic published by the source, captured 20 Oct 2026.
How long do owners stay before selling?
- The median seller had owned the home for 11 years, an all-time high (NAR, 2025 Profile of Home Buyers and Sellers, Nov 2025).
- 50% of sellers bought a newer home and 34% bought a larger one (NAR, 2025 Profile of Home Buyers and Sellers, Nov 2025).
- The median move was 30 miles, down from 35 miles a year earlier (NAR, 2025 Profile of Home Buyers and Sellers, Nov 2025).
- Among owners aged 55 and older, 29% have lived in their home for 30 years or more, and 23% for 20 to 29 years (NAHB Eye on Housing, Single-Family Detached Homes Still Dominate Among the 55+ Population, Sep 2026).
- The share with 30 or more years in the home rises from 14% at ages 55 to 64 to 56% at age 85 and older (NAHB Eye on Housing, Single-Family Detached Homes Still Dominate Among the 55+ Population, Sep 2026).
Why do some owners plan to move?
- 44% of adults 50 and older expect to move at some point (AARP Research, 2024 Home and Community Preferences, Dec 2024).
- 71% of those planning a move cite the cost of rent or mortgage, and 60% want to lower housing and maintenance costs (AARP Research, 2024 Home and Community Preferences, Dec 2024).
- 55% cite the high cost of property taxes (AARP Research, 2024 Home and Community Preferences, Dec 2024).
- One in four older homeowners would consider building an accessory dwelling unit (AARP Research, 2024 Home and Community Preferences, Dec 2024).
How do mortgage rates lock owners in?
- The 15-year fixed rate averaged 6.71%, against 5.52% a year earlier (Freddie Mac, Primary Mortgage Market Survey, Oct 2026).
- Mortgage rates averaged 6.69% during the July 2024 to June 2025 survey period (NAR, 2025 Profile of Home Buyers and Sellers, Nov 2025).
- Lenders originated $505 billion in new mortgage debt in the second quarter of 2026 (New York Fed, Household Debt and Credit Report, Aug 2026).
- Owners who bought in 2020 hold about $86,000 more equity than owners who bought in 2023 (Cotality, Homeowner Equity Insights Q2 2026, Sep 2026).
Who is buying the homes that do sell?
- Repeat buyers are 79% of buyers, with a median age of 62 (NAR, 2025 Profile of Home Buyers and Sellers, Nov 2025).
- Repeat buyers put down a median 23%, and 30% paid all cash (NAR, 2025 Profile of Home Buyers and Sellers, Nov 2025).
- First-time buyers put down a median 10%, and 59% used personal savings (NAR, 2025 Profile of Home Buyers and Sellers, Nov 2025).
- The first-time buyer share has dropped by 50% since 2007 (NAR, 2025 Profile of Home Buyers and Sellers, Nov 2025).
- The median age of all buyers is 59, and only 24% have children under 18 at home, an all-time low (NAR, 2025 Profile of Home Buyers and Sellers, Nov 2025).
- 14% of buyers chose a multigenerational home, down from 17% in 2024, and 41% of them did it to care for aging parents (NAR, 2025 Profile of Home Buyers and Sellers, Nov 2025).
How much equity do owners hold?
Owners hold record equity, and most of it sits untouched. Equity is the cushion behind every large repair or replacement job.
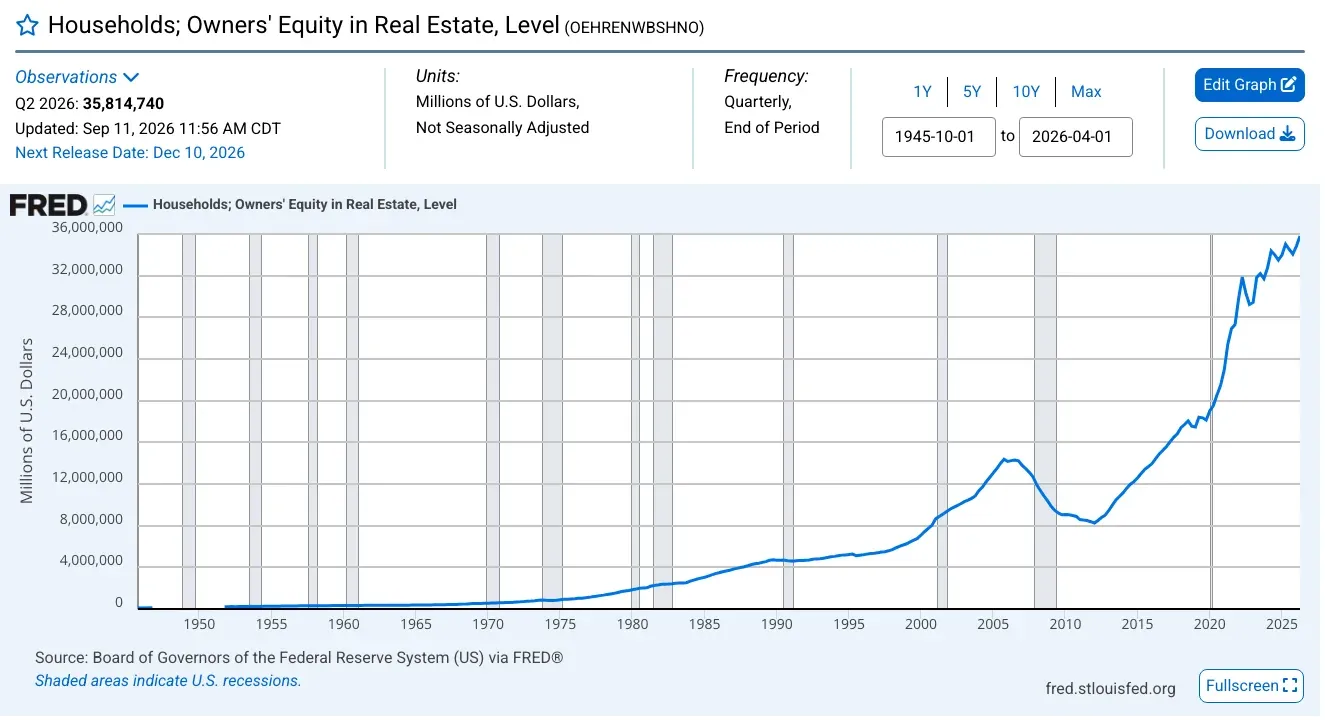 Figure 6: Owners’ equity dropped after 2006 and has since climbed far above its old peak, which means today’s owners can finance large jobs if the price and terms are clear. Source: Federal Reserve Board, Financial Accounts Z.1, retrieved from FRED, Sep 2026. Screenshot of the source page, cropped to the chart, captured 20 Oct 2026.
How big is home equity?
- Households held $49.8 trillion in owner-occupied real estate, against $14.0 trillion in home mortgages (Federal Reserve, Financial Accounts Z.1, Sep 2026).
- Equity was 71.93% of real estate value, against 72.08% a year earlier (Federal Reserve, Financial Accounts Z.1, Sep 2026).
- A year earlier owners’ equity stood at $35.03 trillion (Federal Reserve, Financial Accounts Z.1, Sep 2026).
- Owners with a mortgage hold $17.9 trillion of equity, the average loan-to-value ratio is 44%, and 2.1% of mortgages are underwater (Cotality, Homeowner Equity Insights Q2 2026, Sep 2026).
- Tappable equity totals $11.5 trillion, up $6,000 per owner from the prior quarter (Cotality, Homeowner Equity Insights Q2 2026, Sep 2026).
- Home equity was 31.4% of aggregate wealth for households at or below the 99th percentile of net worth in 2022, second only to retirement accounts (Census Bureau, Housing Availability and Affordability: 2023, Sep 2025).
What is a typical home worth?
- Owners put the median value of their primary residence at $375,000 and the mean at $534,000 (Federal Reserve, 2025 Survey of Consumer Finances, Oct 2026).
- The median net housing value, meaning value minus home-secured debt, was $230,000, up from $218,900 in 2022 (Federal Reserve, 2025 Survey of Consumer Finances, Oct 2026).
- The median owner-occupied home was valued at $340,200 in 2023, the highest since 2008 (Census Bureau, Housing Availability and Affordability: 2023, Sep 2025).
- Homeowners estimate the market value of their home at $478,639 on average (BLS, Consumer Expenditure Survey housing tenure table, Dec 2025).
- The median home was worth more than 4.5 times median family income in 2025, against 3.5 in 2016 (Federal Reserve, 2025 Survey of Consumer Finances, Oct 2026).
Are home prices still rising?
- House prices rose 2.1% from the second quarter of 2025 to the second quarter of 2026 (FHFA, House Price Index Q2 2026, Aug 2026).
- Prices have risen year over year every quarter since the start of 2012 (FHFA, House Price Index Q2 2026, Aug 2026).
- Prices rose in 46 states and the District of Columbia and fell in four, with New Mexico down 1.2% (FHFA, House Price Index Q2 2026, Aug 2026).
- Prices rose in 76 of the 100 largest metro areas (FHFA, House Price Index Q2 2026, Aug 2026).
- The monthly index rose 2.6% from July 2025 to July 2026 (FHFA, House Price Index July 2026, Sep 2026).
Where is equity concentrated?
- Average owner equity is $644,000 in Hawaii, $623,000 in California and $486,000 in Massachusetts (Cotality, Homeowner Equity Insights Q2 2026, Sep 2026).
- It is $109,000 in Louisiana, $124,000 in Oklahoma and $125,000 in Iowa (Cotality, Homeowner Equity Insights Q2 2026, Sep 2026).
- The gap between the highest and lowest state grew from about $395,000 in early 2020 to $534,000 (Cotality, Homeowner Equity Insights Q2 2026, Sep 2026).
Do owners borrow against their equity?
- New second mortgages and home equity lines rose 19.8% in the quarter to $93.7 billion, less than 0.1% of tappable equity (Cotality, Homeowner Equity Insights Q2 2026, Sep 2026).
- Home equity line balances reached $459 billion, the 17th straight quarterly rise (New York Fed, Household Debt and Credit Report, Aug 2026).
- Mortgage balances on credit reports totaled $13.1 trillion at the end of June (New York Fed, Household Debt and Credit Report, Aug 2026).
- About 42% of families have debt secured by their primary residence, with a median of $183,600 (Federal Reserve, 2025 Survey of Consumer Finances, Oct 2026).
What does it cost to own a home each month?
A mortgage is the biggest line, and owners without one pay about a third as much each month. Taxes, insurance and utilities come on top of the loan.
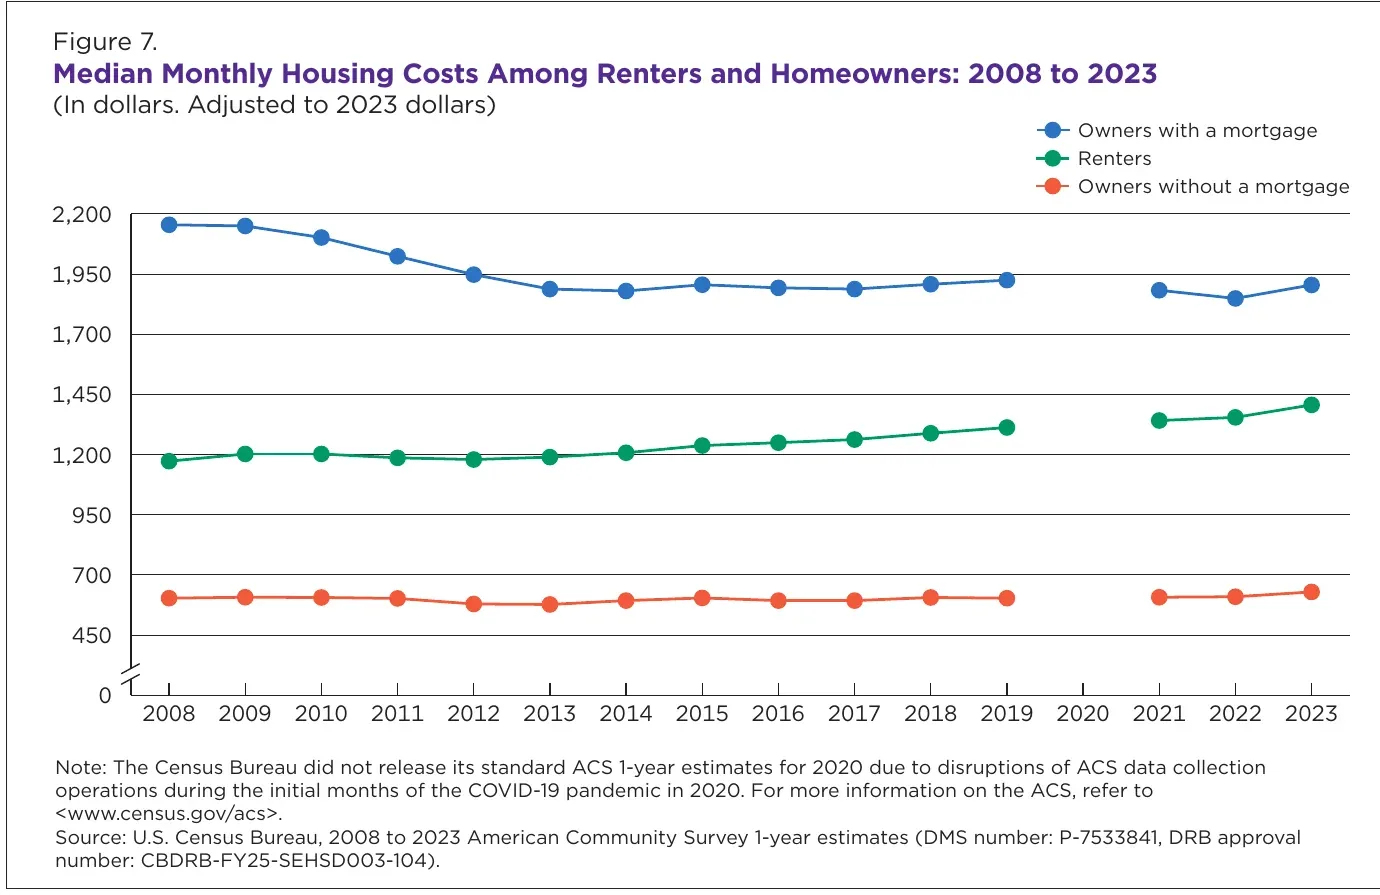 Figure 7: Owners with a mortgage pay about three times what owners without one pay, and the gap has held for fifteen years, so a paid-off home has much more room for repairs in the monthly budget. Source: Census Bureau, Housing Availability and Affordability: 2023, Sep 2025. Chart published by the source, cropped from its PDF, captured 20 Oct 2026.
What do owners pay each month?
- The median across all households is $1,320 a month (Census Bureau, Housing Availability and Affordability: 2023, Sep 2025).
- The median mortgage payment is $1,600, up from $1,500 in 2024, and 64% of owners have a mortgage (Federal Reserve, Economic Well-Being of U.S. Households in 2025, May 2026).
- Owners who moved in 2024 or 2025 pay a median $2,300 (Federal Reserve, Economic Well-Being of U.S. Households in 2025, May 2026).
- The median payment is $1,975 in the West and $1,669 in the Northeast, against $1,550 in the South and $1,350 in the Midwest (Federal Reserve, Economic Well-Being of U.S. Households in 2025, May 2026).
How many owners are cost burdened?
- 13,933,107 owners with a mortgage, or 27.0%, spend more than 30% of income on housing (Census Bureau, Housing Availability and Affordability: 2023, Sep 2025).
- 4,868,990 owners without a mortgage, or 14.3%, do the same (Census Bureau, Housing Availability and Affordability: 2023, Sep 2025).
- 5,868,225 owners with a mortgage, or 11.4%, spend more than half of income on housing (Census Bureau, Housing Availability and Affordability: 2023, Sep 2025).
- 2,490,297 owners without a mortgage, or 7.3%, are severely burdened (Census Bureau, Housing Availability and Affordability: 2023, Sep 2025).
- For comparison, 46.3% of renters are cost burdened (Census Bureau, Housing Availability and Affordability: 2023, Sep 2025).
- Among all households headed by someone 55 or older, owners and renters, severe burden rises from 9.6% at ages 55 to 64 to 18.0% at age 85 and older (NAHB Eye on Housing, Single-Family Detached Homes Still Dominate Among the 55+ Population, Sep 2026).
How much do owners spend on housing in a year?
- Homeowners spend $28,291 a year on housing, 31.4% of their spending, against $22,519 and 39.4% for renters (BLS, Consumer Expenditure Survey housing tenure table, Dec 2025).
- Owned-dwelling costs average $14,293, of which mortgage interest and charges are $5,604 (BLS, Consumer Expenditure Survey housing tenure table, Dec 2025).
- Mortgage interest and charges reach $9,725 for owners with a mortgage (BLS, Consumer Expenditure Survey housing tenure table, Dec 2025).
- Property taxes average $4,208 (BLS, Consumer Expenditure Survey housing tenure table, Dec 2025).
- Utilities, fuels and public services average $5,649, including $2,120 for electricity, $1,090 for water and other public services and $624 for natural gas (BLS, Consumer Expenditure Survey housing tenure table, Dec 2025).
- Homeowners’ total spending averages $90,117, against $57,108 for renters (BLS, Consumer Expenditure Survey housing tenure table, Dec 2025).
- Average housing spending across all households rose 3.3% in 2024, after 4.7% in 2023 (BLS, Consumer Expenditures 2024 release, Dec 2025).
How much do homeowners spend on maintenance and repairs?
Upkeep is a steady yearly cost that owners rarely plan for, and a big repair arrives without warning.
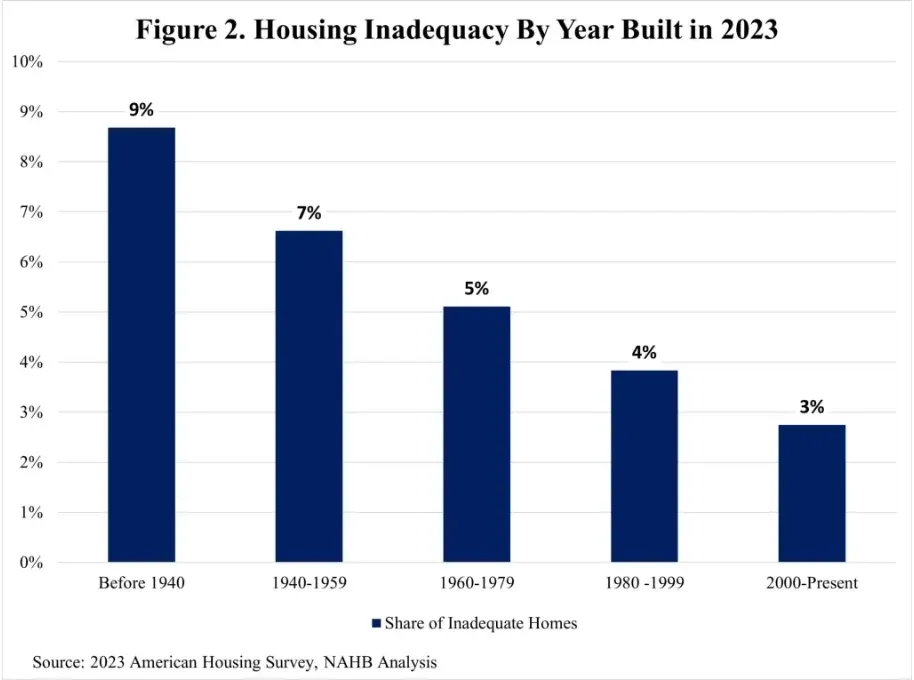 Figure 8: Older homes are inadequate far more often than newer ones, from 9% of homes built before 1940 to 3% of homes built since 2000, so age and repair need rise together. Source: NAHB Eye on Housing, Inadequate Shelter, Dec 2025. Screenshot of the source page, cropped to the chart, captured 20 Oct 2026.
What does homeowner spending on maintenance look like?
- Homeowners with a mortgage spend $4,704 a year on maintenance, repairs, insurance and other costs, and owners without one spend $4,187 (BLS, Consumer Expenditure Survey housing tenure table, Dec 2025).
- That category is 5.0% of all homeowner spending, and 5.9% for owners without a mortgage (BLS, Consumer Expenditure Survey housing tenure table, Dec 2025).
- Household operations average $2,399 a year for homeowners (BLS, Consumer Expenditure Survey housing tenure table, Dec 2025).
- Household furnishings and equipment average $2,975 (BLS, Consumer Expenditure Survey housing tenure table, Dec 2025).
Which owner homes are in poor shape?
- About 6.45 million homes, around 5% of the stock, were classified as inadequate in 2023, and 1.65 million were severely inadequate (NAHB Eye on Housing, Inadequate Shelter, Dec 2025).
- 2.8 million owners and 3.5 million renters lived in inadequate homes (NAHB Eye on Housing, Inadequate Shelter, Dec 2025).
- 1.9 million owners in inadequate homes spent under 30% of income on housing, which suggests many could pay for fixes (NAHB Eye on Housing, Inadequate Shelter, Dec 2025).
How many owners struggle with insurance and payments?
Insurance is where cost pressure shows first. Some owners skip coverage, others cannot afford the coverage they want, and a storm or repair then lands on a thin cushion.
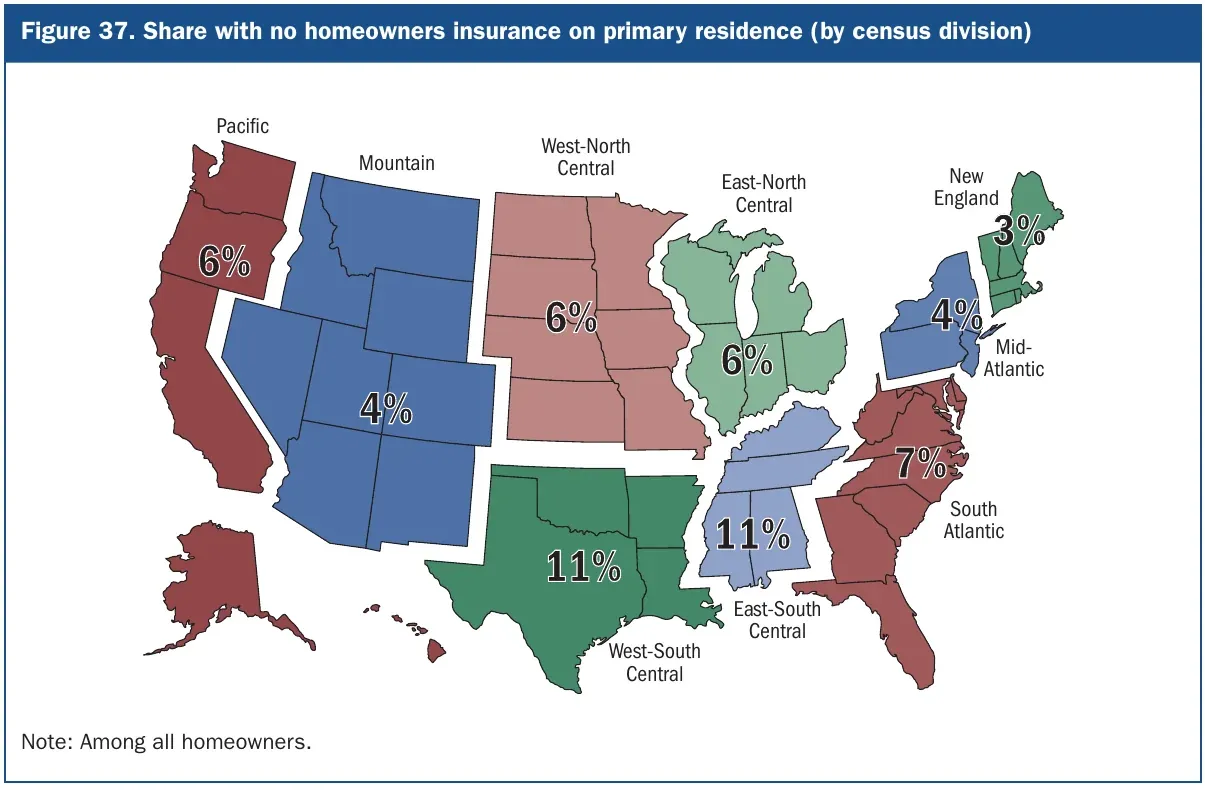 Figure 9: The share of owners with no insurance is highest in the two South Central divisions and lowest in New England, so uninsured homes cluster in the South Central states. Source: Federal Reserve, Economic Well-Being of U.S. Households in 2025, May 2026. Map cropped from the source’s PDF, captured 20 Oct 2026.
Who goes without homeowners insurance?
- Only 3% of owners with a mortgage have no coverage, since lenders generally require it (Federal Reserve, Economic Well-Being of U.S. Households in 2025, May 2026).
- The share is 11% in both the West South Central and East South Central divisions, against 3% in New England (Federal Reserve, Economic Well-Being of U.S. Households in 2025, May 2026).
- 12% of owners in low- or moderate-income neighborhoods have no coverage, against 5% in high-income neighborhoods (Federal Reserve, Economic Well-Being of U.S. Households in 2025, May 2026).
- Roughly 2 in 10 owners with income under $50,000 go uninsured, as do 3 in 10 owners whose only asset is their home (Federal Reserve, Economic Well-Being of U.S. Households in 2025, May 2026).
- Among uninsured owners, 16% said insurance is not worth the cost, 15% self-insure and 8% said no insurer will cover their home (Federal Reserve, Economic Well-Being of U.S. Households in 2025, May 2026).
Is insurance getting harder to afford?
- 14% of insured owners struggle to afford the premiums (Federal Reserve, Economic Well-Being of U.S. Households in 2025, May 2026).
- Among insured owners with income under $50,000, 33% want more coverage they cannot afford and nearly 30% struggle with premiums (Federal Reserve, Economic Well-Being of U.S. Households in 2025, May 2026).
- More than 6 in 10 insured owners, at every income level, said the cost rose more than they expected in recent years (Federal Reserve, Economic Well-Being of U.S. Households in 2025, May 2026).
How many owners fall behind and lose a home?
- 40,277 US properties had a foreclosure filing (a default notice, a scheduled auction or a repossession) in August 2026, up 13% from a year earlier (ATTOM, August 2026 U.S. Foreclosure Market Report, Sep 2026).
- Foreclosure starts were 25,894, up 7%, and completed foreclosures were 5,794, up 42% (ATTOM, August 2026 U.S. Foreclosure Market Report, Sep 2026).
- South Carolina had the worst rate, one filing for every 1,547 housing units (ATTOM, August 2026 U.S. Foreclosure Market Report, Sep 2026).
- About 55,000 people had a new foreclosure on their credit report in the second quarter (New York Fed, Household Debt and Credit Report, Aug 2026).
- Lower-income older owners are far likelier to owe nothing: among adults with income under $50,000, 39% of those 60 and older own their home free and clear, against 10% of those under 60 (Federal Reserve, Economic Well-Being of U.S. Households in 2025, May 2026).
Methodology and Sources
We picked each figure from the agency, bank, association or research group that produced it, and we opened every link before using it. Where a source publishes a data file instead of a written finding, we read the numbers from the file. A few counts, such as owner homes by age, come straight from a source table. Surveys measure ownership in different ways, so rates are quoted with the group they cover. The page is refreshed each month as new releases appear. Sources are listed below.
Glossary
- ACS: American Community Survey, a yearly Census Bureau survey of housing and people.
- CPS/HVS: the Current Population Survey and Housing Vacancy Survey, which give the quarterly homeownership rate.
- Consumer unit: the group of people in a home who share expenses, as the Bureau of Labor Statistics counts them.
- Cost burdened: paying more than 30% of income on housing. Severely burdened means more than 50%.
- HELOC: home equity line of credit, a loan secured by the equity in a home.
- Tappable equity: the part of equity an owner could borrow against, as Cotality defines it.
- Free and clear: owning a home with no mortgage or other home loan.
- RECS: Residential Energy Consumption Survey from the Energy Information Administration.
- SHED: Survey of Household Economics and Decisionmaking from the Federal Reserve.
- SCF: Survey of Consumer Finances from the Federal Reserve.
Sources
- Census Bureau, Housing Vacancies and Homeownership, Jul 2026
- Census Bureau, HVS Table 4, Jul 2026
- Census Bureau, Housing Vacancy Survey, Jul 2026
- Census Bureau, Housing Availability and Affordability: 2023, Sep 2025
- Census Bureau, HVS Table 5, Jul 2026
- Census Bureau, Homeowner and Rental Vacancies in the ACS, May 2026
- Census Bureau, HVS Table 7, Jul 2026
- Census Bureau, HVS Table 6, Jul 2026
- BLS, Consumer Expenditure Survey housing tenure table, Dec 2025
- BLS, Consumer Expenditure Survey age table, Dec 2025
- BLS, Consumer Expenditures 2024 release, Dec 2025
- Federal Reserve, 2025 Survey of Consumer Finances, Oct 2026
- Federal Reserve, Financial Accounts Z.1, Sep 2026
- Federal Reserve, Economic Well-Being of U.S. Households in 2025, May 2026
- Federal Reserve Board, Financial Accounts Z.1, retrieved from FRED, Sep 2026
- New York Fed, Household Debt and Credit Report, Aug 2026
- FHFA, House Price Index Q2 2026, Aug 2026
- FHFA, House Price Index July 2026, Sep 2026
- Freddie Mac, Primary Mortgage Market Survey, Oct 2026
- EIA, RECS 2024 Table HC2.2, Mar 2026
- EIA, RECS 2024 Table HC9.2, Mar 2026
- NAR, 2025 Profile of Home Buyers and Sellers, Nov 2025
- NAR, 2025 Profile of Home Buyers and Sellers, Nov 2025
- NAHB Eye on Housing, Almost Half of the Owner-Occupied Homes Built Before 1980, Mar 2026
- NAHB Eye on Housing, Age of Housing Stock by State, Mar 2026
- NAHB Eye on Housing, Single-Family Detached Homes Still Dominate Among the 55+ Population, Sep 2026
- NAHB Eye on Housing, Inadequate Shelter, Dec 2025
- AARP Research, 2024 Home and Community Preferences, Dec 2024
- Cotality, Homeowner Equity Insights Q2 2026, Sep 2026
- ATTOM, August 2026 U.S. Foreclosure Market Report, Sep 2026