Plumbing statistics show a trade that is steady, well paid and hard on the body. People call a plumber when water is already going where it should not, so the work does not wait for a good month. This page gathers the numbers on who plumbers are, what they earn, how they train, how often they get hurt, and what water problems fill their day.
In this page, “plumbers” means the federal job group of plumbers, pipefitters and steamfitters unless a line says otherwise. Many sources fold plumbing in with heating and air conditioning, and the text says so when that happens. Every figure links to the original release and carries its date.
For market size, firms and parts costs, see plumbing industry statistics. For the labor gap across all trades, see skilled trade shortage statistics.
Key Takeaways
- 510,600 plumbers, pipefitters and steamfitters held jobs in 2025 (Bureau of Labor Statistics, Aug 2026).
- 178,663 plumbing, heating and air-conditioning businesses had no employees at all in 2023 (U.S. Census Bureau, May 2025).
- $30.67 an hour was the median wage for plumbers in May 2025 (Bureau of Labor Statistics, Aug 2026).
- 144.5 cases per 10,000 full-time plumbers involved days away from work, against 86.6 for all occupations (Bureau of Labor Statistics, Jan 2026).
- 6.9 deaths per 100,000 full-time workers was the 2024 rate for pipelayers, plumbers, pipefitters and steamfitters, against 3.3 for all workers (Bureau of Labor Statistics, Feb 2026).
- 550,000 is the plumber shortfall one study projects by 2027 (Plumbing Manufacturers International, Aug 2026).
- 2,780 plumbing awards were handed out by US colleges and schools in 2023-24, a small number next to the jobs that open each year (National Center for Education Statistics, Sep 2025).
- 31% lower workers’ compensation claim rates were found for journey-level plumbers who finished an apprenticeship (Illinois EPI for the U.S. Department of Labor, Jan 2025).
- 9,300 gallons of water a year is what the average home’s leaks waste (EPA, Mar 2026).
- $628 million was paid on more than 20,000 State Farm frozen-pipe and winter water claims from 2024 through June 2025 (State Farm, Jan 2026).
- 22.6% of homeowners insurance losses in 2023 came from water damage and freezing (Triple-I, Oct 2026).
- 28% of surveyed homeowners named plumbing as a planned 2026 project, the top system on the list (Housecall Pro, May 2026).
- 87% of plumbing jobs on one field service platform in Q1 2026 were repairs (Housecall Pro, May 2026).
How many plumbers work in the United States?
The answer depends on which survey you ask, because payroll surveys, household surveys and business registers each count different people. Taken together they show a trade of about half a million workers, with a large crowd of one-person shops on the side.
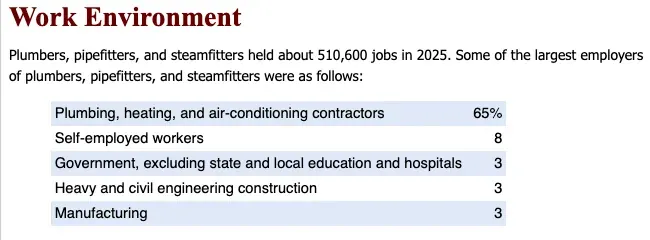 Figure 1: Most plumbers work for plumbing, heating and air-conditioning contractors, which means pricing and dispatch decisions in those shops shape most of the trade. Source: Bureau of Labor Statistics, Occupational Outlook Handbook: Plumbers, Pipefitters, and Steamfitters, Aug 2026. Screenshot of the source page, captured 20 Oct 2026.
How many plumbers are on payroll or working for themselves?
Counts differ by survey, so each line names its method.
- The employer payroll survey counted 465,840 wage and salary plumbers in May 2025 (Bureau of Labor Statistics, May 2026).
- The household survey counted 624,000 employed plumbers in 2025, a count that includes people who work for themselves (Bureau of Labor Statistics, Jun 2026).
- Plumbing, heating and air-conditioning businesses with no paid employees took in $14.0 billion in 2023 (U.S. Census Bureau, May 2025).
- That works out to about $78,400 per business, by our division of the Census totals (U.S. Census Bureau, May 2025).
Who employs plumbers?
Most plumbers work in one industry, with the rest spread across self-employment, government and heavy construction.
- Plumbing, heating and air-conditioning contractors employed 65% of plumbers in 2025 (Bureau of Labor Statistics, Aug 2026).
- Another 8% were self-employed (Bureau of Labor Statistics, Aug 2026).
- Contractors in that industry class had 330,570 plumbers on payroll in May 2025 (Bureau of Labor Statistics, May 2026).
Where do plumbers work?
Plumbers follow population, but a few smaller places lean on the trade much harder than big states do.
- California had 47,660 wage and salary plumbers in May 2025 (Bureau of Labor Statistics, May 2026).
- Texas had 44,090 and Florida had 29,260 (Bureau of Labor Statistics, May 2026).
- Louisiana had the most plumbers for its size, at 4.32 per 1,000 jobs (Bureau of Labor Statistics, May 2026).
- The New York City metro area had the most plumbers of any metro, at 21,040 (Bureau of Labor Statistics, May 2026).
- Kokomo, Indiana had 3.77 times the national share of plumbing jobs (Bureau of Labor Statistics, May 2026).
How much do plumbers earn? Plumber statistics on pay
Plumbers earn more than the typical American worker, but the top and bottom of the range are far apart, and where you live matters more than most people expect. The household survey tells a more modest story than the payroll survey.
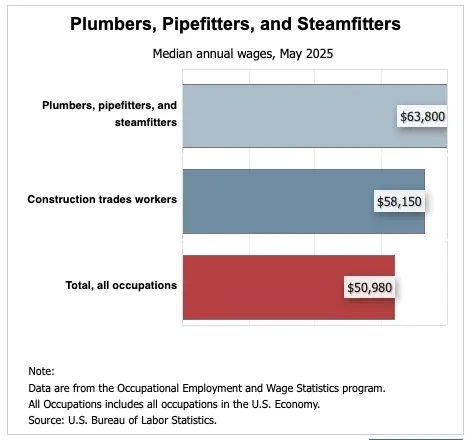 Figure 2: Plumbers sit above both the construction trades and all workers on median pay, which is the base case for any shop setting labor rates. Source: Bureau of Labor Statistics, Occupational Outlook Handbook: Plumbers, Pipefitters, and Steamfitters, Aug 2026. Chart published by the source, captured 20 Oct 2026.
How wide is the pay range?
The spread from the bottom tenth to the top tenth is more than double.
- The mean annual wage was $72,170 in May 2025 (Bureau of Labor Statistics, May 2026).
- The lowest-paid 10% earned less than $44,150 (Bureau of Labor Statistics, Aug 2026).
- The highest-paid 10% earned more than $108,420 (Bureau of Labor Statistics, Aug 2026).
Which employers pay plumbers the most?
Government and utilities pay better than the contractors who employ most plumbers.
- Plumbers in government earned a median $71,660 in May 2025 (Bureau of Labor Statistics, Aug 2026).
- Plumbers at utilities earned a median $90,750 (Bureau of Labor Statistics, May 2026).
- Plumbers at plumbing, heating and air-conditioning contractors earned a median $63,010 (Bureau of Labor Statistics, Aug 2026).
How much does pay change by place?
State and metro medians run from under $50,000 to above $100,000.
- Illinois had a median of $99,950 in May 2025 (Bureau of Labor Statistics, May 2026).
- Oregon had a median of $97,050 (Bureau of Labor Statistics, May 2026).
- Arkansas had a median of $48,660 (Bureau of Labor Statistics, May 2026).
- The San Jose metro area had the highest metro median among large metros, $107,560 (Bureau of Labor Statistics, May 2026).
What does the household survey say about weekly pay?
The household survey asks workers what they earn, so it will not match the employer survey. Too few women work full time as plumbers for the survey to report their pay.
- Full-time male plumbers had median weekly earnings of $1,209 in 2025 (Bureau of Labor Statistics, Jun 2026).
- All full-time men had median weekly earnings of $1,326 (Bureau of Labor Statistics, Jun 2026).
What is the job outlook for plumbers?
Demand should grow faster than the average job, and nearly every source that looks at supply says there will not be enough people to meet it. That gap is where shop owners with good systems win work.
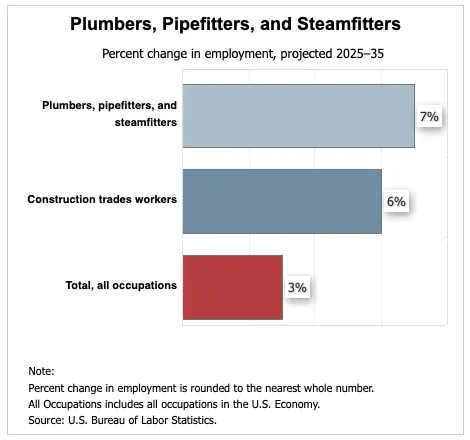 Figure 3: Federal projections put plumber job growth ahead of both the construction trades and the all-job average, which supports steady hiring through 2035. Source: Bureau of Labor Statistics, Occupational Outlook Handbook: Plumbers, Pipefitters, and Steamfitters, Aug 2026. Chart published by the source, captured 20 Oct 2026.
What do federal projections say?
The Bureau of Labor Statistics projects jobs, not revenue.
- Plumber employment is projected to reach 545,200 by 2035 (Bureau of Labor Statistics, Aug 2026).
- That is 34,500 more jobs than in 2025 (Bureau of Labor Statistics, Aug 2026).
Is there a plumber shortage?
One industry-funded study says yes, and that it is large. Treat it as a projection from a commissioned study, not a count.
- The study projects about 550,000 unfilled plumbing positions by 2027 (Plumbing Manufacturers International, Aug 2026).
- The authors say adding only 16,400 plumbers would cut plumbing costs by nearly $1.27 billion a year (Plumbing Manufacturers International, Aug 2026).
- They add that the same 16,400 plumbers would save $144.5 million on upkeep of plumbing infrastructure (Plumbing Manufacturers International, Aug 2026).
- About 90% of plumbing-related spending goes to new construction, which pulls limited labor away from routine repair (Plumbing Manufacturers International, Aug 2026).
Are shop owners seeing the demand?
Surveys of service business owners point the same way.
- Plumbing was one of the trades with the sharpest growth in demand in the past year (Jobber, Feb 2026).
- Plumbing was one of three trades reporting higher demand for skilled workers and supervisors (Jobber, Feb 2026).
Who becomes a plumber, and how do they train?
The trade is learned on the job, and the school route is small. The path is long, which is part of why the workforce does not grow as fast as demand.
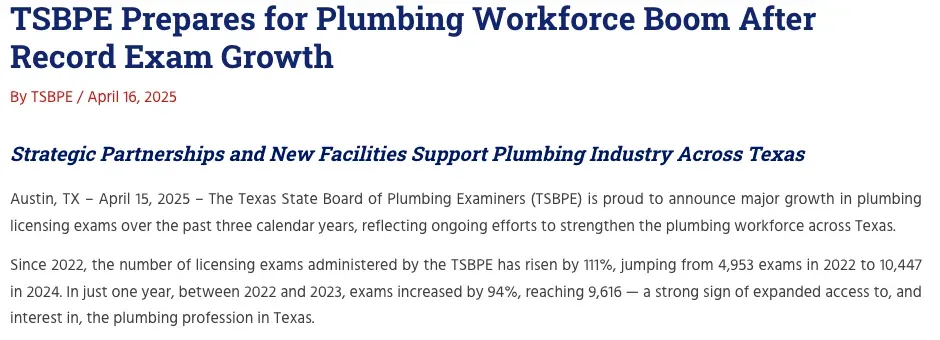 Figure 4: Texas is a useful test case for the pipeline, because its licensing board reports exams given each year and shows the pool of people trying to enter the trade. Source: Texas State Board of Plumbing Examiners, TSBPE Prepares for Plumbing Workforce Boom After Record Exam Growth, Apr 2025. Screenshot of the source page, captured 20 Oct 2026.
Who is in the trade today?
The trade is overwhelmingly male and mostly White, and the younger and older ends are both thin.
- Women were 3.1% of employed plumbers in 2025 (Bureau of Labor Statistics, Jun 2026).
- Black or African American workers were 7.1% of employed plumbers (Bureau of Labor Statistics, Jun 2026).
- Asian workers were 2.8% (Bureau of Labor Statistics, Jun 2026).
- Workers under 25 made up 13.6% of employed plumbers, by our sum of the two youngest age groups (Bureau of Labor Statistics, Jun 2026).
- Workers 55 and older made up 18.4%, by our sum of the two oldest age groups (Bureau of Labor Statistics, Jun 2026).
How long does it take to train?
Most plumbers learn through a multi-year paid apprenticeship.
- Most apprenticeships last 4 or 5 years (Bureau of Labor Statistics, Aug 2026).
- Apprentices typically get 2,000 hours of paid on-the-job training each year (Bureau of Labor Statistics, Aug 2026).
- States and localities often require 2 to 5 years of experience plus an exam before a plumber can work alone (Bureau of Labor Statistics, Aug 2026).
- Washington requires 8,000 hours as a trainee under a journey-level plumber (U.S. Department of Labor, Jan 2024).
- Plumbers and pipefitters are among the construction trades with the most registered apprentices (Illinois EPI for the U.S. Department of Labor, Jan 2025).
How many people finish plumbing programs at school?
Schools produce a small stream next to the many openings the government expects each year, so most new plumbers come through employers and unions.
- Institutions reported 1,479 certificates of at least one but under two years in plumbing technology for 2023-24 (National Center for Education Statistics, Sep 2025).
- They reported 1,094 certificates of 12 weeks to under a year (National Center for Education Statistics, Sep 2025).
- They reported 116 associate’s degrees (National Center for Education Statistics, Sep 2025).
- 138 institutions awarded at least one plumbing credential, by our count of the file (National Center for Education Statistics, Sep 2025).
- Women earned 182 of the awards, or 6.5% (National Center for Education Statistics, Sep 2025).
- Hispanic or Latino students earned 843, or 30.3% (National Center for Education Statistics, Sep 2025).
How many plumbers go through an apprenticeship?
A Washington State study shows many licensed plumbers never did.
- 4,086 Washington plumbers earned a first journey-level certificate between 2000 and 2018 (U.S. Department of Labor, Jan 2024).
- Of the 3,327 in the study sample, 768 had finished an apprenticeship, 357 had some training and 2,202 had none (U.S. Department of Labor, Jan 2024).
- Plumbers who finished an apprenticeship were 32 when first certified, against 38 for those with no training (U.S. Department of Labor, Jan 2024).
Is interest in licensing growing?
Texas says yes.
- Texas licensing exams rose from 4,953 in 2022 to 10,447 in 2024, up 111% (Texas State Board of Plumbing Examiners, Apr 2025).
- Exams reached 9,616 in 2023 (Texas State Board of Plumbing Examiners, Apr 2025).
- Plumbing programs built with the Texas Education Agency run at 60 high schools and seven trade schools (Texas State Board of Plumbing Examiners, Apr 2025).
How dangerous is plumbing work?
Plumbers get hurt more often than the average worker, and the injuries are mostly the kind you expect from heavy lifting, tight spaces and sharp tools. The good news is that training seems to help.
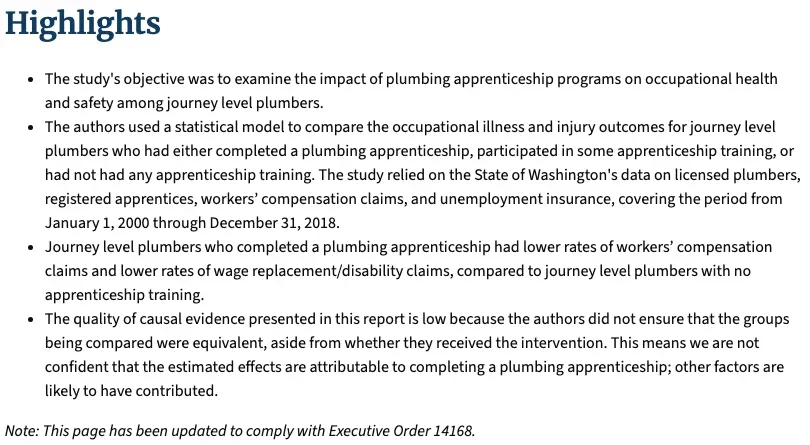 Figure 5: The review summarizes a study of Washington plumbers that links finishing an apprenticeship to fewer injury claims, though the Department of Labor rates the causal evidence as low. Source: U.S. Department of Labor, Clearinghouse for Labor Evaluation and Research, Jan 2024. Screenshot of the source page, captured 20 Oct 2026.
How often are plumbers hurt?
The injury tables average 2023 and 2024 for private industry.
- Plumbers had 11,090 cases a year with days away from work (Bureau of Labor Statistics, Jan 2026).
- The median injured plumber missed 9 days, against 8 for all occupations (Bureau of Labor Statistics, Jan 2026).
What injuries do plumbers get?
Sprains, cuts and hand injuries lead.
- Sprains, strains and tears hit plumbers at 43.5 cases per 10,000 workers, against 26.8 for all occupations (Bureau of Labor Statistics, Jan 2026).
- Cuts and punctures hit plumbers at 22.4 per 10,000, against 8.5 for all occupations (Bureau of Labor Statistics, Jan 2026).
- The hand was the body part injured in 2,280 cases (Bureau of Labor Statistics, Jan 2026).
What events cause the injuries?
Lifting, tools and falls account for most cases.
- Overexertion caused 3,010 cases (Bureau of Labor Statistics, Jan 2026).
- Contact with non-running objects or equipment caused 2,500 (Bureau of Labor Statistics, Jan 2026).
- Falls to a lower level caused 1,000 (Bureau of Labor Statistics, Jan 2026).
How many plumbers die at work?
Deaths are rarer than injuries but well above the all-worker rate.
- 36 plumbers, pipefitters and steamfitters died from work injuries in 2024 (Bureau of Labor Statistics, Feb 2026).
What does the daily job ask of the body?
O*NET asks working plumbers how often they face each condition. Its work context data come from a 2022 survey of workers.
- 91% wear common protective gear every day (O*NET OnLine, Aug 2026).
- 56% are exposed to contaminants such as gases, dust or odors every day (O*NET OnLine, Aug 2026).
- 46% are exposed to hazardous equipment every day (O*NET OnLine, Aug 2026).
- 43% climb ladders, scaffolds or poles continually or almost continually (O*NET OnLine, Aug 2026).
- 33% face minor burns, cuts, bites or stings every day (O*NET OnLine, Aug 2026).
- 32% bend or twist their bodies continually or almost continually (O*NET OnLine, Aug 2026).
- 29% are exposed to hazardous conditions every day (O*NET OnLine, Aug 2026).
- 25% are exposed to high places every day (O*NET OnLine, Aug 2026).
Does apprenticeship make plumbers safer?
The evidence points that way, with a warning about cause.
- Journey-level plumbers who finished an apprenticeship had lower rates of workers’ compensation claims than those with none (U.S. Department of Labor, Jan 2024).
What water problems keep plumbers busy?
Water finds the weak spot in a home, and the weak spot is usually a worn part nobody has looked at in years. Small leaks add up to billions of gallons, and one freeze can cost a household tens of thousands of dollars.
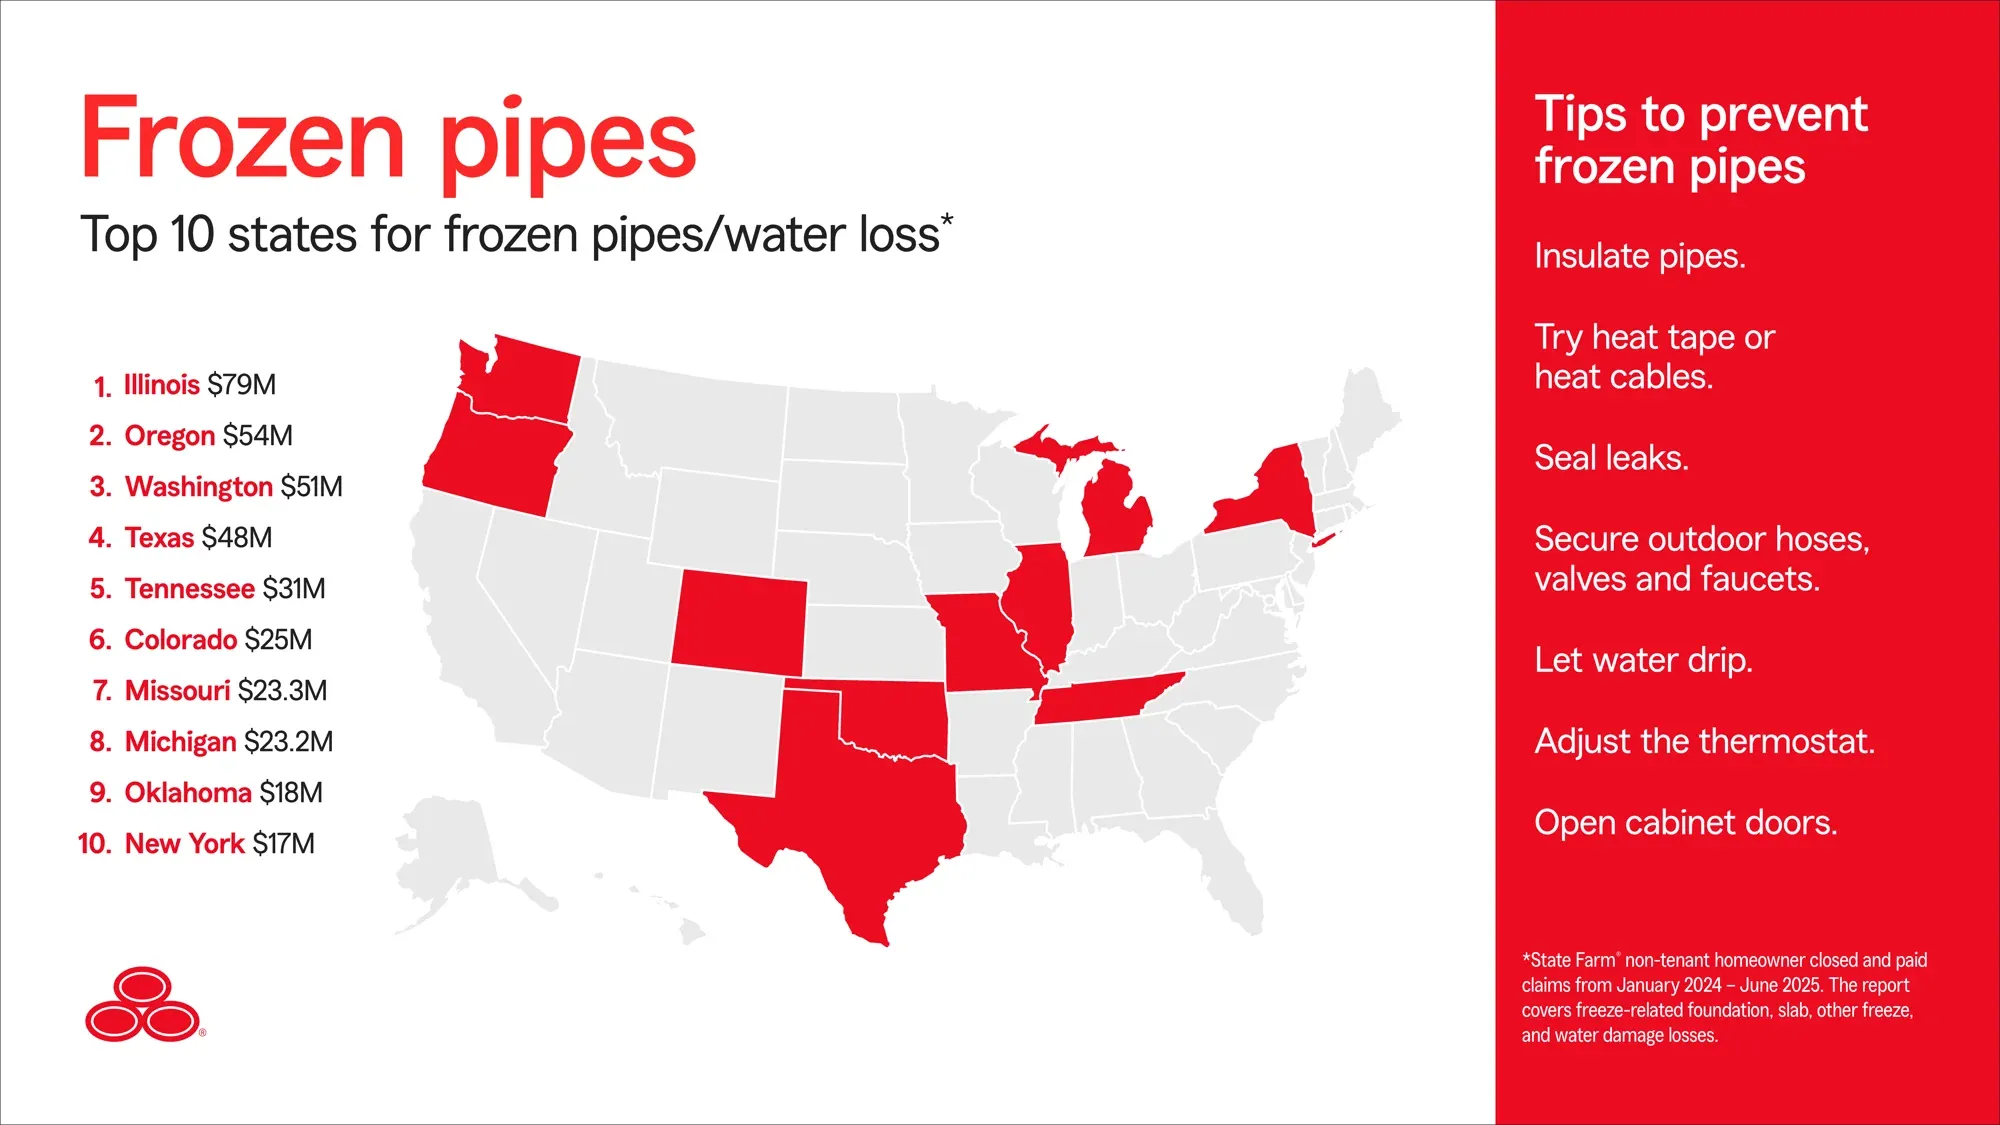 Figure 6: State Farm’s own ranking shows frozen-pipe losses are not only a northern problem, with Texas and Tennessee among the top five states by dollars paid. Source: State Farm, Frozen Pipes? Not So Nice! Beat Winter Water Woes Before They Strike, Jan 2026. Chart published by the source, captured 20 Oct 2026.
How much water do household leaks waste?
Most household leaks come from cheap, worn parts.
- Nine percent of homes have leaks that waste 50 gallons or more per day (EPA, Mar 2026).
- Household leaks waste nearly 1 trillion gallons a year nationwide, enough for more than 11 million homes (EPA, Mar 2026).
- Fixing easy leaks can cut a water bill by about 10% (EPA, Mar 2026).
- A toilet flapper should be replaced at least every five years, because a worn one can silently leak thousands of gallons a year (EPA, Mar 2026).
- A faucet dripping once a second wastes more than 3,000 gallons a year (EPA, Mar 2026).
- A showerhead leaking 10 drips a minute wastes more than 500 gallons a year (EPA, Mar 2026).
- A 1/32-inch leak in an irrigation system can waste about 6,300 gallons a month (EPA, Mar 2026).
What do frozen pipes cost?
One break can flood a whole floor.
- The average State Farm payment on a frozen-pipe or winter water claim exceeded $30,000 (State Farm, Jan 2026).
- A small crack in a pipe can release over 250 gallons of water a day (State Farm, Jan 2026).
- Pipes in uninsulated attics, crawl spaces and exterior walls are most at risk when temperatures fall below 20 degrees Fahrenheit (State Farm, Jan 2026).
- Illinois led all states in paid frozen-pipe losses at $79 million (State Farm, Jan 2026).
- Oregon followed at $54 million and Washington at $51 million (State Farm, Jan 2026).
- Texas paid $48 million and Tennessee paid $31 million (State Farm, Jan 2026).
How common is water damage in insurance claims?
Water damage is a steady source of insured losses.
- Water damage and freezing claims averaged $15,400 per claim from 2019 to 2023 (Triple-I, Oct 2026).
- About one in 60 insured homes has a water damage or freezing claim (Triple-I, Oct 2026).
- From 2018 to 2022, 1.6% of insured homes had a water damage or freezing loss, against 2.8% for wind and hail (Triple-I, Oct 2026).
How much plumbing work are homeowners planning?
Homeowners are staying put in older houses, and plumbing is the repair they plan most. Their budgets are tight, though, so they compare quotes and expect a fast answer when a pipe fails.
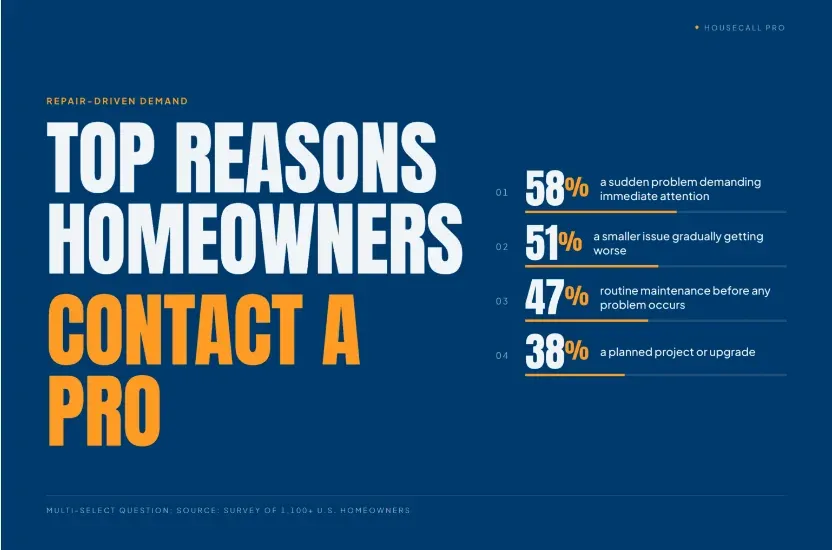 Figure 7: Most calls start with something that is already broken or getting worse, which is why speed and a clear price decide who gets the job. Source: Housecall Pro, 2026 home spending report key findings, May 2026. Chart published by the source, captured 20 Oct 2026.
What repairs are homeowners planning?
These are survey answers from more than 1,100 US homeowners, plus platform data.
- 79% of homeowners expect to repair or replace at least one home system in 2026 (Housecall Pro, May 2026).
- 72% plan to stay in their current home for the foreseeable future (Housecall Pro, May 2026).
- 69% live in homes more than 20 years old (Housecall Pro, May 2026).
What makes a homeowner call a plumber?
Trouble comes first and planning comes last.
- 58% contacted a pro after a sudden problem or system failure (Housecall Pro, May 2026).
- 51% waited until a smaller issue got worse (Housecall Pro, May 2026).
- 47% called for routine maintenance before any problem occurred (Housecall Pro, May 2026).
- 38% called for a planned project or upgrade (Housecall Pro, May 2026).
- 41% had postponed a repair that later became more expensive to fix (Housecall Pro, May 2026).
What do homeowners expect from a quote?
Price and speed decide jobs, so the quote is where a shop wins or loses.
- 68% seek additional quotes when pricing comes in higher than expected (Housecall Pro, May 2026).
- 72% would pay more to resolve an emergency within 24 hours (Housecall Pro, May 2026).
- 62% are more likely to go ahead when financing is offered (Housecall Pro, May 2026).
- 57% would hire a pro instead of repairing it themselves when a project costs $500 or more (Housecall Pro, May 2026).
- 77% are delaying or shrinking home projects because of rising costs (Housecall Pro, May 2026).
How do plumbing shops run day to day?
Plumbers talk to customers all day, and the schedule changes with each call.
- 65% of plumbing businesses use AI tools (Jobber, Feb 2026).
- More than 45% of plumbing businesses say they close 70% or more of their quotes (Jobber, Feb 2026).
- 14% of plumbing businesses are turning work away (Jobber, Feb 2026).
- 45% of plumbers talk on the phone every day (O*NET OnLine, Aug 2026).
- 79% have face-to-face discussions every day (O*NET OnLine, Aug 2026).
- 39% say their work schedule is irregular, changing with weather or demand (O*NET OnLine, Aug 2026).
- 27% work more than 40 hours in a typical week (O*NET OnLine, Aug 2026).
Glossary
- BLS: Bureau of Labor Statistics, the federal agency that publishes the jobs, pay and injury tables used here.
- CFOI: Census of Fatal Occupational Injuries, the BLS count of work deaths.
- CIP: Classification of Instructional Programs, the code system schools use to report what they teach. Plumbing is 46.0503.
- CLEAR: Clearinghouse for Labor Evaluation and Research, a Department of Labor reviewer of studies.
- CPS: Current Population Survey, the monthly household survey behind the employment, age and weekly earnings tables.
- DAFW: days away from work, the injury case type used for the rates above.
- IPEDS: Integrated Postsecondary Education Data System, the federal database of college completions.
- Nonemployer business: a business with no paid employees, usually a sole proprietor.
- O*NET: the Department of Labor’s database of what workers in each job do.
- OEWS: Occupational Employment and Wage Statistics, the BLS payroll-based pay survey.
- OOH: Occupational Outlook Handbook, the BLS career guide.
- SOII: Survey of Occupational Injuries and Illnesses, the BLS count of nonfatal work injuries.
Methodology and Sources
Each number comes from the agency, board, company or research group that produced it, and each links to the original release. Federal tables are read from the agency’s own data files, and rates and counts that we add up or divide ourselves are marked as ours. Where a live page has no printed date, as with the Triple-I claims tables, the month shown is the month we checked it. The O*NET work context figures come from a 2022 worker survey carried in the August 2026 database. Industry surveys from Housecall Pro and Jobber are first-party research from software makers and reflect their own samples. The page is reviewed each month, and the source list below is the pickup point for the next update.
Sources
- Bureau of Labor Statistics
- Bureau of Labor Statistics
- Bureau of Labor Statistics
- Bureau of Labor Statistics
- Bureau of Labor Statistics
- Bureau of Labor Statistics
- Bureau of Labor Statistics
- Bureau of Labor Statistics
- Bureau of Labor Statistics
- Bureau of Labor Statistics
- Bureau of Labor Statistics
- Bureau of Labor Statistics
- Bureau of Labor Statistics
- Bureau of Labor Statistics
- Bureau of Labor Statistics
- EPA
- Housecall Pro
- Housecall Pro
- Illinois EPI for the U.S. Department of Labor
- Jobber
- National Center for Education Statistics
- O*NET OnLine
- Plumbing Manufacturers International
- State Farm
- Texas State Board of Plumbing Examiners
- Triple-I
- U.S. Census Bureau
- U.S. Department of Labor