Home services industry statistics are hard to pin down because no agency counts the whole market. The government counts firms, workers and pay by trade. Platforms and survey firms count projects and dollars. This page keeps each number tied to the group that produced it, with the date and a link, so you can see what each figure does and does not cover.
The picture for 2026 is a large market that is still growing but slowing. Owners are spending on repairs and upkeep before big remodels. Customers want fast answers, clear prices and online booking. The lead platforms that once fed small shops are shrinking, and referrals still carry most shops.
We update this page every month. Every number below comes from the primary source named next to it, and we dropped any figure we could not trace back to its origin.
Key Takeaways
- Angi sized the US home services market at $657 billion in 2022, growing at twice the pace of the economy (Angi, Jul 2022).
- Homeowner spending on improvements and repairs reached $517 billion in the year to mid-2026 (Harvard JCHS, Jul 2026).
- There are 252,426 private establishments that service buildings and dwellings (BLS QCEW, Aug 2026).
- 1.9 million businesses with no employees serve buildings and dwellings (Census Bureau, Sep 2026).
- 80% of homeowners say online booking influences who they hire (Housecall Pro, Dec 2025).
- 59% of home service owners name referrals as a top source of leads (Jobber, Feb 2026).
- 71% of homeowners postponed a planned home project in 2025 (Angi, May 2025).
- Angi’s network service requests fell 58% in 2025 after it let homeowners choose their own pros (Angi Inc. 10-K, Feb 2026).
- 22% of US adults had an unexpected major house or appliance repair expense in the past year (Federal Reserve, May 2026).
- 91% of renovating homeowners hire professionals (Houzz, Apr 2026).
- 45% of consumers now use AI tools for local business recommendations, up from 6% a year earlier (BrightLocal, Feb 2026).
- Yelp’s ad revenue from services businesses hit a record $948 million in 2025 (Yelp 10-K, Feb 2026).
How big is the home service industry?
The honest answer is a range, and the newest full market model is four years old. Treat any single dollar figure as one firm’s estimate, not a census.
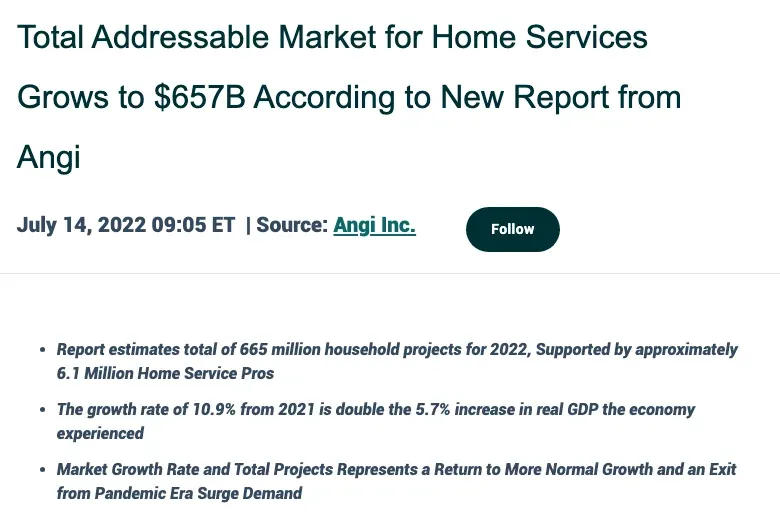 Figure 1: Angi’s own release sized the market at $657 billion and 665 million projects in 2022, and said growth had slowed from the pandemic surge but still ran at twice the rate of the economy. Source: Angi, Total Addressable Market for Home Services Grows to $657B, Jul 2022. Screenshot of the release as distributed on GlobeNewswire, captured 20 Oct 2026.
What are the parts of the market?
The market splits into improvement, upkeep and emergency repair, and each part behaves differently.
- Home improvement was $475 billion across 152.5 million projects (Angi, Jul 2022).
- Home maintenance was $105.9 billion across 419.7 million projects (Angi, Jul 2022).
- Emergency repair was $76.4 billion across 93.5 million projects (Angi, Jul 2022).
- In total, households completed 665.6 million projects in 2022 (Angi, Jul 2022).
How much did the market grow before that?
The 2021 edition of the same report put the market at $595 billion (Angi, Jun 2021). The 2022 edition said the market had grown by $62 billion in a year (Angi, Jul 2022).
- Angi counted 5.8 million skilled tradespeople in home services in 2021 (Angi, Jun 2021).
- Thumbtack described a $500 billion home services industry in its own 2021 release, which shows how far estimates can differ (Thumbtack, Dec 2021).
What do the newest spending numbers say?
Improvement and repair spending on owner-occupied homes is the best current check on the market, and it is flat, not falling.
- Spending is projected at $519 billion by the second quarter of 2027 (Harvard JCHS, Jul 2026).
- Year-over-year growth bottomed at -2.5% in the third quarter of 2024 (Harvard JCHS, Jul 2026).
- Total home project spending per homeowner fell 12% in 2024 (Angi, Jan 2025).
- 54% of US homeowners on Houzz did a renovation project in 2025 (Houzz, Apr 2026).
What drives the demand underneath?
Old, aging houses and older owners create steady work whatever the economy does.
- The US had 143 million housing units, and the average one was 47 years old (Angi, Jul 2022).
- Households headed by someone 65 or older are projected to grow 26% between 2025 and 2045, to 49.7 million (Harvard JCHS, Jun 2026).
- Households headed by someone 80 or older are projected to double from 9.6 million to 19.2 million over the same period (Harvard JCHS, Jun 2026).
How much does a household spend on home services?
Housing is the biggest line in the household budget, and what owners add on top for pros depends heavily on age and income.
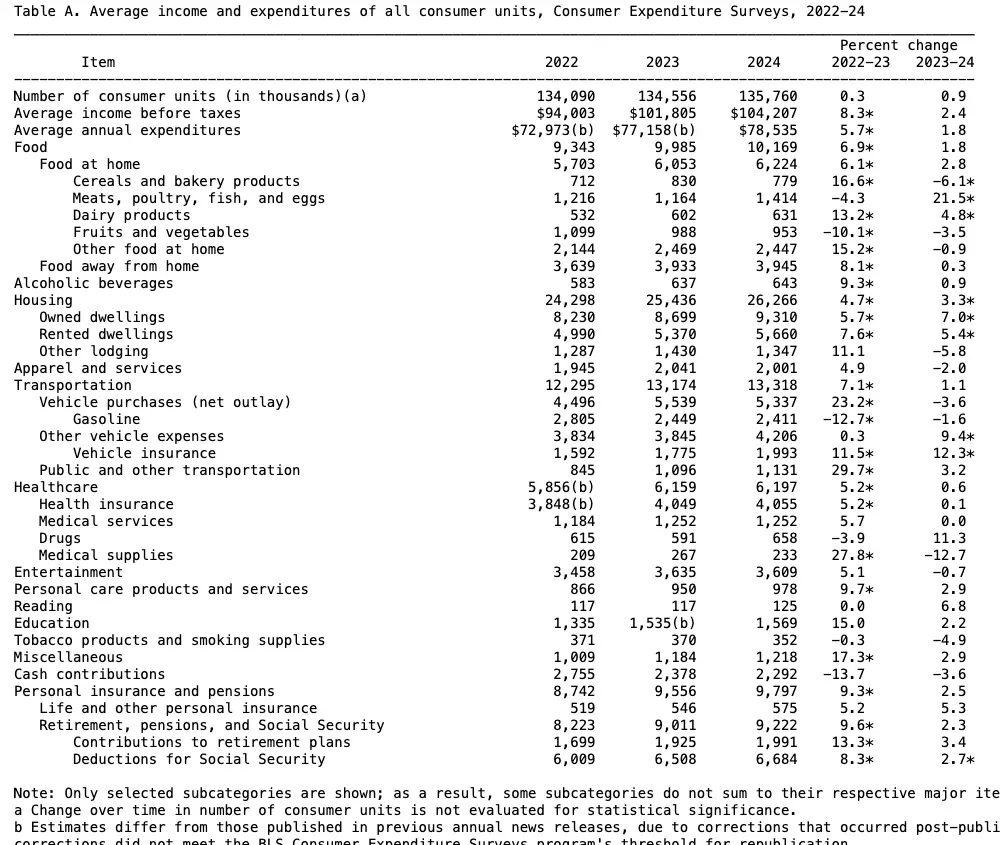 Figure 2: Housing was the only major spending category with a statistically significant rise in 2024, and the owned-dwelling line grew fastest. Source: BLS, Consumer Expenditures 2024, Dec 2025. Screenshot of the source table, captured 20 Oct 2026.
What does the average household spend overall?
Government survey data sets the frame for everything a household pays for its home.
- The average US household spent $78,535 in 2024 (BLS Consumer Expenditure Survey, Dec 2025).
- Housing took $26,266 of that, or 33.4% (BLS Consumer Expenditure Survey, Dec 2025).
- Spending on owned dwellings alone rose 7.0% in 2024 to $9,310 (BLS Consumer Expenditure Survey, Dec 2025).
How much do homeowners spend on projects by age and income?
Boomers spend the most on improvements, while younger owners spend more on upkeep and emergencies.
- Boomers spent an average of $14,140 on home projects in 2024, of which $12,093 went to improvements (Angi, Jan 2025).
- Millennials spent $2,316 on maintenance, $1,000 more than any other generation (Angi, Jan 2025).
- Households earning over $150,000 spent $21,958, up from $20,649 in 2023 (Angi, Jan 2025).
- Gen Z spent $1,387 on emergency projects, while Millennials spent $1,329, more than twice what older generations spent (Angi, Jan 2025).
- Gen Z homeowners averaged 10 projects each in 2024, and Millennials averaged 9.3 (Angi, Jan 2025).
What is a typical renovation budget?
Half of renovating homeowners spend more than the median, and the top tenth spend far more.
- The median renovation spend held at $20,000 in 2025 (Houzz, Apr 2026).
- The top 10% of projects reached $150,000 or more, up from $140,000 a year earlier (Houzz, Apr 2026).
- Seniors had the highest median at $25,000, followed by Gen X at $24,000 and Baby Boomers at $22,000 (Houzz, Apr 2026).
- Gen Z homeowners had a median of $8,500, against $15,000 for Millennials (Houzz, Apr 2026).
How do owners pay, and do budgets hold?
Savings pay for most work, and budgets often slip.
- 84% of renovating homeowners used savings, and 34% used credit cards, up 5 points in a year (Houzz, Apr 2026).
- 37% of renovators went over their budget, and 52% of them blamed costlier products or services than expected (Houzz, Apr 2026).
- 63% of adults said they could cover a $400 emergency expense with cash or its equivalent, down from a high of 68% in 2021 (Federal Reserve, May 2026).
- Over half of homeowners met surprise expenses on projects in 2024, mostly for materials and labor (Angi, Jan 2025).
Which home services are in demand?
Demand is real but uneven: heating, cooling and plumbing shops saw the sharpest growth, while cleaning and lawn care stayed steadier.
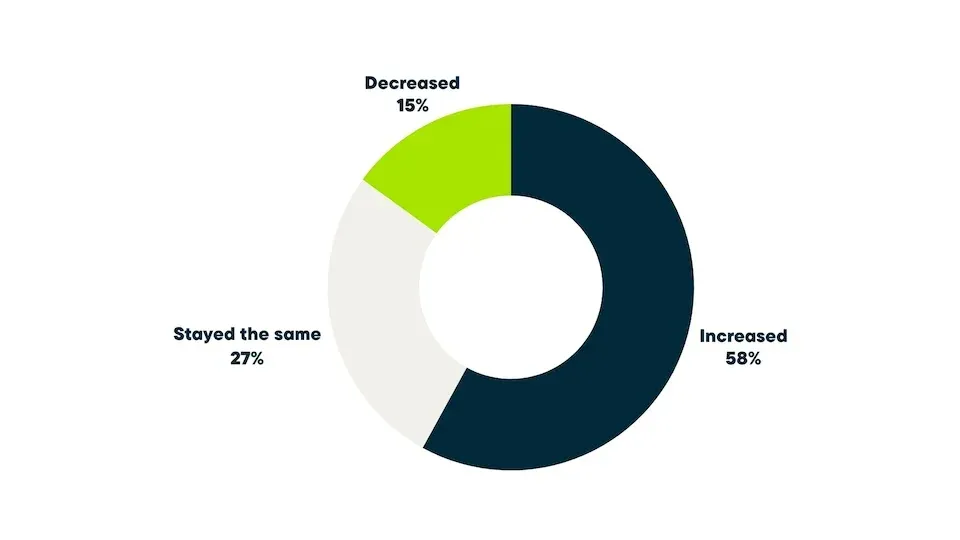 Figure 3: More than half of surveyed home service owners saw demand rise in the past year, and only 15% saw it fall. Source: Jobber, 2026 Home Service Trends Report, Feb 2026. Chart published by the source, captured 20 Oct 2026.
Are shops busy?
Most shops are close to full, so the limit is crew time, not leads.
- 80% of service businesses said they were fully booked or close to it, and only 3% had trouble filling their schedule (Jobber, Feb 2026).
- HVAC, plumbing and tree care saw the sharpest demand growth (Jobber, Feb 2026).
- 75% of owners under 30 reported higher demand (Jobber, Feb 2026).
- 51% of businesses said their average job size grew, and 28% of HVAC pros saw major gains (Jobber, Feb 2026).
- Only 12% of cleaning and 16% of lawn care businesses saw major job size gains (Jobber, Feb 2026).
Which trades do renovating homeowners hire?
Specialty trades are hired more often than general contractors.
- Electricians were hired by 41% of renovating homeowners (Houzz, Apr 2026).
- Heating and cooling specialists were hired by 40% (Houzz, Apr 2026).
- Plumbers were hired by 36% (Houzz, Apr 2026).
- General contractors were hired by 29%, and design-build firms by 5% (Houzz, Apr 2026).
What projects are owners planning or putting off?
Cosmetic projects get delayed first, and kitchens top the wish list.
- 22% of homeowners planned interior painting for 2025, and 13% each planned bathroom remodels and flooring (Angi, Jan 2025).
- 12% planned landscaping projects for 2025 (Angi, Jan 2025).
- Bathroom remodels were the most postponed project at 12%, ahead of interior painting at 10% and window replacement at 10% (Angi, May 2025).
- 31% of homeowners hoped to remodel a kitchen, and 22% hoped to redo a bathroom (Angi, May 2025).
How have prices moved for some services?
Prices for yard work jumped while prices for moving fell.
- Gardening and lawncare services rose 8.8% in the year to September 2026 (BLS Consumer Price Index, Sep 2026).
- Moving, storage and freight costs fell 7.1% over the same year (BLS Consumer Price Index, Sep 2026).
- All items rose 3.7% over the same year (BLS Consumer Price Index, Sep 2026).
How many home service businesses and workers are there?
The industry is mostly small: hundreds of thousands of employer shops, and many more owners working alone.
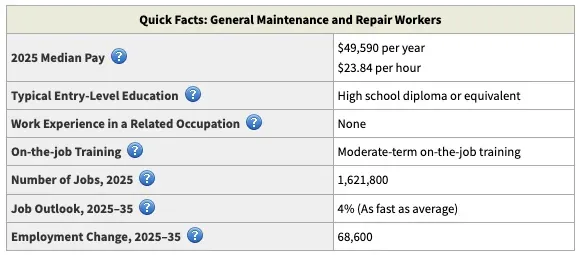 Figure 4: General maintenance and repair work is one of the largest home service occupations, with steady growth ahead. Source: BLS, Occupational Outlook Handbook, General Maintenance and Repair Workers, Aug 2026. Screenshot of the source page, captured 20 Oct 2026.
How many employer businesses are in the trades that serve homes?
Government payroll records count establishments, workers and average pay for each group of trades. These groups include some commercial work.
- Building equipment contractors, which cover electrical, plumbing and heating and cooling work, had 236,924 establishments and 2,601,097 workers, with average pay of $85,692 (BLS QCEW, Aug 2026).
- Building finishing contractors, such as painting, flooring and drywall, had 136,071 establishments and 824,931 workers (BLS QCEW, Aug 2026).
- Foundation and exterior contractors, such as roofing and siding, had 118,815 establishments and 971,441 workers (BLS QCEW, Aug 2026).
- Services to buildings and dwellings employed 2,290,965 people at an average of $44,319 (BLS QCEW, Aug 2026).
- Janitorial services had 83,041 establishments and 1,069,828 workers, at average pay of $34,443 (BLS QCEW, Aug 2026).
- Pest control had 17,701 establishments and 155,687 workers, at average pay of $59,312 (BLS QCEW, Aug 2026).
- Appliance repair had 6,354 establishments and 24,056 workers (BLS QCEW, Aug 2026).
How many owners work alone?
Businesses with no employees outnumber employer establishments in every group below.
- Building equipment contractors had 385,453 businesses with no employees and $26.7 billion in receipts (Census Bureau, Sep 2026).
- Building finishing trades had 678,091 such businesses with $45.3 billion in receipts (Census Bureau, Sep 2026).
- Services to buildings and dwellings brought in $53.5 billion across those businesses (Census Bureau, Sep 2026).
- Of those, 1,173,265 were janitorial and 16,996 were pest control (Census Bureau, Sep 2026).
- Across all industries, the US had 31,985,874 businesses with no employees and $1.86 trillion in receipts (Census Bureau, Sep 2026).
- Angi counted more than 6 million home service pros working for about 2.5 million businesses (Angi, Jul 2022).
What do the occupations look like?
Handyman-style and cleaning work employ the most people, and pay is modest outside the licensed trades.
- General maintenance and repair workers held 1,621,800 jobs, with median pay of $49,590 in 2025 (BLS Occupational Outlook Handbook, Aug 2026).
- Employment of those workers is projected to grow 4% from 2025 to 2035, with about 148,700 openings a year (BLS Occupational Outlook Handbook, Aug 2026).
- Janitors and building cleaners held 2,432,600 jobs, with median pay of $36,840 and 2% projected growth (BLS Occupational Outlook Handbook, Aug 2026).
- Pest control workers held 108,700 jobs, with median pay of $45,250 and 6% projected growth (BLS Occupational Outlook Handbook, Sep 2026).
How do homeowners find and book home service pros?
Word of mouth still wins, but the first contact is now digital, and speed and a clear price decide who gets the call.
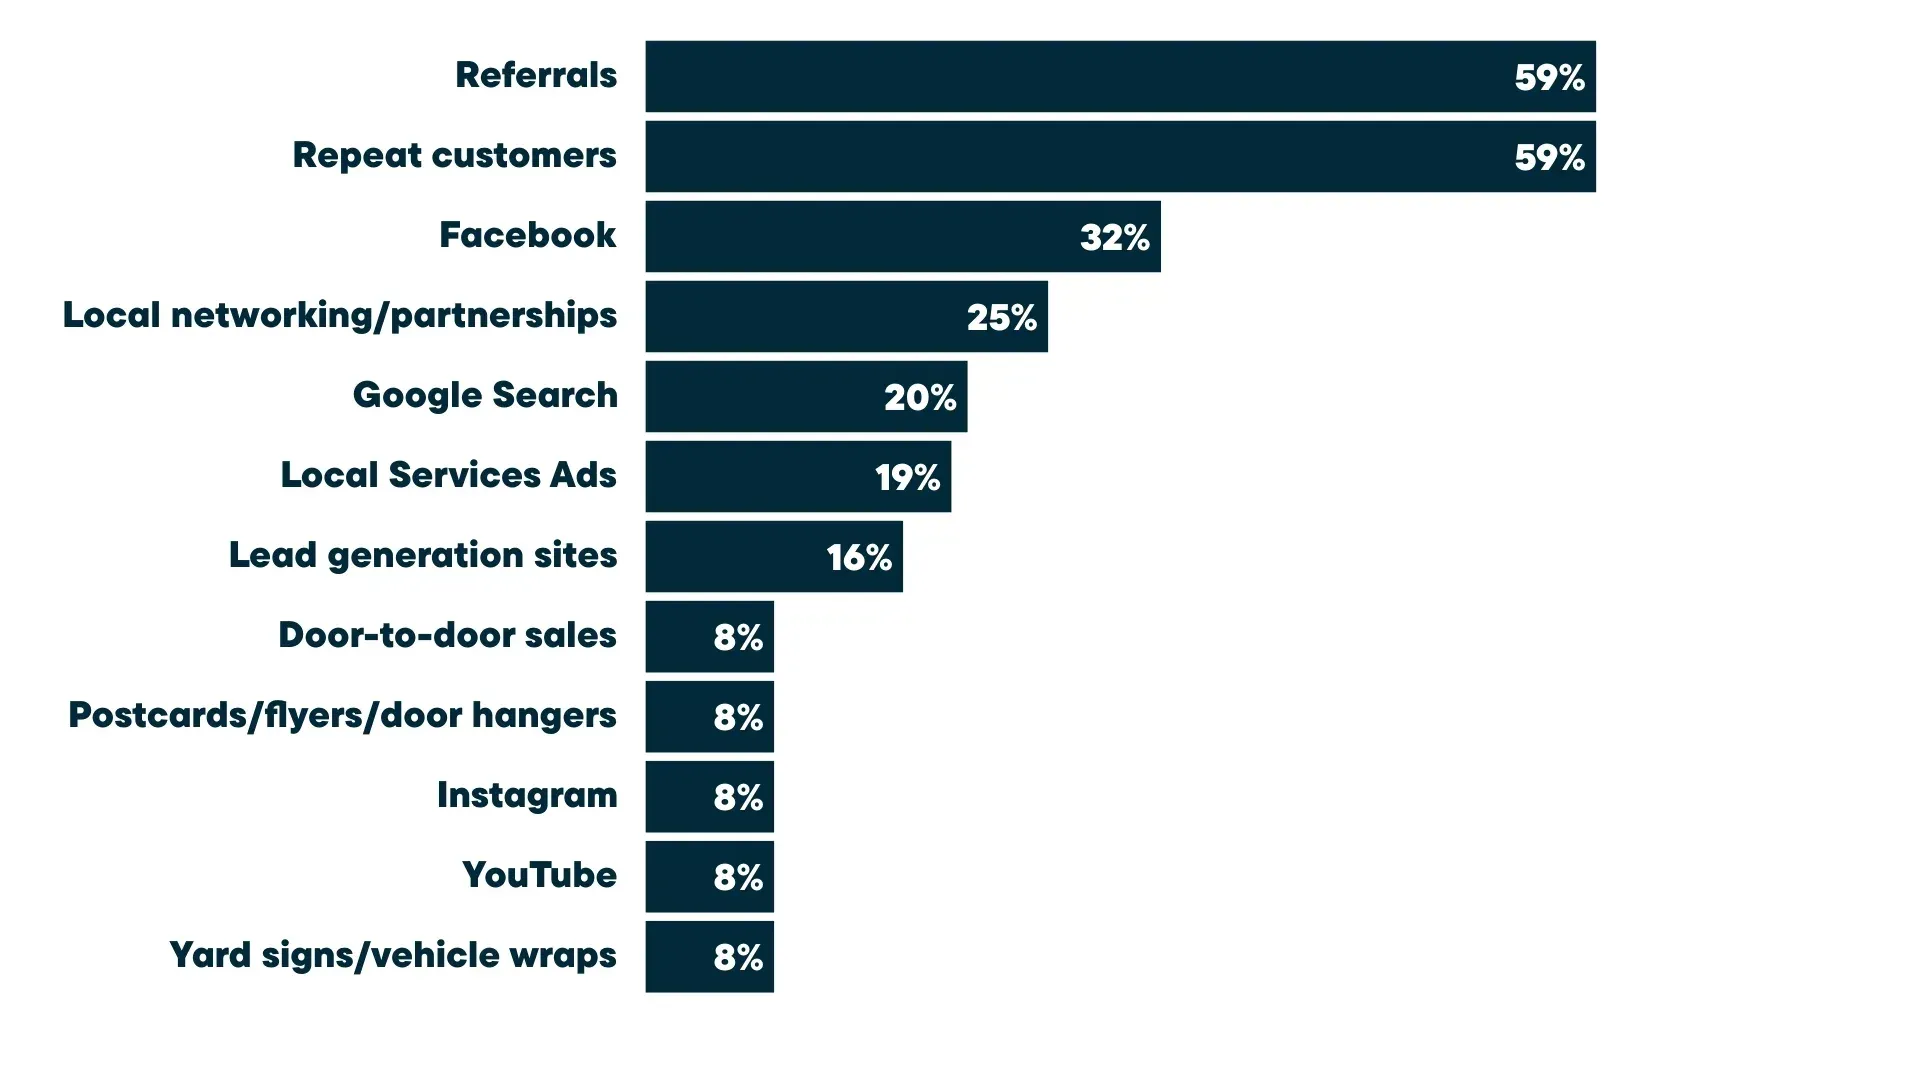 Figure 5: Referrals and repeat customers lead every other source by a wide margin, while paid and online channels each reach a fifth or less of owners. Source: Jobber, 2026 Home Service Trends Report, Feb 2026. Chart published by the source, captured 20 Oct 2026.
Where do shops get their leads?
Trust-based sources beat paid ones for the typical shop.
- Repeat customers were a top lead source for 59% of owners (Jobber, Feb 2026).
- Facebook was named by 32%, and local networking and partnerships by 25% (Jobber, Feb 2026).
- Google Search was named by 20%, Local Services Ads by 19%, and lead generation sites by 16% (Jobber, Feb 2026).
- Word-of-mouth referrals produced 71% of contractors’ business volume, and repeat customers produced 39% of revenue (ServiceTitan, Nov 2023).
How much do homeowners want to book and pay online?
Online booking is now a buying factor, not a bonus.
- 62% of homeowners expect to pay digitally (Housecall Pro, Dec 2025).
- 96% say a professional, user-friendly website matters when hiring a pro (Housecall Pro, Dec 2025).
- 37% cited being able to view and confirm appointments online as reassuring before a visit (Housecall Pro, Dec 2025).
- 91% of US adults own a smartphone (Pew Research Center, Oct 2026).
- 97% of US adults use the internet (Pew Research Center, Oct 2026).
How fast do customers expect an answer?
Speed is the cheapest way to win a job, and many shops are slow.
- 97% of homeowners say response time influences hiring decisions (Housecall Pro, Dec 2025).
- 28% of customers expect an immediate response, and another 28% expect one within an hour (Jobber, Feb 2026).
- 60% of pros reply to leads the same day, and 20% reply within the hour (Jobber, Feb 2026).
- Only 11% of HVAC pros reply within the hour, the slowest trade Jobber compared (Jobber, Feb 2026).
- 59% of homeowners expect text updates while the job is in progress (Housecall Pro, Dec 2025).
- One in three homeowners lists late arrival as a top frustration (Housecall Pro, Dec 2025).
What do customers want to see before they say yes?
Clear prices, proof and a findable website do more than polish.
- 97% of homeowners say transparent pricing matters when hiring a pro (Housecall Pro, Dec 2025).
- 72% would pay 10% more for a pro with a better customer service reputation (Housecall Pro, Dec 2025).
- 68% want photo or video proof of completed work (Housecall Pro, Dec 2025).
- 58% cited a technician’s photo and ID as reassuring before a visit (Housecall Pro, Dec 2025).
- 43% of shops do not list their service areas on their website, 65% do not show hours, and 74% have no FAQ (Jobber, Feb 2026).
- 54% of consumers visit a business website after reading positive reviews, up from 32% in 2019 (BrightLocal, Feb 2026).
How big are the home service lead platforms?
The big marketplaces are smaller and more selective than they were, and the money is moving from selling leads to selling ads and direct bookings.
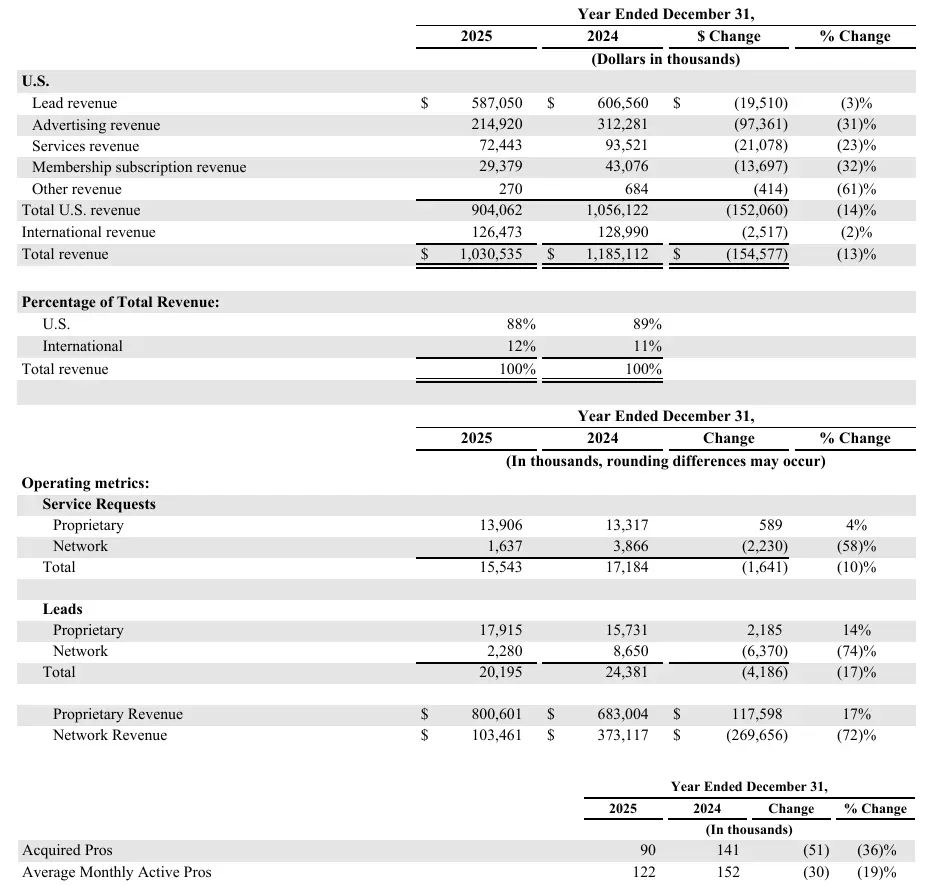 Figure 6: Angi’s revenue fell 13% in 2025 as its network channel collapsed, while its own proprietary channel grew. Source: Angi Inc., 2025 Annual Report on Form 10-K, Feb 2026. Screenshot of the filing page, captured 20 Oct 2026.
How big is Angi?
Angi is one of the biggest US marketplaces, and its filing is the clearest public view of the lead business.
- About 111,000 average monthly active pros used Angi in the fourth quarter of 2025 across more than 500 categories (Angi Inc. 10-K, Feb 2026).
- Consumers used an Angi business to find a pro for about 16 million projects in 2025 (Angi Inc. 10-K, Feb 2026).
- Total revenue fell 13% to $1.03 billion (Angi Inc. 10-K, Feb 2026).
- US lead revenue was $587.1 million, down 3%, and advertising revenue fell 31% to $214.9 million (Angi Inc. 10-K, Feb 2026).
- Selling and marketing cost was 49% of revenue (Angi Inc. 10-K, Feb 2026).
What happened to lead volume and pros?
Fewer pros are paying, and the shared lead network shrank fast.
- Average monthly active pros fell 19% to 122,000 for the full year (Angi Inc. 10-K, Feb 2026).
- Leads sent to pros fell 17% to 20.2 million (Angi Inc. 10-K, Feb 2026).
- Network revenue fell 72% to $103.5 million, while proprietary revenue rose 17% to $800.6 million (Angi Inc. 10-K, Feb 2026).
- Proprietary service requests rose 4% to 13.9 million (Angi Inc. 10-K, Feb 2026).
Who else sells leads and ads?
Other platforms are growing in the same period, mostly through advertising.
- Yelp’s Services advertising revenue grew 8% in 2025, led by its Auto Services and Home Services categories (Yelp 10-K, Feb 2026).
- Yelp’s average cost per click rose 9% and ad clicks fell 3% in 2025 (Yelp 10-K, Feb 2026).
- Thumbtack reported 300,000 local service businesses on its platform (Thumbtack, Dec 2025).
- Thumbtack counted more than 13 million 5-star projects (Thumbtack, Dec 2025).
- ServiceTitan, a software vendor for the trades, had about 10,800 customers billing over $10,000 a year (ServiceTitan 10-K, Mar 2026).
- ServiceTitan held gross dollar retention above 95% in each of the last three fiscal years (ServiceTitan 10-K, Mar 2026).
What is holding back home service demand?
Cost worries, not lost interest, are slowing projects. Owners still want the work and push it back.
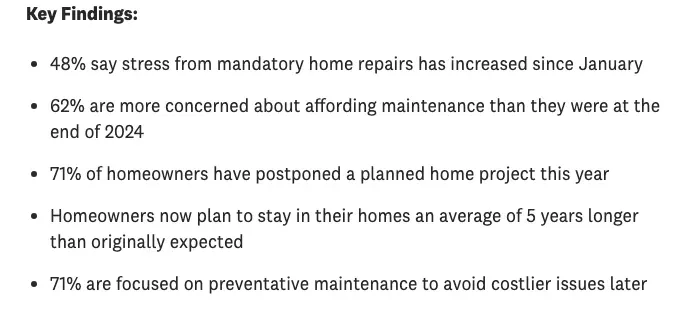 Figure 7: Nearly half of surveyed homeowners said repair stress rose in 2025, and most put a planned project on hold. Source: Angi, State of Home Spending Pulse Report 2025, May 2025. Screenshot of the source page, captured 20 Oct 2026.
Why are projects being postponed?
Owners blame prices and uncertainty before they blame their own plans.
- 92% of those who postponed cited inflation, and 89% cited economic uncertainty (Angi, May 2025).
- 65% cited high interest rates, and 64% cited worry about income or job stability (Angi, May 2025).
- 58% delayed work because of high materials or labor costs (Angi, May 2025).
- Yelp told investors that consumers forwent, delayed or scaled down services projects through 2025 (Yelp 10-K, Feb 2026).
- 58% of US adults said price changes over the past year made their finances worse, down from 65% in 2023 (Federal Reserve, May 2026).
How are owners coping?
Owners shift toward upkeep and bundling.
- 71% focused on preventive maintenance to avoid costlier repairs later (Angi, May 2025).
- 29% bundled repairs to cut labor cost, and 23% started projects early to beat expected price hikes (Angi, May 2025).
- 62% were more worried about affording maintenance than at the end of 2024 (Angi, May 2025).
- 48% said stress from mandatory repairs had increased since January (Angi, May 2025).
Why are owners staying in their homes?
Owners who cannot sell or move put money into the house they have.
- Existing home sales stayed below 4.1 million a year through 2025, after a three-decade low of 4.09 million in 2023 (Harvard JCHS, Jun 2026).
- 67% of homeowners would rather renovate than move (Angi, Jan 2025).
- Owners now expect to stay in their homes five years longer than they first planned (Angi, May 2025).
- 61% of renovating homeowners plan to stay 11 years or more, and 44% call their home a forever home (Houzz, Apr 2026).
What slows the shops themselves?
Weather and competition rank above labor in owners’ own list of growth limits.
- 34% of owners named weather and seasonality as a top limit on growth, and 28% named rising competition (Jobber, Feb 2026).
- 23% named labor shortages, and 20% named pricing and margins (Jobber, Feb 2026).
- 54% of homeowners struggled to find skilled professionals, citing high costs, trouble finding workers and delays (Angi, Jan 2025).
- Demand for trade services usually peaks in the second quarter of ServiceTitan’s fiscal year, when hot weather arrives (ServiceTitan 10-K, Mar 2026).
What is the outlook for home services?
Expect slow growth in spending and more confidence among shop owners than among homeowners.
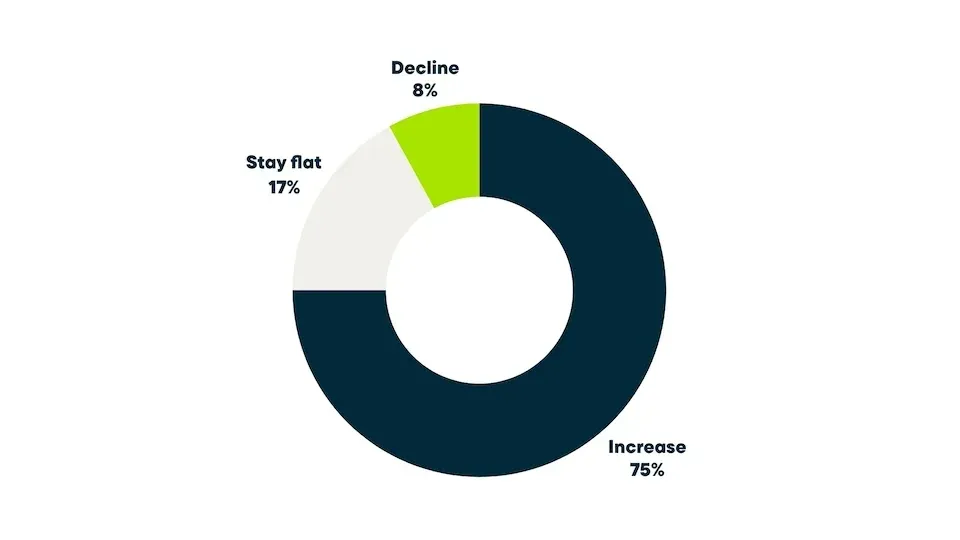 Figure 8: Three in four surveyed home service owners expect revenue to rise in the next 12 months, and only 8% expect it to fall. Source: Jobber, 2026 Home Service Trends Report, Feb 2026. Chart published by the source, captured 20 Oct 2026.
What do forecasts say?
The leading forecast for repair and improvement spending points to a soft landing, not a drop.
- Year-over-year growth in improvement and repair spending is projected to slow from 2.1% in the third quarter of 2026 to 0.5% in the second quarter of 2027 (Harvard JCHS, Jul 2026).
- JCHS called it a third straight quarter of slowing year-over-year growth, with permitting and retail spending on building products flat (Harvard JCHS, Jul 2026).
- The planned median renovation spend for 2026 is $15,000, down from $20,000 in 2025 (Houzz, Apr 2026).
- 50% of homeowners plan renovations in 2026, down from 52% (Houzz, Apr 2026).
What do the pros expect?
Owners of service shops are more optimistic than the spending data.
- 88% of businesses earning over $500,000 expect growth (Jobber, Feb 2026).
- More than half of pros surveyed by Thumbtack expect homeowners to increase renovation spending in 2026 (Thumbtack, Dec 2025).
- Over a third of the experts Thumbtack surveyed named the cost of homeownership as the biggest concern for 2026 (Thumbtack, Dec 2025).
- 93% of homeowners said in early 2025 that they planned projects that year (Angi, Jan 2025).
- 63% of homeowners aged 18 to 44 were saving for future projects, against 49% of those 65 and older (Angi, Jan 2025).
Methodology and Sources
We picked statistics that describe the size, spending, demand, staffing, booking habits and lead sources of the US home services trades. Every figure comes from the group that produced it: government agencies, a university research center, company filings, and original surveys from the platforms and software vendors that ran them. We checked each link and each number against the source page, and dropped anything we could not trace. Survey results from vendors reflect their own respondents, so treat them as direction, not census counts. The newest full market model we could verify is from 2022. We refresh this page monthly, and the next Harvard JCHS remodeling release is due on October 22, 2026.
Glossary
- BLS: Bureau of Labor Statistics, the US agency that counts jobs, pay and prices.
- QCEW: Quarterly Census of Employment and Wages, a BLS count of employer establishments, workers and pay from payroll tax records.
- CPI: Consumer Price Index, the BLS measure of price changes.
- JCHS: Harvard Joint Center for Housing Studies.
- TAM: total addressable market, a firm’s estimate of total spending in a market.
- LIRA: Leading Indicator of Remodeling Activity, the JCHS forecast of home improvement and repair spending.
- Nonemployer business: a business with no paid employees, usually one owner who works alone.
- Lead: a homeowner request sent to a pro, often sold by a marketplace.
- LSA: Local Services Ads, Google’s pay-per-lead ad format.
- GTV: gross transaction volume, the dollars invoiced through a software platform.
Sources
- Angi, Total Addressable Market for Home Services Grows to $657B (Jul 2022)
- Harvard JCHS, Remodeling Spending Poised for Further Slowdown (Jul 2026)
- BLS, Quarterly Census of Employment and Wages, 2025 annual, US (Aug 2026)
- Census Bureau, Nonemployer Statistics 2024, US file (Sep 2026)
- Housecall Pro, Home Service Customer Service Report (Dec 2025)
- Jobber, 2026 Home Service Trends Report (Feb 2026)
- Angi, 2025 State of Home Spending Pulse Report (May 2025)
- Angi Inc., Form 10-K for 2025 (Feb 2026)
- Federal Reserve, Economic Well-Being of U.S. Households in 2025 (May 2026)
- Houzz, 2026 U.S. Houzz & Home Study (Apr 2026)
- BrightLocal, Local Consumer Review Survey 2026 (Feb 2026)
- Yelp Inc., Form 10-K for 2025 (Feb 2026)
- Angi, Economy of Everything Home Report, $595B estimate (Jun 2021)
- Thumbtack, Home Care Price Index (Dec 2021)
- Angi, 2024 State of Home Spending Report, press release (Jan 2025)
- Harvard JCHS, The State of the Nation’s Housing 2026 (Jun 2026)
- BLS, Consumer Expenditures 2024 (Dec 2025)
- Angi, 2024 State of Home Spending Report (Jan 2025)
- BLS, Consumer Price Index, Table 2 (Sep 2026)
- BLS, Occupational Outlook Handbook, General Maintenance and Repair Workers (Aug 2026)
- BLS, Occupational Outlook Handbook, Janitors and Building Cleaners (Aug 2026)
- BLS, Occupational Outlook Handbook, Pest Control Workers (Sep 2026)
- ServiceTitan, Residential Services Report 2023 (Nov 2023)
- Pew Research Center, Mobile Fact Sheet (Oct 2026)
- Pew Research Center, Internet and Broadband Fact Sheet (Oct 2026)
- Thumbtack and Redfin, 2026 Home Trend Predictions (Dec 2025)
- ServiceTitan, Form 10-K for fiscal 2026 (Mar 2026)