Field service industry statistics are scattered across vendor surveys, market research firms and a few government tables. No one agency counts every technician or every app. This page puts the best numbers in one place and ties each one to the group that produced it, with a date and a link.
The picture for 2026 is a trade that already runs on software but still runs on paper too. Large field teams report near-universal AI use, while the Census Bureau finds about one in five US businesses using it. Appointments slip often. Technicians spend as much time on forms as on repairs. Those gaps are where small shops can move first.
We update this page every month. Every figure comes from the primary source named next to it. We dropped any number we could not trace back to its origin. Where research firms disagree, we show each estimate under its own name.
Key Takeaways
- 95% of field service organizations now use some form of AI (Salesforce, Jul 2026).
- Only 19.8% of all US businesses used AI in early May 2026 (Census Bureau, May 2026).
- Technicians estimate 47% of their appointments do not go according to schedule (Salesforce, Apr 2025).
- The industry first-time fix benchmark is 77%, and top teams reach 88% (Aquant, Feb 2026).
- Failed visits account for 25% of total service cost at the median (Aquant, Feb 2026).
- The US field service management software industry is worth $3.1 billion in 2026 (IBISWorld, Feb 2026).
- 43% of field service organizations still rely on manual or paper logs to manage assets (Salesforce, Jul 2026).
- 35% of field service software buyers manage work with spreadsheets and pen and paper (Software Advice, Apr 2026).
- Only 16% of organizations run field and back-office technology on one platform (Salesforce, Jul 2026).
- Admin work takes 30% of a technician’s hours, slightly more than the 28% spent doing the service (Salesforce, Apr 2025).
- 44% of field service leaders say their mobile workers cannot quote accurately in the field (Salesforce, Jul 2026).
- 66% of leaders say mobile worker turnover rose over the past two years (Salesforce, Jul 2026).
- Only 11% of trades contractors place high or complete trust in the AI tools they use (ServiceTitan, Sep 2026).
- About 569,000 installation, maintenance and repair jobs open each year (BLS, Aug 2026).
How big is the field service management market?
Every research firm sizes this market differently, so treat each number as one firm’s model and not a census. The direction is the same in all of them: steady growth, led by cloud software and scheduling tools.
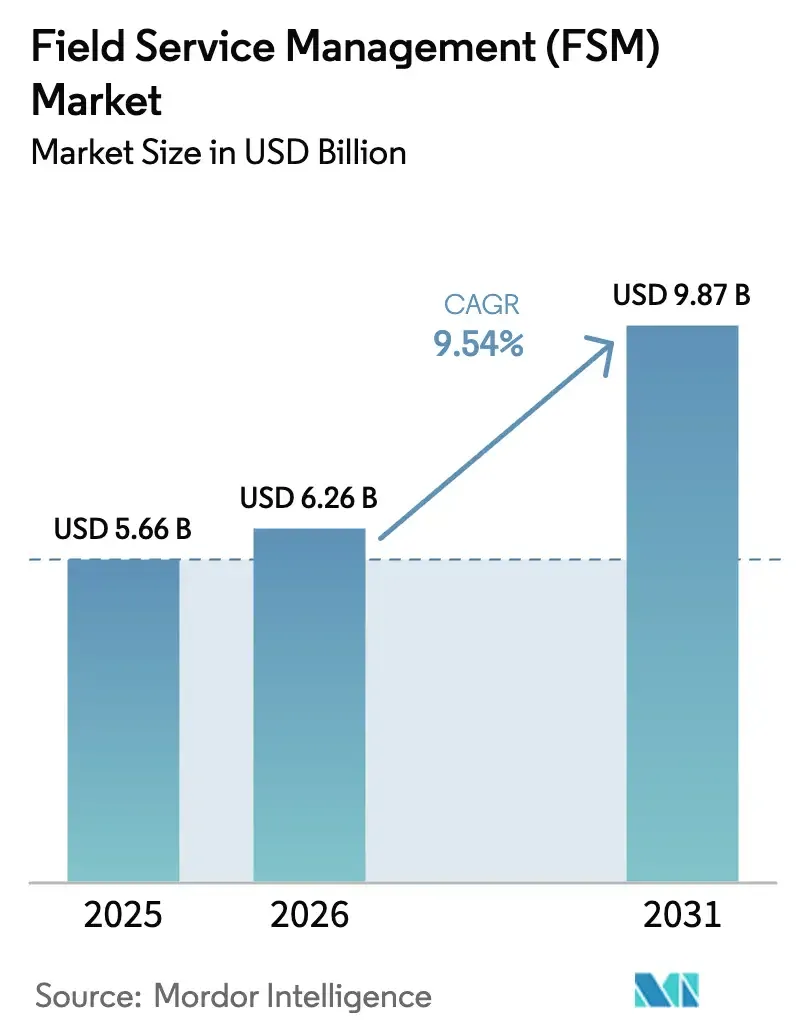 Figure 1: Mordor Intelligence models the global field service management market growing about 9.5% a year, the lowest growth rate of the three global forecasts on this page. Source: Mordor Intelligence, Field Service Management Market Size, Trends and Analysis, Jan 2026. Chart published by the source under a CC BY 4.0 license, captured 20 Oct 2026.
What do field service management statistics say about global market size?
Three firms publish global estimates. They differ on the starting point and the growth rate.
- Mordor Intelligence sizes the global market at $6.26 billion in 2026, up from $5.66 billion in 2025 (Mordor Intelligence, Jan 2026).
- Mordor forecasts $9.87 billion by 2031, a 9.54% compound annual growth rate (Mordor Intelligence, Jan 2026).
- MarketsandMarkets puts the market at $5.10 billion in 2025, after $4.52 billion in 2024 (MarketsandMarkets, Nov 2025).
- MarketsandMarkets forecasts $9.17 billion by 2030, a 12.5% growth rate (MarketsandMarkets, Nov 2025).
- Technavio expects the FSM software market to add $2.50 billion between 2025 and 2030, a 14.8% growth rate (Technavio, Mar 2026).
How big is the US market?
IBISWorld counts the US software industry on its own, using industry codes and company revenue. It is a narrower view than the global models above.
- The US industry has 85 businesses (IBISWorld, Feb 2026).
- The number of businesses grew at an 8.3% annual rate from 2021 to 2026 (IBISWorld, Feb 2026).
- Market size grew at a 7.7% annual rate over the same five years (IBISWorld, Feb 2026).
- Oracle, SAP and PTC are the largest companies in the US industry (IBISWorld, Feb 2026).
- North America produced 37.89% of global revenue in 2025 (Mordor Intelligence, Jan 2026).
Where is the money going inside the market?
The big spenders are large firms and utilities, but small and mid-size firms are the faster-growing group.
- Cloud tools took 64.29% of 2025 revenue and are forecast to grow 10.58% a year through 2031 (Mordor Intelligence, Jan 2026).
- Large enterprises held 57.55% of 2025 revenue (Mordor Intelligence, Jan 2026).
- Small and mid-size firms are growing faster, at 10.12% a year to 2031 (Mordor Intelligence, Jan 2026).
- Scheduling, dispatch and route tools led all solution types with 28.16% of 2025 revenue (Mordor Intelligence, Jan 2026).
- AI-driven scheduling tools are forecast to grow 9.89% a year to 2031 (Mordor Intelligence, Jan 2026).
- Energy and utilities led the end-user list with 21.65% of 2025 revenue (Mordor Intelligence, Jan 2026).
What do small shops budget for field service software?
Software Advice tracked what buyers say they plan to spend, per user, per month. Plumbing and HVAC buyers budget the most.
- The average buyer budget is about $88 per user per month (Software Advice, Apr 2026).
- Plumbing buyers average $111 per user per month (Software Advice, Apr 2026).
- HVAC buyers average $107 per user per month (Software Advice, Apr 2026).
- Electrical buyers average $91 per user per month (Software Advice, Apr 2026).
- Lawn care buyers average $78 and cleaning buyers $65 (Software Advice, Apr 2026).
Is overall technology spending rising?
Software is one of the fastest-growing parts of world IT spending, and small businesses say they plan to keep adding tools.
- Gartner forecasts world IT spending of $6.37 trillion in 2026, up 14.2% (Gartner, Jul 2026).
- Gartner forecasts software spending of $1,468 billion in 2026, up 15.5% (Gartner, Jul 2026).
- 84% of small businesses plan to use more technology over the next two to three years (U.S. Chamber of Commerce, Oct 2026).
Who works in field service jobs?
Field work is a large, well-paid and fast-growing group of jobs. The government counts it as installation, maintenance and repair, and it pays above the all-jobs median. The list below skips HVAC technicians, plumbers and electricians, which have their own pages.
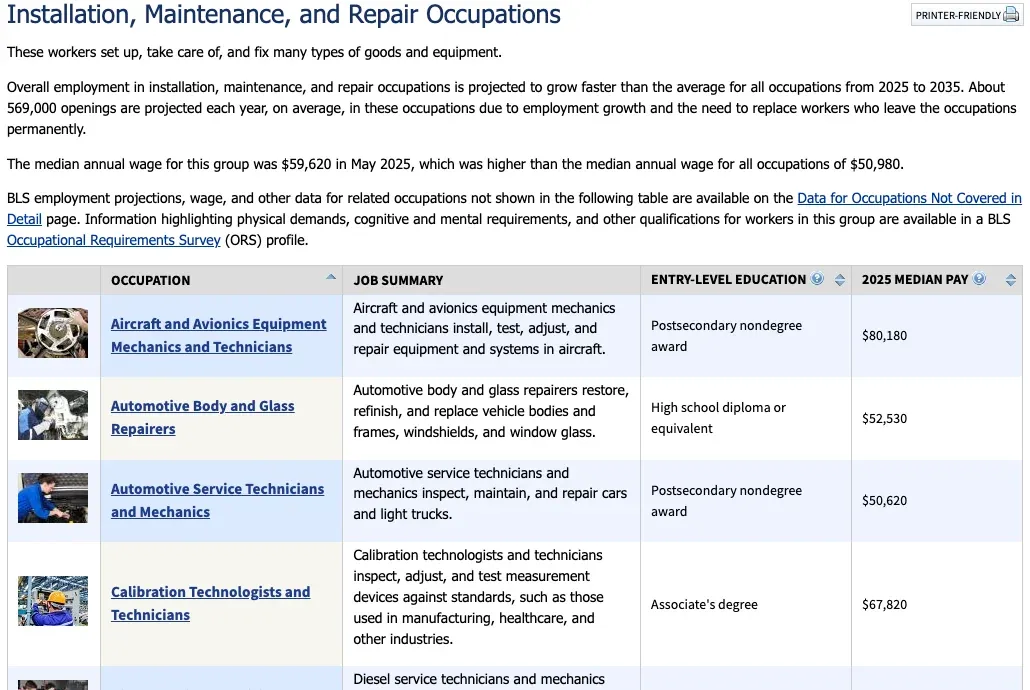 Figure 2: The BLS handbook lists the installation, maintenance and repair group with its projected openings and the median pay of each job, so a shop can see where field jobs sit against the wider labor market. Source: BLS, Occupational Outlook Handbook, Installation, Maintenance, and Repair Occupations, Aug 2026. Screenshot of the source page, captured 20 Oct 2026.
How does field work pay compared with other jobs?
The whole group beats the national median, and some specialties pay far more.
- The median wage for the installation, maintenance and repair group was $59,620 in May 2025, against $50,980 for all occupations (BLS, Aug 2026).
- Elevator and escalator installers and repairers earned a median $109,910 (BLS, Aug 2026).
- Electrical power-line installers and repairers earned a median $95,320 (BLS, Aug 2026).
- Electrical and electronics installers and repairers earned a median $74,490 (BLS, Aug 2026).
- Telecommunications technicians earned a median $66,200 (BLS, Aug 2026).
- Wind turbine technicians earned a median $64,120 (BLS, Aug 2026).
- Industrial machinery mechanics and millwrights earned a median $64,100 (BLS, Aug 2026).
- Medical equipment repairers earned a median $61,660 (BLS, Aug 2026).
Which field jobs are growing fastest?
BLS projects growth from 2025 to 2035. Some of the largest groups of field workers are growing fast. Telecom is the exception.
- Overall employment in the group is projected to grow faster than the average for all occupations (BLS, Aug 2026).
- Wind turbine technicians are projected to grow 30%, from 11,800 jobs in 2025 (BLS, Aug 2026).
- Industrial machinery mechanics and millwrights are projected to grow 14%, adding 78,900 jobs from a base of 547,300 (BLS, Aug 2026).
- Medical equipment repairers are projected to grow 13%, from 71,800 jobs (BLS, Aug 2026).
- Electrical power-line installers and repairers are projected to grow 10%, from 131,900 jobs (BLS, Aug 2026).
- Heavy vehicle and mobile equipment service technicians are projected to grow 7%, from 242,400 jobs (BLS, Aug 2026).
- Elevator and escalator installers and repairers are projected to grow 6%, from 24,700 jobs (BLS, Aug 2026).
- Telecommunications technicians are projected to shrink 3%, from 257,800 jobs (BLS, Aug 2026).
Are field teams keeping their people?
Keeping a trained technician matters as much as hiring one. The best teams lose fewer people, and the gap in skill between their best and average technician is smaller.
- Top-performing companies retain 87% of employees, against 66% at underperformers (Aquant, Feb 2026).
- The first-time fix gap between a top technician and everyone else is 2.9 points at best-in-class teams and 10 points at underperforming teams (Aquant, Feb 2026).
- Leaders named too little training or support when new technology arrives as the top reason turnover is rising (Salesforce, Jul 2026).
- 66% of technicians and tradespeople feel burned out at least monthly (Salesforce, Apr 2025).
- 81% work overtime on admin tasks at least monthly (Salesforce, Apr 2025).
- 60% of residential contractors name labor and overhead as the biggest risk to their business (ServiceTitan, Apr 2026).
What tools do field teams use to run jobs?
Most teams use a mix: mobile apps, inventory tools, GPS and, still, spreadsheets and paper. The tools exist. What is missing is a single place where they meet.
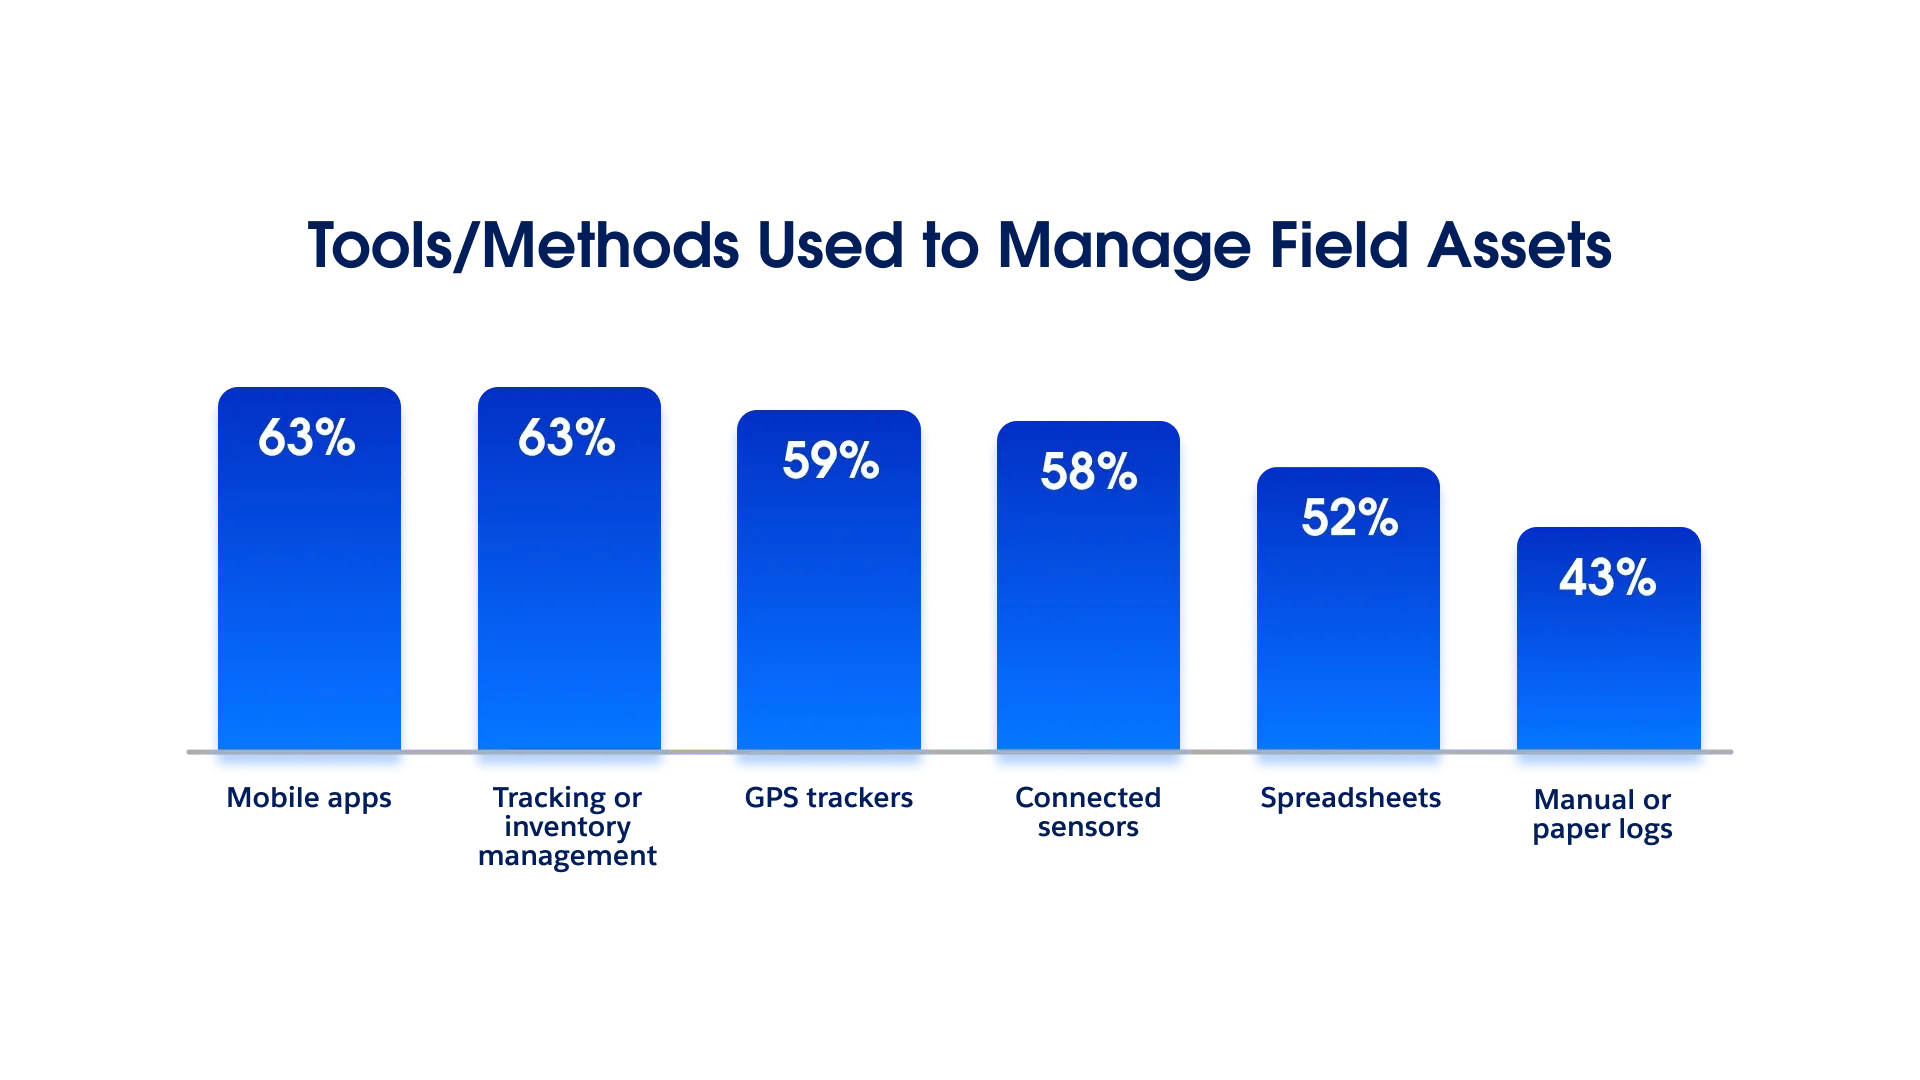 Figure 3: Salesforce asked field service leaders how they manage field assets and found modern tools sitting beside spreadsheets and paper logs in the same organizations. Source: Salesforce, State of Field Service: The Road to Revenue in the Agentic Era, Jul 2026. Chart published by the source, captured 20 Oct 2026.
Which tools are most common?
- 63% of organizations use mobile apps to manage field assets (Salesforce, Jul 2026).
- 63% use inventory management or tracking systems (Salesforce, Jul 2026).
- 59% use GPS trackers (Salesforce, Jul 2026).
- 58% have connected sensors (Salesforce, Jul 2026).
- 52% still use spreadsheets (Salesforce, Jul 2026).
- 98% of US adults own a cellphone, so customers can be reached by text almost everywhere (Pew Research Center, Oct 2026).
- Smartphone ownership stood at 35% in Pew’s first survey in 2011 (Pew Research Center, Oct 2026).
How many small shops work without specialist software?
Software Advice talks to thousands of buyers each year. Their answers show where small shops start from.
- 36% of buyers use non-specialized tools such as a CRM or accounting package for field work (Software Advice, Apr 2026).
- Nearly 26% of buyers have no system in place at all (Software Advice, Apr 2026).
- 52% of buyers cite inefficiency as the reason to switch (Software Advice, Apr 2026).
- 23% cite limited functionality in what they use now (Software Advice, Apr 2026).
- 49% of current users rate mobile access as the top feature (Software Advice, Apr 2026).
- 94% of prospective buyers prioritize contact management (Software Advice, Apr 2026).
How connected are field and office systems?
Most teams run field work and office work on different tools. That makes it hard for a technician to see the customer’s history on site.
- 61% of organizations say mobile workers have limited access to the customer data they need (Salesforce, Jul 2026).
- Only 20% of commercial contractors run on a single platform (ServiceTitan, Mar 2026).
- 55% of field service leaders say advanced technology is now their top competitive differentiator (Deloitte Digital, Jan 2026).
- High-maturity teams are 8.5 times as likely as low-maturity teams to run as a profit center (Deloitte Digital, Jan 2026).
- High-maturity teams are 6 times as likely to stress revenue generation (Deloitte Digital, Jan 2026).
How many small businesses use more than one tool?
- Nearly 100% of small businesses use at least one technology platform at work (U.S. Chamber of Commerce, Oct 2026).
- 41% now use six or more platforms, up 9 points from 2025 (U.S. Chamber of Commerce, Oct 2026).
- 50% of field service organizations offer customer self-service, but only 31% offer self-service that Deloitte rates as optimized (Deloitte Digital, Jan 2026).
How many field service teams use AI?
The answer depends on who you ask. Field service leaders report near-universal use, while the Census Bureau, which asks every kind of business, finds about one in five. Both can be true, because the questions and the firms are different.
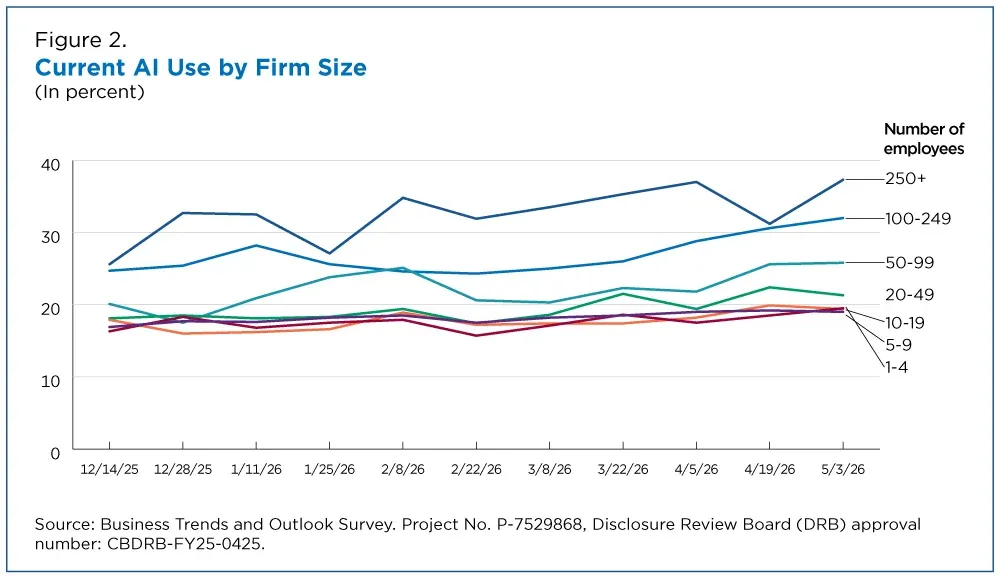 Figure 4: In the Census Bureau’s survey, AI use climbs with firm size, and firms with fewer than 20 employees sit near one in five and did not change much from December 2025 to May 2026. Source: U.S. Census Bureau, Large Firms With at Least 20 Employees Biggest AI Users, May 2026. Chart published by the source, captured 20 Oct 2026.
How common is AI inside field service organizations?
- 85% of organizations plan to increase AI investment over the next one to two years (Salesforce, Jul 2026).
- 54% use AI tools for customer communication (Salesforce, Jul 2026).
- 51% use AI to assist employees working in the field (Salesforce, Jul 2026).
- 40% of organizations use generative AI for analysis, reporting, technician help or task automation (Deloitte Digital, Jan 2026).
- 78% of high-performing field service organizations used AI in a 2022 survey, against 59% of underperforming and moderate performing ones (Salesforce, Jan 2023).
How common is AI in the trades?
Surveys of contractors show lower use than surveys of large field service teams.
- About 25% of residential contractors were using AI in early 2026 (ServiceTitan, Apr 2026).
- 74% of residential contractors view AI as an efficiency engine (ServiceTitan, Apr 2026).
- 73% believe starting early creates a competitive advantage (ServiceTitan, Apr 2026).
- 38% of commercial contractors report measurable business impact from AI, up from 17% in 2025 (ServiceTitan, Mar 2026).
- Over 70% of pros in a Housecall Pro survey reported using AI tools in 2025, and nearly 40% were actively using AI in their business (Housecall Pro, Jan 2026).
- 52% of blue-collar business owners use AI in daily operations (Jobber, Feb 2026).
How common is AI across all US businesses?
- Overall AI use hovered between 17% and 20% from December 2025 to May 2026 (Census Bureau, May 2026).
- Between 20% and 23% of firms expected to be using AI in the next six months (Census Bureau, May 2026).
- Fewer than 20% of firms with four or fewer employees used AI (Census Bureau, May 2026).
- 37% of firms with 250 or more employees used AI (Census Bureau, May 2026).
- 14% of retail firms used AI, against 39.7% in the information sector (Census Bureau, May 2026).
- 46% of small employer firms said their business or its employees currently use AI (Federal Reserve Banks, Mar 2026).
- 15% of small employer firms planned to start using AI in the next 12 months (Federal Reserve Banks, Mar 2026).
- 66% of small businesses use AI, up from 23% in 2023 (U.S. Chamber of Commerce, Oct 2026).
What do trade owners use AI for?
Most use it for writing and paperwork before anything else.
- 54% of AI-using blue-collar owners use it for quoting (Jobber, Feb 2026).
- 52% use it for invoicing (Jobber, Feb 2026).
- 88% of high-confidence businesses use AI, against 27% of low-confidence peers (Jobber, Feb 2026).
- 83% of small firms using AI apply it to writing or marketing (Federal Reserve Banks, Mar 2026).
What do shops get from AI?
Leaders report real gains, but the proof is thinner than the adoption. Productivity shows up first. Profit and revenue come more slowly.
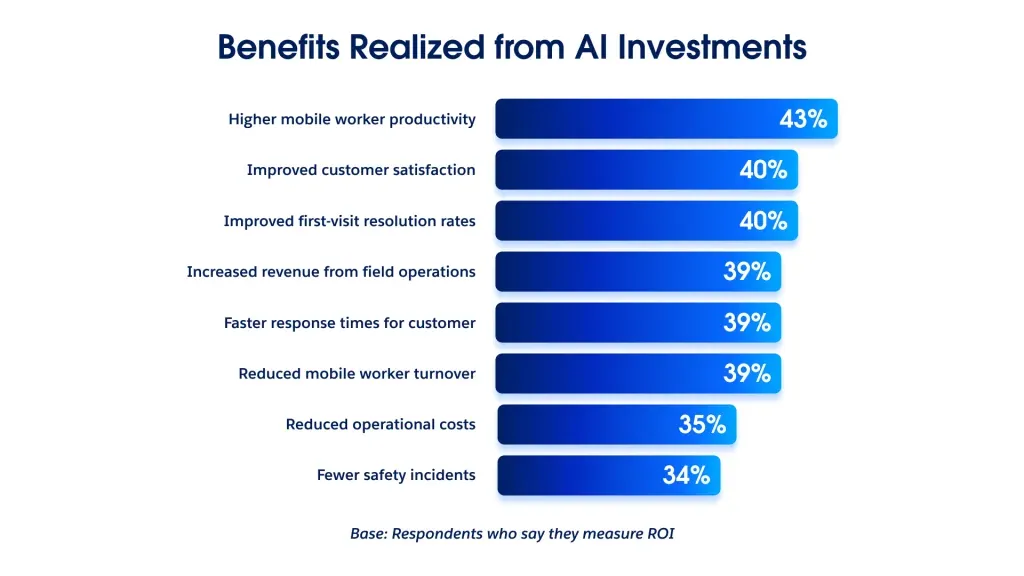 Figure 5: Among the leaders who measure return on AI, higher worker productivity leads the list of benefits and fewer safety incidents comes last, which shows where the gains are easiest to see. Source: Salesforce, State of Field Service: The Road to Revenue in the Agentic Era, Jul 2026. Chart published by the source, captured 20 Oct 2026.
What benefits do field service leaders report?
- 85% of leaders say they have measured the return on their AI investment (Salesforce, Jul 2026).
- 43% report higher mobile worker productivity (Salesforce, Jul 2026).
- 40% report better first-visit resolution rates (Salesforce, Jul 2026).
- 39% report more revenue from field operations (Salesforce, Jul 2026).
- 35% report lower operating costs (Salesforce, Jul 2026).
- 34% report fewer safety incidents (Salesforce, Jul 2026).
- 40% of leaders say they struggle to measure whether AI is working (Salesforce, Jul 2026).
What do contractors save?
- 66% of contractors who use AI save at least three hours a week (ServiceTitan, Sep 2026).
- 47% of AI users report better profit (ServiceTitan, Sep 2026).
- 43% report more revenue (ServiceTitan, Sep 2026).
- 48% of early adopters among residential contractors report higher productivity (ServiceTitan, Apr 2026).
- 71% of small firms using AI say it raised productivity (Federal Reserve Banks, Mar 2026).
- 31% of small firms using AI report higher sales (Federal Reserve Banks, Mar 2026).
- 78% of small business AI users say limiting access would slow growth (U.S. Chamber of Commerce, Oct 2026).
What holds shops back?
Cost is no longer the main worry. Knowing how to use AI, and trusting it, are.
- 37% of contractors name difficulty hiring and the workforce gap as their top reason to try AI (ServiceTitan, Sep 2026).
- 44% say understanding how to use AI in their business is a barrier (ServiceTitan, Sep 2026).
- 43% point to a lack of clear use cases (ServiceTitan, Sep 2026).
- High purchase cost fell 12 points from the earlier survey to 17% (ServiceTitan, Sep 2026).
- 58% report little or no trust in the AI tools they use (ServiceTitan, Sep 2026).
- 61% of AI users want AI built into their core platform (ServiceTitan, Sep 2026).
- 46% of small firms using AI name accuracy as a top challenge (Federal Reserve Banks, Mar 2026).
- Only 7% of small firms using AI have fully integrated it into the business (Federal Reserve Banks, Mar 2026).
Why does scheduling break down?
Scheduling is where field service shows its cracks first. A change in one job moves every job after it, and the work to rebook is slow.
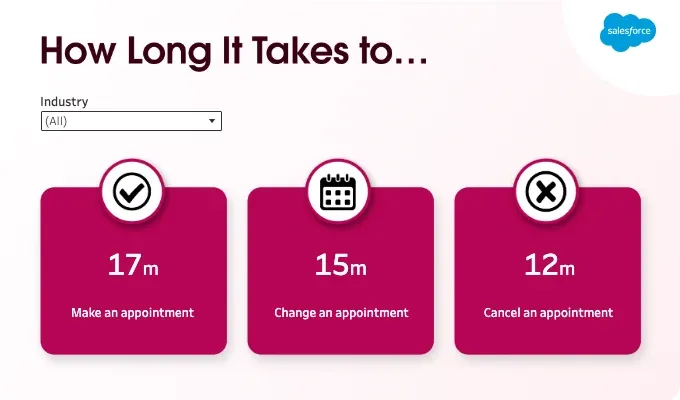 Figure 6: Technicians say that booking, changing and cancelling a single appointment each take more than ten minutes, which adds up fast on a busy dispatch board. Source: Salesforce, Tradespeople, Techs Waste Nearly a Full Day’s Work Weekly on Paperwork, Apr 2025. Chart published by the source, captured 20 Oct 2026.
How often do schedules slip?
- Scheduling conflicts rank as the top efficiency barrier for technicians (Salesforce, Apr 2025).
- 38% of technicians say schedules are often mishandled, due to customer miscommunication, unaccounted parts or too little time for the job and travel (Salesforce, Apr 2025).
- Technicians estimate it takes an average of 17 minutes to make an appointment (Salesforce, Apr 2025).
- Cancelling one takes 12 minutes (Salesforce, Apr 2025).
- 54% of service teams saw case volumes rise between 2021 and 2022 (Salesforce, Jan 2023).
- 82% of mobile workers struggle to balance speed and quality (Salesforce, Jan 2023).
What happens when AI runs the schedule?
Salesforce asked the leaders whose teams use AI for scheduling and dispatch.
- 57% report higher revenue per job (Salesforce, Jul 2026).
- 57% report higher mobile worker productivity (Salesforce, Jul 2026).
- 52% report lower emissions (Salesforce, Jul 2026).
- 49% report lower labor costs (Salesforce, Jul 2026).
Do customers book when the office is closed?
- 41% of jobs booked online through Housecall Pro come in after hours (Housecall Pro, Jan 2026).
- Many of those jobs arrive between 1 a.m. and 4 a.m. (Housecall Pro, Jan 2026).
What is a good first-time fix rate?
A repeat visit is the most expensive kind of visit. Aquant studied 161 service organizations, and the gap between its best and worst teams is wide.
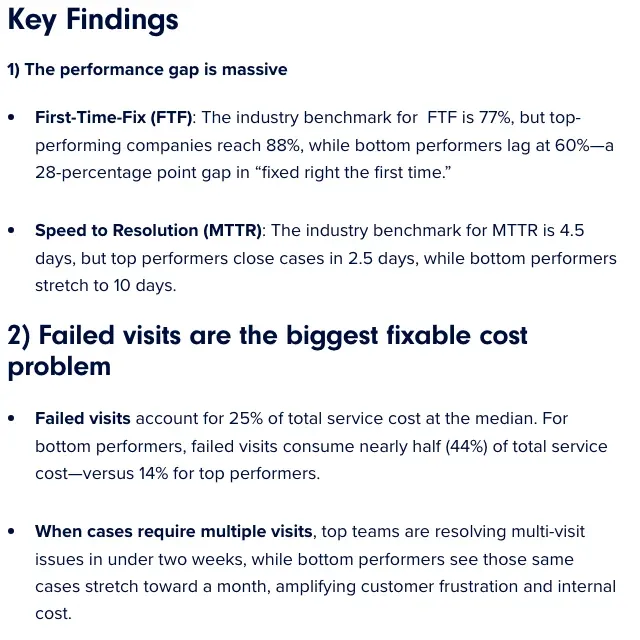 Figure 7: Aquant’s benchmark compares top and bottom teams on first-time fix, speed to resolution and failed visits, and the gap on each is large. Source: Aquant, 2026 Field Service Benchmark, Feb 2026. Screenshot of the source page, captured 20 Oct 2026.
How wide is the gap between top and bottom teams?
- Bottom performers fix 60% of jobs on the first visit (Aquant, Feb 2026).
- The industry benchmark for time to resolution is 4.5 days (Aquant, Feb 2026).
- Top performers close cases in 2.5 days, and bottom performers take 10 days (Aquant, Feb 2026).
- The report covers 161 service organizations and $8.3 billion in service costs over three years (Aquant, Feb 2026).
What do failed visits cost?
- Failed visits take 44% of total service cost at bottom performers, against 14% at top performers (Aquant, Feb 2026).
- 1 in 5 cases could be resolved remotely (Aquant, Feb 2026).
- When teams roll a truck for those cases, a 1.4% cost impact becomes 18.3% (Aquant, Feb 2026).
- Aquant models potential service cost savings of up to 26% in some segments, up from 23% a year earlier (Aquant, Feb 2026).
What does one truck trip cost?
The trip itself is a cost before the repair starts. These are general vehicle costs, not field service surveys.
- The IRS business mileage rate for 2026 is 72.5 cents per mile (IRS, Dec 2025).
- Half-ton pickups cost $1.10 per mile to operate (AAA, Sep 2026).
- Regular gasoline averaged $4.152 a gallon at the time of the AAA study, up 31.8% from 2025 (AAA, Sep 2026).
- Owning and running a new vehicle costs $12,863 a year on average (AAA, Sep 2026).
Where do paperwork, quotes and payment slow field teams down?
Technicians are paid for repairs, and they spend a large part of the day on forms, quotes and billing. That is the work that quoting and invoicing tools exist to cut.
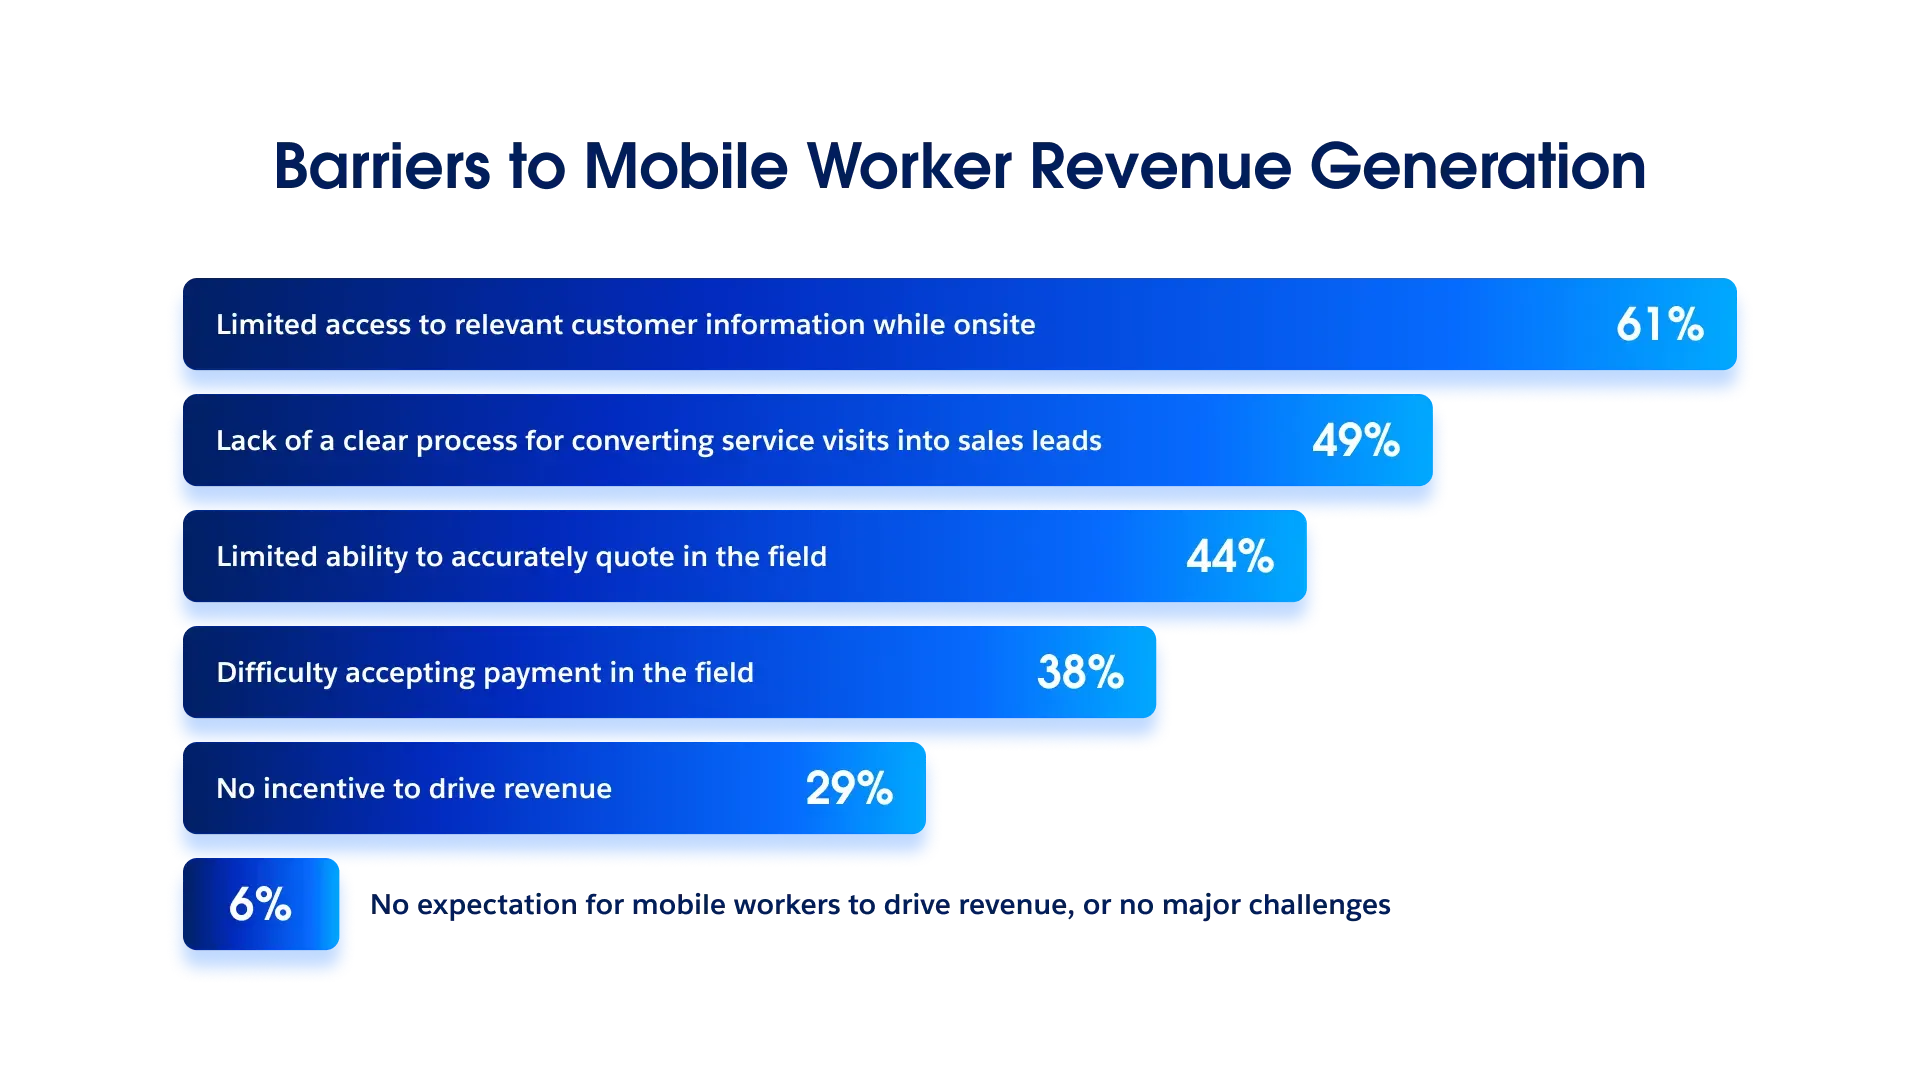 Figure 8: Field service leaders say the main block to selling and collecting in the field is missing information, followed by weak lead handling, quoting and payment tools. Source: Salesforce, State of Field Service: The Road to Revenue in the Agentic Era, Jul 2026. Chart published by the source, captured 20 Oct 2026.
How much time goes to admin work?
- Technicians estimate they waste more than seven hours a week on low-value tasks (Salesforce, Apr 2025).
- Salesforce estimates that adds up to a loss of over $260,000 a week at a company with 1,000 technicians (Salesforce, Apr 2025).
- 37% of technicians say admin tasks keep them from doing their actual jobs (Salesforce, Apr 2025).
- Technicians say AI agents could take 35% of their admin tasks off their plate (Salesforce, Apr 2025).
- 48% of home service owners say jobsite management eats the most time (Jobber, Feb 2026).
- 40% name customer communication (Jobber, Feb 2026).
Can technicians quote and sell in the field?
Most can sell, but many cannot quote on the spot. The tools and the process are missing.
- 86% of decision makers say frontline service teams are critical to growing the business (Salesforce, Jan 2023).
- 82% of organizations depend on mobile workers to upsell products and services (Salesforce, Jan 2023).
- 49% of organizations lack a clear process for turning service visits into sales leads (Salesforce, Jul 2026).
- 29% of leaders say mobile workers have no incentive to drive revenue (Salesforce, Jul 2026).
- 37% of home service owners name quoting as a top time sink (Jobber, Feb 2026).
- Only 16% of pros offer tiered good, better, best quotes (Jobber, Feb 2026).
- Optional line items lift upsell rates to between 25% and 50% (Jobber, Feb 2026).
How fast do field teams get paid?
- Nearly 80% of service pros get paid within three days of finishing a job (Jobber, Feb 2026).
- 48% are paid the same day (Jobber, Feb 2026).
- 11% wait more than a week (Jobber, Feb 2026).
- Jobber’s benchmark for top businesses is a deposit rate of 30% or more (Jobber, Feb 2026).
- 38% of field service organizations struggle to accept payment in the field (Salesforce, Jul 2026).
- Digital payments on Jobber grew 6% year over year in Q2 2026 (Jobber, Aug 2026).
- 57% of commercial contractors name better billing timelines as a way to protect profit (ServiceTitan, Mar 2026).
- 67% of commercial firms use lines of credit to fund materials (ServiceTitan, Mar 2026).
Methodology and Sources
We chose figures that a reporter could use in a story and that we could trace to the group that ran the survey or kept the data. Government sources come first, then research firms and software makers that ran their own surveys. Roundups and blog posts that repeat other people’s numbers are not used. We opened every link and read the figure on the page before listing it. Survey results from software makers describe the people they surveyed, so read them as that group’s view. Market sizes come from model-based reports and differ by firm, so each is named. We refresh this page every month.
Related pages: home services industry statistics and HVAC industry statistics.
Glossary
- FSM: field service management, the software or process used to schedule, dispatch and track work done at customer sites.
- First-time fix: the share of jobs solved on the first visit.
- MTTR: mean time to resolution, the average time to close a case.
- Mobile worker: a technician or tradesperson who works at customer sites.
- Truck roll: a trip by a technician to a customer site.
- CAGR: compound annual growth rate.
- BLS: the US Bureau of Labor Statistics.
- BTOS: the Census Bureau’s Business Trends and Outlook Survey.
- AI: artificial intelligence.
Sources
- AAA, Your Driving Costs 2026, Sep 2026
- Aquant, 2026 Field Service Benchmark, Feb 2026
- BLS, Electrical Power-Line Installers and Repairers, Aug 2026
- BLS, Electrical Power-Line Installers and Repairers, Aug 2026
- BLS, Electrical and Electronics Installers and Repairers, Aug 2026
- BLS, Elevator and Escalator Installers and Repairers, Aug 2026
- BLS, Heavy Vehicle and Mobile Equipment Service Technicians, Aug 2026
- BLS, Industrial Machinery Mechanics, Machinery Maintenance Workers, and Millwrights, Aug 2026
- BLS, Installation, Maintenance, and Repair Occupations, Aug 2026
- BLS, Medical Equipment Repairers, Aug 2026
- BLS, Wind Turbine Technicians, Aug 2026
- Deloitte Digital, 2026 Field Service Report, Jan 2026
- Federal Reserve Banks, 2026 Report on Employer Firms (Small Business Credit Survey), Mar 2026
- Gartner, Worldwide IT Spending Forecast, July 2026, Jul 2026
- Housecall Pro, 2026 Field and Home Service Industry Trends, Jan 2026
- IBISWorld, Field Service Management Software in the US, Feb 2026
- IRS, 2026 Business Standard Mileage Rate, Dec 2025
- Jobber, 2026 Home Service Trends Report, Feb 2026
- Jobber, Home Service Economic Report: Q2 2026, Aug 2026
- MarketsandMarkets, Field Service Management Market Report 2025 to 2030, Nov 2025
- Mordor Intelligence, Field Service Management Market, Jan 2026
- Pew Research Center, Mobile Fact Sheet, Oct 2026
- Salesforce, Field Service Research from the 2022 State of Service Survey, Jan 2023
- Salesforce, State of Field Service: The Road to Revenue in the Agentic Era, Jul 2026
- Salesforce, Tradespeople, Techs Waste Nearly a Full Day’s Work Weekly on Paperwork, Apr 2025
- ServiceTitan, 2026 Commercial Specialty Contractor Industry Report, Mar 2026
- ServiceTitan, 2026 Residential State of the Trades Report, Apr 2026
- ServiceTitan, 2026 State of AI in the Trades, Sep 2026
- Software Advice, Buyer Insights for Field Service Software, Apr 2026
- Technavio, Field Service Management Software Market 2026 to 2030, Mar 2026
- U.S. Census Bureau, AI Use at U.S. Businesses, May 2026
- U.S. Chamber of Commerce, Empowering Small Business 2026, Oct 2026