Home improvement industry statistics point one way in 2026: dollars are holding up, but customers are not coming back faster. Store sales are still below their 2022 peak, and the trade group that tracks product sales says the growth in dollars is inflation. The people who gained ground are remodelers, who now make up most of the firms that build and fix homes.
This page follows the industry from the shelf to the job site. It covers store sales, store counts, the largest retailers, contractors, jobs and the growth outlook. Each number comes from the group that produced it, with a date and a link. When two sources size the same thing differently, we show both.
We refresh this page every month. We dropped any figure we could not trace to its origin or open at the link shown.
Key Takeaways
- US building material and garden equipment dealers sold $505.3 billion in 2025 (Census Bureau, Monthly Retail Trade, Oct 2026).
- The Home Improvement Research Institute expects the US home improvement products market to reach about $626 billion by 2030 (HIRI, Jul 2026).
- Home improvement rose from 33% of residential construction spending in 2007 to 44% in the first quarter of 2025 (NAHB, Feb 2026).
- The number of US remodeling companies nearly doubled, from fewer than 69,000 in 2000 to more than 128,000 in early 2025 (NAHB, Nov 2025).
- There were 135,337 residential remodeler establishments with paid staff in 2023 (Census Bureau, County Business Patterns, Jun 2025).
- 897,780 residential building construction firms had no employees in 2024 and brought in $91.9 billion (Census Bureau, Nonemployer Statistics, Sep 2026).
- The Home Depot sold $164.7 billion in fiscal 2025 through 2,359 stores (Home Depot 10-K, Mar 2026).
- Home Depot customer transactions fell 2.2% to 1,601.5 million while the average ticket rose 1.4% to $90.56 (Home Depot 10-K, Mar 2026).
- Sherwin-Williams paint store sales rose 3.2% in 2025, driven by price increases, while volume fell (Sherwin-Williams 10-K, Feb 2026).
- Lowe’s cut its 2026 sales outlook to $92.0 billion and now expects flat comparable sales (Lowe’s, Aug 2026).
- Building material dealers employed 1.36 million people in September 2026, down from a peak of 1.45 million in December 2020 (BLS Current Employment Statistics, Oct 2026).
- The NAHB Remodeling Market Index read 62 in the third quarter of 2026, with 50 as the break-even line (NAHB, Oct 2026).
- Construction laborers and helpers hold 1,674,400 jobs, and BLS projects 6% growth to 2035 (BLS Occupational Outlook Handbook, Aug 2026).
- Trade customers now bring in 30% of Kingfisher’s revenue, up from 27% (Kingfisher, Mar 2026).
How big is the home improvement market?
Nobody agrees on one number, because each source draws the line in a different place. The Census Bureau counts store sales, a trade group counts products, and a research firm counts one store type. Read all three before you quote any of them.
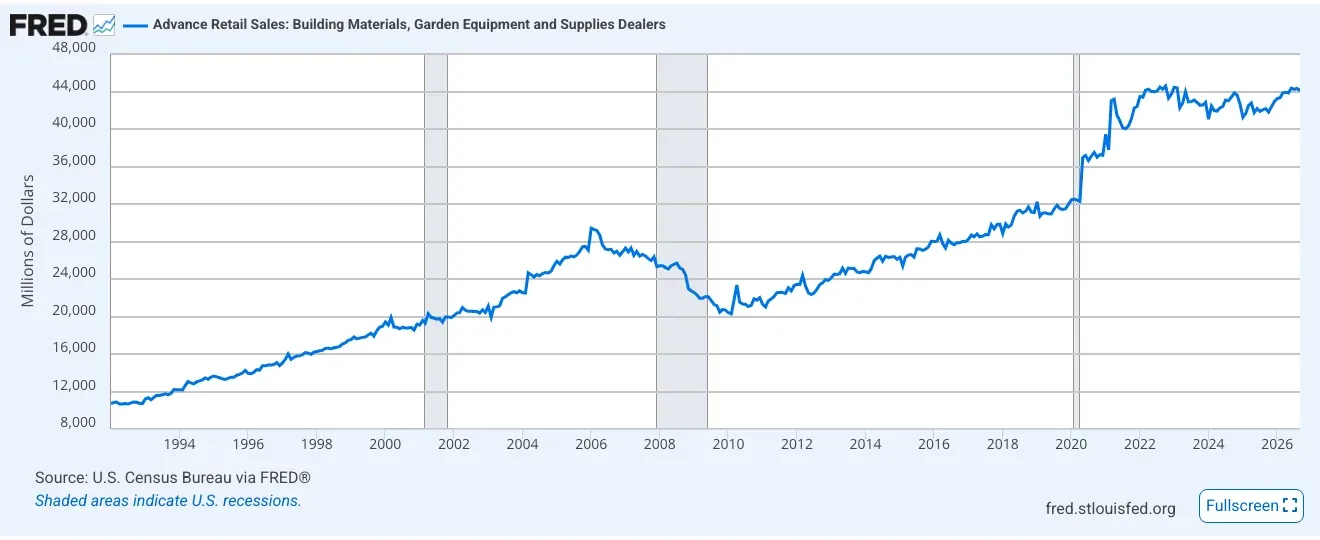 Figure 1: Monthly sales at US building material and garden equipment dealers grew from about $11 billion in 1992 to about $44 billion in September 2026, with a step up after 2020 that has held. Source: U.S. Census Bureau, Advance Retail Sales, retrieved from FRED, Sep 2026. Screenshot of the source page, captured 20 Oct 2026.
What do store sales say?
Store sales are the cleanest count of the market, and they show a jump in 2020 and 2021 that never reversed.
- Sales hit a peak of $527.4 billion in 2022 (Census Bureau, Monthly Retail Trade, Oct 2026).
- They slipped to $516.5 billion in 2023 (Census Bureau, Monthly Retail Trade, Oct 2026).
- They slipped again to $513.6 billion in 2024 (Census Bureau, Monthly Retail Trade, Oct 2026).
- In 2019, the year before the jump, sales were $376.2 billion (Census Bureau, Monthly Retail Trade, Oct 2026).
- Sales reached $428.8 billion in 2020 and $493.0 billion in 2021 (Census Bureau, Monthly Retail Trade, Oct 2026).
- Ten years earlier, in 2015, sales were $321.8 billion (Census Bureau, Monthly Retail Trade, Oct 2026).
- In 2010, after the housing bust, they were $258.3 billion (Census Bureau, Monthly Retail Trade, Oct 2026).
- The Census series starts in 1992 at $129.5 billion (Census Bureau, Monthly Retail Trade, Oct 2026).
How is 2026 tracking?
Sales are up this year, but only modestly, and the monthly figures are still being revised.
- Sales from January through August 2026 were $354.4 billion, against $339.1 billion a year earlier (Census Bureau, Monthly Retail Trade, Oct 2026).
- The seasonally adjusted advance estimate for September 2026 was $44.1 billion (Census Bureau via FRED, Oct 2026).
Which kinds of stores make up the total?
Building material and supply dealers carry most of the weight. Hardware and paint stores are small by comparison.
- Building material and supplies dealers sold $440.7 billion in 2025 (Census Bureau, Monthly Retail Trade, Oct 2026).
- Hardware stores sold $40.9 billion (Census Bureau, Monthly Retail Trade, Oct 2026).
- Paint and wallpaper stores sold $18.2 billion (Census Bureau, Monthly Retail Trade, Oct 2026).
How do trade groups and research firms size it?
Their totals differ because they count different things: all products or one store type.
- HIRI valued the home improvement products market at $526.5 billion in 2025 (HIRI, Jul 2026).
- HIRI says the consumer market is about 1.5 times the size of the professional market (HIRI, Jul 2026).
- IBISWorld puts revenue of home improvement stores at about $298.4 billion in 2026, up 0.3% (IBISWorld, May 2026).
- IBISWorld counts 5,090 businesses in that store group (IBISWorld, May 2026).
How many home improvement stores and retail workers are there?
The store base is large but has stopped growing. Retail employment jumped in 2020 and has drifted down since, even though sales stayed high.
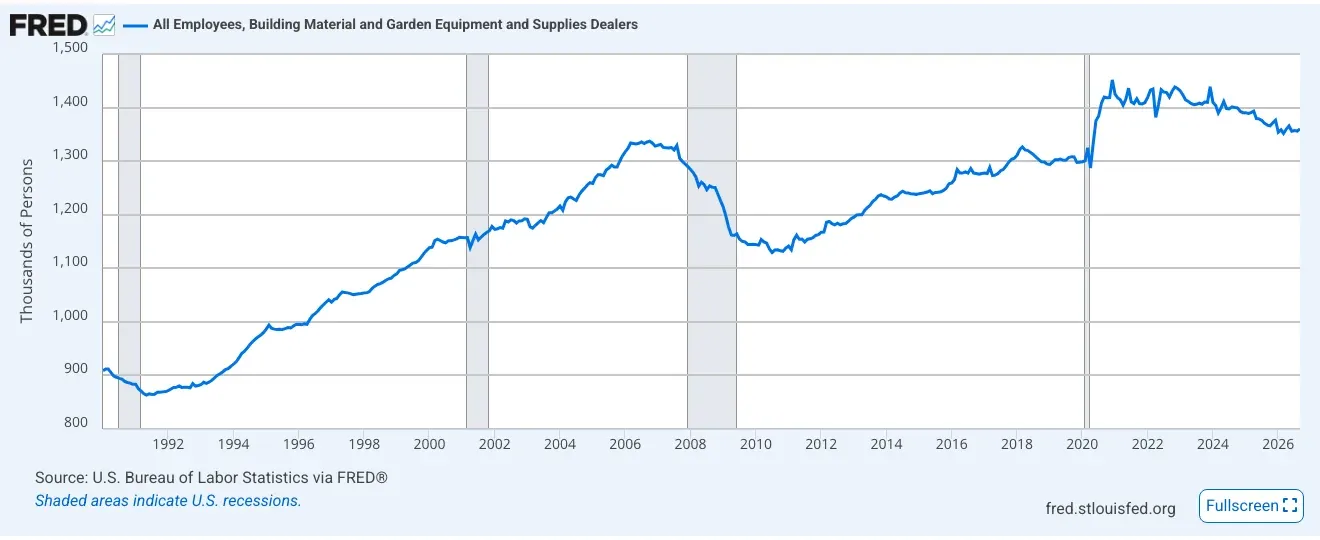 Figure 2: Retail employment at building material and garden equipment dealers jumped in 2020 and has eased since, while sales held near their peak. Source: U.S. Bureau of Labor Statistics, All Employees, Building Material and Garden Equipment and Supplies Dealers, retrieved from FRED, Sep 2026. Screenshot of the source page, captured 20 Oct 2026.
How many stores are there?
About 72,000 stores with paid staff sell building materials and garden supplies, and most are small.
- The Census Bureau counted 72,618 establishments in mid-March 2023 (Census Bureau, County Business Patterns, Jun 2025).
- 26,929 of them had fewer than five employees (Census Bureau, County Business Patterns, Jun 2025).
- There were 5,834 home centers, and 3,871 of them had 100 to 249 employees (Census Bureau, County Business Patterns, Jun 2025).
- Hardware stores numbered 15,694 (Census Bureau, County Business Patterns, Jun 2025).
- Paint and wallpaper stores numbered 7,284 (Census Bureau, County Business Patterns, Jun 2025).
- Other building material dealers, such as lumber yards and specialty suppliers, numbered 26,733 (Census Bureau, County Business Patterns, Jun 2025).
- Lawn and garden equipment and supply stores added 17,073 more (Census Bureau, County Business Patterns, Jun 2025).
- A separate count from BLS found 71,728 establishments in 2025, down 1.3% from a year earlier (BLS Quarterly Census of Employment and Wages, Aug 2026).
- Another 53,751 retail businesses in this group had no employees in 2024 and took in $5.4 billion (Census Bureau, Nonemployer Statistics, Sep 2026).
How many people work in these stores?
The workforce is about 1.4 million, and it has slipped since 2022 while pay has risen.
- Mid-March 2023 employment was 1,424,157 (Census Bureau, County Business Patterns, Jun 2025).
- Annual payroll for those workers was $55.4 billion (Census Bureau, County Business Patterns, Jun 2025).
- Home centers alone had 774,888 employees (Census Bureau, County Business Patterns, Jun 2025).
- Employment in 2025 averaged 1,370,263, down 1.1% from 2024 (BLS Quarterly Census of Employment and Wages, Aug 2026).
- Before the 2020 jump, employment stood at 1,298.1 thousand in December 2019 (BLS Current Employment Statistics, Oct 2026).
- Retail sales workers as a whole hold 4,271,400 jobs, and BLS expects no growth to 2035 (BLS Occupational Outlook Handbook, Aug 2026).
How much do these workers earn?
Pay at the register and on the floor is modest, and pay varies a lot by store type.
- Average hourly earnings at building material dealers were $23.98 in August 2026 (BLS Current Employment Statistics, Oct 2026).
- In August 2019 they were $18.74 (BLS Current Employment Statistics, Oct 2026).
- The average weekly hours were 30.0 in August 2026 (BLS Current Employment Statistics, Oct 2026).
- Across the group, average annual pay was $45,521 in 2025 (BLS Quarterly Census of Employment and Wages, Aug 2026).
- Home center pay averaged $37,587 on 728,472 jobs (BLS Quarterly Census of Employment and Wages, Aug 2026).
- Hardware store pay averaged $41,122 (BLS Quarterly Census of Employment and Wages, Aug 2026).
- Paint store pay averaged $60,556 (BLS Quarterly Census of Employment and Wages, Aug 2026).
- Other building material dealers paid the most, at $72,894 (BLS Quarterly Census of Employment and Wages, Aug 2026).
Who are the biggest home improvement retailers?
Two companies dominate, and a long tail of co-op stores and specialists fights for the rest. The big chains are also buying their way into the contractor supply business.
 Figure 3: The National Retail Federation ranks The Home Depot fifth and Lowe’s ninth among all US retailers by 2025 US sales, and notes that Ace and True Value each run more than twice as many stores as either giant. Source: National Retail Federation, 2026 Top 100 Retailers, Jul 2026. Screenshot of the source page, captured 20 Oct 2026.
How big are Home Depot and Lowe’s?
Together they sell close to $240 billion a year in the United States alone.
- Home Depot ranked fifth among all US retailers, with $154.74 billion in 2025 US sales (National Retail Federation, Jul 2026).
- Lowe’s ranked ninth, with $83.96 billion (National Retail Federation, Jul 2026).
- Ace Hardware and True Value each run more than twice as many stores as Lowe’s or Home Depot (National Retail Federation, Jul 2026).
- Home Depot reports it is the world’s largest home improvement retailer, with about 472,400 associates (Home Depot 10-K, Mar 2026).
- Its building materials lines sold $52.4 billion, its decor lines $51.7 billion and its hardlines $47.8 billion (Home Depot 10-K, Mar 2026).
- A typical Home Depot store stocks 30,000 to 40,000 items (Home Depot 10-K, Mar 2026).
- Lowe’s sold $86.3 billion in fiscal 2025 (Lowe’s 10-K, Mar 2026).
- It runs 1,759 stores with about 196 million square feet of selling space (Lowe’s 10-K, Mar 2026).
- It employs about 167,000 full-time and 109,000 part-time associates (Lowe’s 10-K, Mar 2026).
- Lowe’s serves about 16 million customer transactions a week (Lowe’s, Feb 2026).
Why are the big chains buying contractor suppliers?
They want more of the trade customer, who buys in larger orders and buys more often.
- Home Depot runs more than 1,250 SRS locations that serve roofing, landscape and pool contractors (Home Depot 10-K, Mar 2026).
- Sales from SRS, which Home Depot reports as other net sales, were $12.7 billion, up from $6.4 billion a year earlier (Home Depot 10-K, Mar 2026).
- Home Depot bought the drywall and ceiling distributor GMS for $110 a share, and the deal closed on September 4, 2025 (Home Depot 10-K, Mar 2026).
- Lowe’s paid $8.8 billion in cash for Foundation Building Materials on October 9, 2025 (Lowe’s 10-K, Mar 2026).
- Lowe’s now runs more than 540 branch locations that serve larger trade customers (Lowe’s 10-K, Mar 2026).
Who else matters?
Specialists and member-owned co-ops hold real share, and several are still adding stores.
- Floor & Decor sold $4,684.1 million in fiscal 2025, up 5.1% (Floor & Decor, Feb 2026).
- It ran 270 warehouse stores and five design studios in 39 states (Floor & Decor 10-K, Feb 2026).
- Its warehouse stores average about 76,000 square feet (Floor & Decor 10-K, Feb 2026).
- Sherwin-Williams Paint Stores Group sold $13.6 billion in 2025 (Sherwin-Williams 10-K, Feb 2026).
- It ran 4,853 stores across the United States, Canada and the Caribbean at the end of 2025 (Sherwin-Williams 10-K, Feb 2026).
- Ace Hardware had record 2025 revenue of $10.0 billion, up 5.8% in a 53-week year (Ace Hardware, Feb 2026).
- Ace added 180 domestic stores and lost 74, ending at 5,250 (Ace Hardware, Feb 2026).
- Do it Best and True Value together reported $4.88 billion in revenue for their 2025 fiscal year, up 6.1% (Do it Best, Oct 2025).
How much do suppliers depend on the big chains?
Many product makers sell a large part of their output to one or two retailers.
- Masco’s 2025 net sales were $7,562 million (Masco 10-K, Feb 2026).
- Sales to one customer were $2,859 million, and the filing names The Home Depot as Masco’s largest customer (Masco 10-K, Feb 2026).
- Lowe’s and Home Depot each took 11% of Fortune Brands’ 2025 net sales (Fortune Brands 10-K, Feb 2026).
- All US home centers together took about 26% of Fortune Brands’ sales (Fortune Brands 10-K, Feb 2026).
- Builders FirstSource, which supplies pro builders and remodelers, had $15.2 billion in sales across about 585 locations in 43 states (Builders FirstSource 10-K, Feb 2026).
Is retail growth coming from higher prices or more customers?
Prices, not traffic. Across the big chains, the average sale is rising while visits fall, and the trade group that tracks product sales says the growth in dollars is mostly inflation.
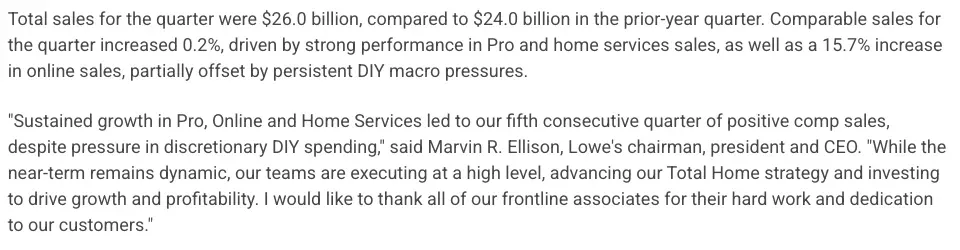 Figure 4: Lowe’s says its 2026 comparable sales gain came from Pro, home services and online orders, while do-it-yourself spending stayed weak. Source: Lowe’s, Second Quarter 2026 Sales and Earnings Results, Aug 2026. Screenshot of the source page, captured 20 Oct 2026.
Are shoppers visiting less often?
Yes. Each chain that reports both measures shows fewer transactions and a higher ticket.
- Home Depot’s comparable sales rose just 0.3% in fiscal 2025, and its comparable transactions fell 1.0% (Home Depot 10-K, Mar 2026).
- Lowe’s comparable sales rose 0.2% in fiscal 2025 (Lowe’s 10-K, Mar 2026).
- That came from a 3.0% rise in comparable average ticket, offset by a 2.8% drop in comparable transactions (Lowe’s 10-K, Mar 2026).
- At Ace, US same-store sales rose 0.2% in 2025 (Ace Hardware, Feb 2026).
- Ace’s average ticket rose 1.6% while same-store transactions fell 1.3% (Ace Hardware, Feb 2026).
- Floor & Decor’s comparable store sales fell 1.8% in fiscal 2025 (Floor & Decor, Feb 2026).
Where is the growth coming from in 2026?
Pro, online and service sales are carrying the chains. Do-it-yourself spending is the weak spot.
- Lowe’s second quarter sales were $26.0 billion, against $24.0 billion a year earlier (Lowe’s, Aug 2026).
- Comparable sales rose 0.2%, its fifth straight quarterly gain (Lowe’s, Aug 2026).
- Online sales rose 15.7% in the quarter (Lowe’s, Aug 2026).
- Home Depot’s second quarter comparable sales rose 1.7%, and the company said customers continued to take on smaller projects (Home Depot Q2 fiscal 2026 release, Aug 2026).
- Ace’s digital business grew 27% in 2025 (Ace Hardware, Feb 2026).
How much of the growth is just price?
Most of it. Makers and paint stores say price, not volume, lifted their sales.
- Sherwin-Williams said price increases added a mid-single-digit percentage to Paint Stores Group sales, partly offset by a low-single-digit drop in volume (Sherwin-Williams 10-K, Feb 2026).
- Same-store sales at open stores rose 1.7% (Sherwin-Williams 10-K, Feb 2026).
- Masco’s volume fell 4% in 2025, while higher plumbing prices added 2% (Masco 10-K, Feb 2026).
- Builders FirstSource saw core organic sales drop 10.3%, which it blamed on a below-normal starts environment (Builders FirstSource 10-K, Feb 2026).
- HIRI says the rise in dollars spent on many product categories is entirely driven by inflation, and that real product growth is falling in almost every major category (HIRI, Jul 2026).
A shop that sells repairs and installs faces the same squeeze. Parts and materials cost more each month, and a customer who is visiting less often compares every quote. A price book that updates costs in one place keeps the quote honest.
How many home improvement contractors are there?
Remodelers are now the largest group of firms in residential building, and most are very small. Counting them depends on whether you include firms with no employees, and that choice changes the answer a lot.
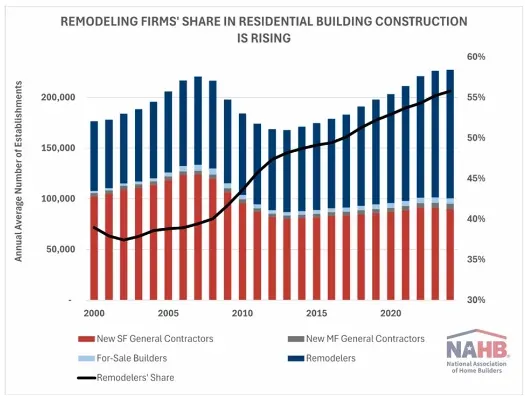 Figure 5: Remodelers grew from under 40% of residential building construction companies in 2000 to about 56% in 2025, and they now outnumber home builders. Source: National Association of Home Builders, Remodeling Gaining Larger Share of Residential Construction Market, Nov 2025. Chart published by the source, captured 20 Oct 2026.
What share of residential builders are remodelers?
More than half. The shift is structural, not a short pandemic bump.
- Remodelers are now 56% of all residential building construction companies (NAHB, Nov 2025).
- During the mid-2000s housing boom their share held near 38% to 39% (NAHB, Nov 2025).
- Between 2007 and 2012 the number of remodeling establishments fell 8%, while about one-third of home builders went out of business (NAHB, Nov 2025).
- Remodelers reached 46% of residential building firms in 2011 and 54% by 2022 (NAHB, Nov 2025).
How many remodelers have paid staff?
About 130,000, and four in five have fewer than five employees.
- BLS counted 128,815 residential remodeler establishments in 2025, up 1.6% from 2024 (BLS Quarterly Census of Employment and Wages, Aug 2026).
- Of the 135,337 Census establishments, 109,661 had fewer than five employees (Census Bureau, County Business Patterns, Jun 2025).
- 15,730 had five to nine employees (Census Bureau, County Business Patterns, Jun 2025).
- 6,723 had 10 to 19 (Census Bureau, County Business Patterns, Jun 2025).
- 2,600 had 20 to 49 (Census Bureau, County Business Patterns, Jun 2025).
- Only 463 had 50 to 99 employees (Census Bureau, County Business Patterns, Jun 2025).
- All residential building construction, including new-home builders, totaled 212,178 establishments (Census Bureau, County Business Patterns, Jun 2025).
How many trade contractors work on homes?
Finishing and specialty trades make up hundreds of thousands of establishments.
- All specialty trade contractor establishments totaled 521,315 (Census Bureau, County Business Patterns, Jun 2025).
- Painting and wall covering contractors numbered 38,280 (Census Bureau, County Business Patterns, Jun 2025).
- Finish carpentry contractors numbered 32,219 (Census Bureau, County Business Patterns, Jun 2025).
- Drywall and insulation contractors numbered 20,760 (Census Bureau, County Business Patterns, Jun 2025).
- Flooring contractors numbered 17,989 (Census Bureau, County Business Patterns, Jun 2025).
- Tile and terrazzo contractors numbered 10,685 (Census Bureau, County Business Patterns, Jun 2025).
- Siding contractors numbered 9,142 (Census Bureau, County Business Patterns, Jun 2025).
- Glass and glazing contractors numbered 6,945 (Census Bureau, County Business Patterns, Jun 2025).
How many one-person firms are there?
Far more than firms with staff. Solo operators outnumber employers by a wide margin.
- 317,990 foundation, structure and exterior contractors had no employees and took in $27.5 billion (Census Bureau, Nonemployer Statistics, Sep 2026).
- 385,453 building equipment contractors had no employees and took in $26.7 billion (Census Bureau, Nonemployer Statistics, Sep 2026).
- 605,015 other specialty trade firms had no employees and took in $44.7 billion (Census Bureau, Nonemployer Statistics, Sep 2026).
How big is a typical remodeling company?
Small. A typical NAHB remodeler has about five employees and a few million dollars in revenue.
- 21% of NAHB builder members listed residential remodeling as their primary business in 2025 (NAHB, Sep 2026).
- Their median annual revenue was $2.1 million, up 24% from $1.7 million in 2024 (NAHB, Sep 2026).
- The median firm had five payroll employees (NAHB Eye on Housing, Sep 2026).
- 23% reported less than $500,000 in revenue, and 52% reported $1.0 million to $4.9 million (NAHB, Sep 2026).
- The median remodeler finished eight jobs costing $10,000 or more in 2025, and the average was 19 (NAHB, Sep 2026).
- That is far below the $45.0 million revenue line the Small Business Administration uses to call a construction firm small (NAHB Eye on Housing, Sep 2026).
How many people work in home improvement trades?
The trades behind home improvement employ millions, and the biggest gains since 2019 are in residential building and specialty trades. Finishing trades have not recovered their pre-2020 headcount.
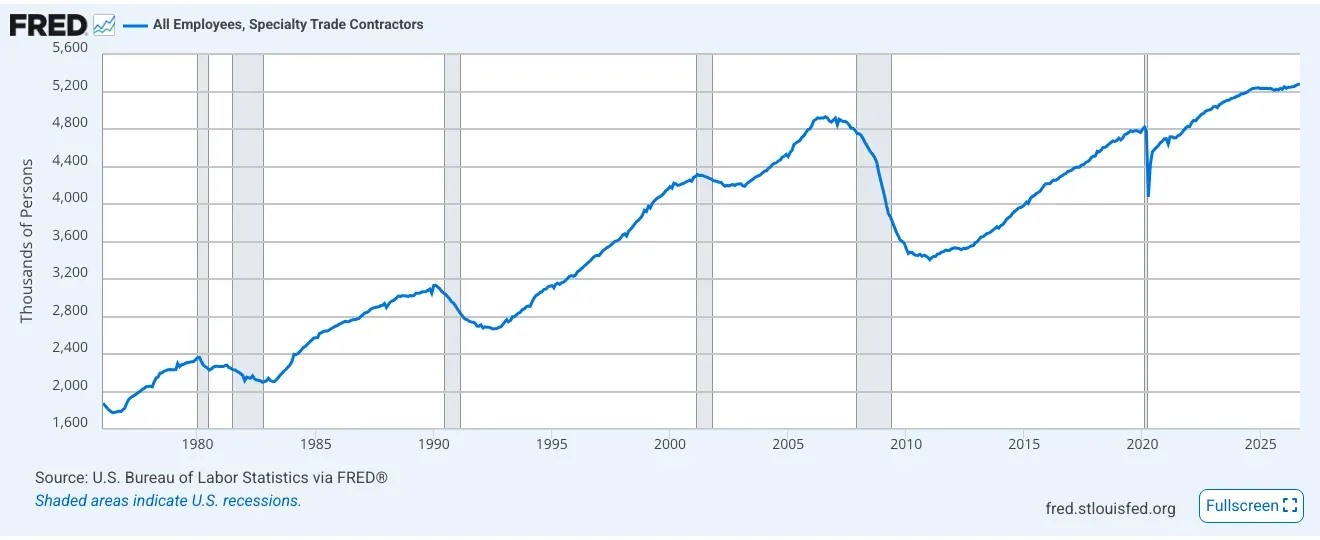 Figure 6: Specialty trade contractors, the firms that do most of the installation and finishing work in buildings, now employ more people than at any point in the series. Source: U.S. Bureau of Labor Statistics, All Employees, Specialty Trade Contractors, retrieved from FRED, Sep 2026. Screenshot of the source page, captured 20 Oct 2026.
How many jobs does the industry hold?
Specialty trades alone hold more than five million jobs.
- Specialty trade contractors employed 5,279.9 thousand people in September 2026 (BLS Current Employment Statistics, Oct 2026).
- In December 2019 the figure was 4,761.8 thousand (BLS Current Employment Statistics, Oct 2026).
- Residential building construction employed 922.7 thousand in September 2026, against 827.0 thousand in December 2019 (BLS Current Employment Statistics, Oct 2026).
- Building finishing contractors, the group that does drywall, paint, floors and tile, employed 826.9 thousand in August 2026 (BLS Current Employment Statistics, Oct 2026).
- That is below the 848.2 thousand of December 2019 (BLS Current Employment Statistics, Oct 2026).
- All construction employed 8,364 thousand in September 2026 (BLS Current Employment Statistics, Oct 2026).
How many people work for remodelers and trade firms?
Employers in residential remodeling alone hold about half a million jobs.
- Residential remodelers had 480,272 employees in mid-March 2023 (Census Bureau, County Business Patterns, Jun 2025).
- Their annual payroll was $27.4 billion (Census Bureau, County Business Patterns, Jun 2025).
- In 2025 the average annual pay was $64,356 on 458,999 jobs, up 0.7% (BLS Quarterly Census of Employment and Wages, Aug 2026).
- All residential building construction paid an average of $78,553 on 928,939 jobs (BLS Quarterly Census of Employment and Wages, Aug 2026).
- All specialty trade contractors had 4,986,759 employees in mid-March 2023 (Census Bureau, County Business Patterns, Jun 2025).
- Drywall and insulation firms employed 250,758 (Census Bureau, County Business Patterns, Jun 2025).
- Painting and wall covering firms employed 208,201 (Census Bureau, County Business Patterns, Jun 2025).
- Finish carpentry firms employed 177,042 (Census Bureau, County Business Patterns, Jun 2025).
- Flooring firms employed 84,998 (Census Bureau, County Business Patterns, Jun 2025).
- Tile and terrazzo firms employed 58,611 (Census Bureau, County Business Patterns, Jun 2025).
Which jobs are growing?
Most home improvement trades are projected to add jobs through 2035, with construction managers growing fastest.
- Carpenters hold 889,700 jobs, and BLS projects 4% growth, or 35,000 more jobs (BLS Occupational Outlook Handbook, Aug 2026).
- Construction and maintenance painters hold 326,900 jobs, with 3% growth projected (BLS Occupational Outlook Handbook, Aug 2026).
- Construction managers hold 609,100 jobs, with 9% growth, or 55,200 more jobs (BLS Occupational Outlook Handbook, Aug 2026).
- Insulation workers hold 71,900 jobs, with 3% growth projected (BLS Occupational Outlook Handbook, Aug 2026).
- Glaziers hold 59,200 jobs, with 2% growth projected (BLS Occupational Outlook Handbook, Aug 2026).
What do these jobs pay?
Median pay runs from the mid $40,000s for laborers and painters to above $114,000 for managers.
- Construction managers earned a median $114,990 in 2025 (BLS Occupational Outlook Handbook, Aug 2026).
- Carpenters earned a median $60,580 (BLS Occupational Outlook Handbook, Aug 2026).
- Painters earned a median $49,400 (BLS Occupational Outlook Handbook, Aug 2026).
- Construction laborers and helpers earned a median $46,680 (BLS Occupational Outlook Handbook, Aug 2026).
What are remodelers seeing in demand right now?
Remodelers say business is good but slow to close. Sentiment is steady, leads are thin, and customers hesitate over cost, so each quote matters more.
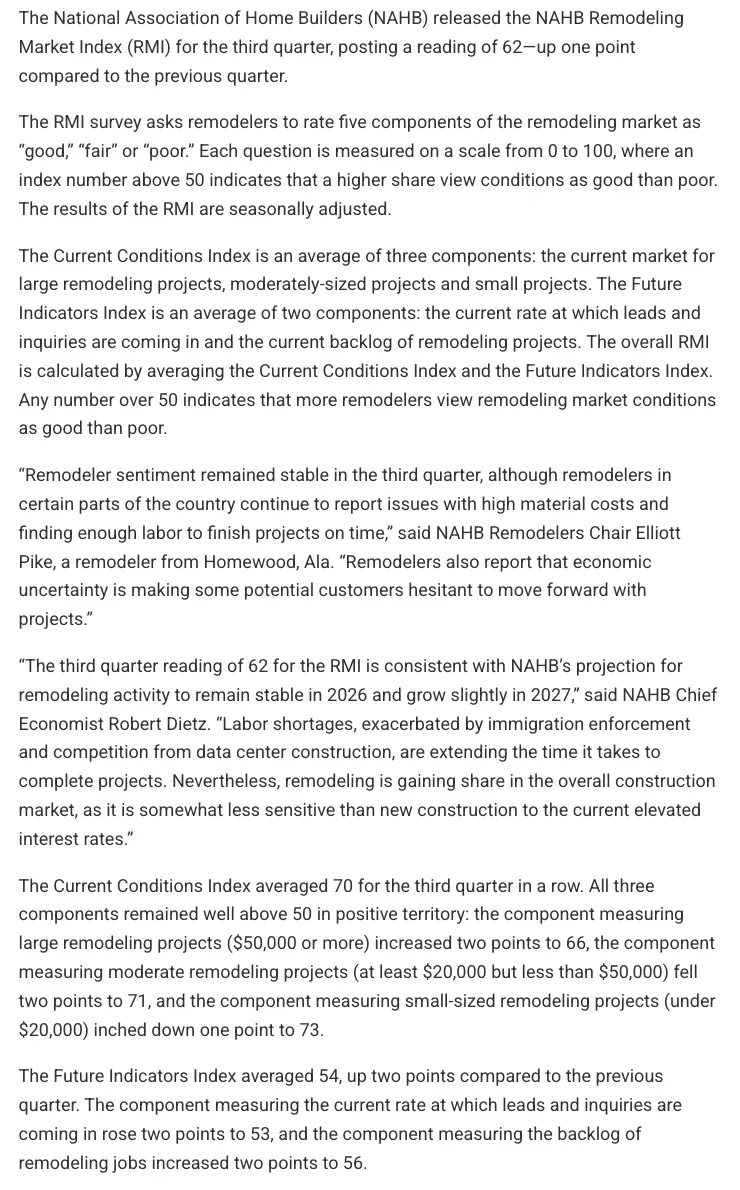 Figure 7: Remodelers rate current conditions well above the break-even mark of 50 but rate new leads and backlog much lower, and they report material costs, labor and hesitant customers as headwinds. Source: National Association of Home Builders, Remodeling Market Index, third quarter 2026, Oct 2026. Screenshot of the source page, captured 20 Oct 2026.
How do remodelers rate current conditions?
Well above break-even, and steady for three quarters.
- The Current Conditions Index averaged 70 for the third quarter in a row (NAHB, Oct 2026).
- The market for large projects of $50,000 or more rose two points to 66 (NAHB, Oct 2026).
- Moderate projects of $20,000 to $50,000 fell two points to 71 (NAHB, Oct 2026).
- Small projects under $20,000 slipped one point to 73 (NAHB, Oct 2026).
- The index has stayed above 50 for 24 straight quarters as of February 2026 (NAHB, Feb 2026).
Is the pipeline filling?
Only slowly. Leads and backlog sit much closer to 50 than current conditions do.
- The Future Indicators Index averaged 54, up two points (NAHB, Oct 2026).
- The rate of new leads and inquiries rose two points to 53 (NAHB, Oct 2026).
- The backlog of remodeling jobs rose two points to 56 (NAHB, Oct 2026).
What is holding remodelers back?
Material costs above all. NAHB’s chair said remodelers in some regions report high material costs (NAHB, Oct 2026).
- Remodeling is still gaining share of the construction market because it is somewhat less sensitive than new building to high interest rates (NAHB, Oct 2026).
When costs move and customers wait, the quote is where margin is won or lost. A price that was right in June can be wrong by the time a hesitant customer says yes in October. Written quotes that carry today’s parts and labor costs, and an invoice that goes out the day the job ends, protect the margin the market is trying to take away.
What work are remodelers adding?
Work for older owners is a steady source of jobs.
- 56% of remodelers do aging-in-place work (NAHB, Feb 2026).
- 73% say requests for aging-in-place features have risen over five years (NAHB, Feb 2026).
What is the growth outlook for home improvement?
Slow growth, with real risk to the downside. The chains and forecasters expect small gains in 2026 and a better 2027, but the housing market is still the brake.
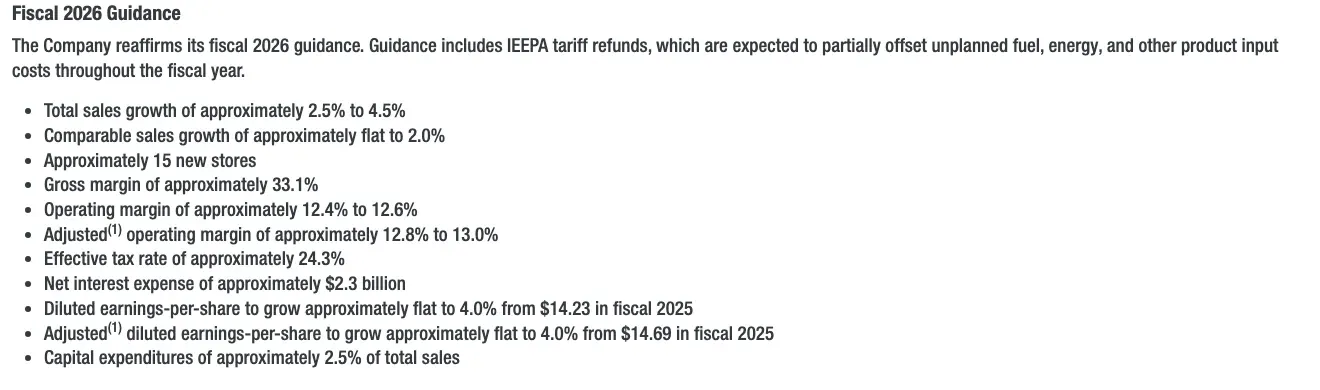 Figure 8: Home Depot reaffirmed in August 2026 that it expects sales to grow 2.5% to 4.5% in fiscal 2026 and comparable sales to be flat to up 2.0%, with about 15 new stores. Source: The Home Depot, Second Quarter Fiscal 2026 Results, Aug 2026. Screenshot of the source page, captured 20 Oct 2026.
What are the retailers guiding to?
Flat to low single digits, with a lowered forecast at Lowe’s.
- Home Depot expects total sales to grow 2.5% to 4.5% in fiscal 2026 (Home Depot Q2 fiscal 2026 release, Aug 2026).
- It expects comparable sales to be flat to up 2.0% and about 15 new stores (Home Depot Q2 fiscal 2026 release, Aug 2026).
- Its second quarter sales were $47.9 billion, up 5.7% (Home Depot Q2 fiscal 2026 release, Aug 2026).
- Lowe’s earlier planned sales of $92.0 to $94.0 billion and comparable sales of flat to up 2% (Lowe’s, Feb 2026).
- Sherwin-Williams plans 80 to 100 new stores in 2026 (Sherwin-Williams 10-K, Feb 2026).
- Floor & Decor plans to open 20 new warehouse stores (Floor & Decor, Feb 2026).
What do forecasters expect?
Modest growth in 2026 and 2027, led by the consumer side in 2026 and by pros in 2027.
- HIRI projects the total market to grow 2.6% in 2026 and 3.8% in 2027 (HIRI, Jul 2026).
- It expects the professional market to grow just 1% in 2026, then 3.9% in 2027 (HIRI, Jul 2026).
- It sees professional growth averaging 4.2% a year from 2027 to 2030 (HIRI, Jul 2026).
- It expects consumer sales to rise 3.7% in 2026 to $325.16 billion (HIRI, Jul 2026).
- NAHB forecast in February that inflation-adjusted remodeling would rise 3% in 2026 and 2% in 2027 (NAHB, Feb 2026).
- By October NAHB’s economist said it expected remodeling to stay stable in 2026 and grow slightly in 2027 (NAHB, Oct 2026).
Are home sales helping?
Not yet. The housing market is the main brake on bigger projects.
- Existing-home sales ran at a seasonally adjusted annual rate of 3.99 million in September 2026, down 2.2% from a year earlier (National Association of Realtors, Oct 2026).
- The median existing-home price was $417,500, the 39th straight month of year-over-year gains (National Association of Realtors, Oct 2026).
- Housing inventory reached 1.60 million units, a 4.8-month supply (National Association of Realtors, Oct 2026).
How does the US home improvement market compare with other countries?
The same pressures show up abroad: trade customers and online orders grow, while shoppers buy less often. The US chains also operate well beyond US borders.
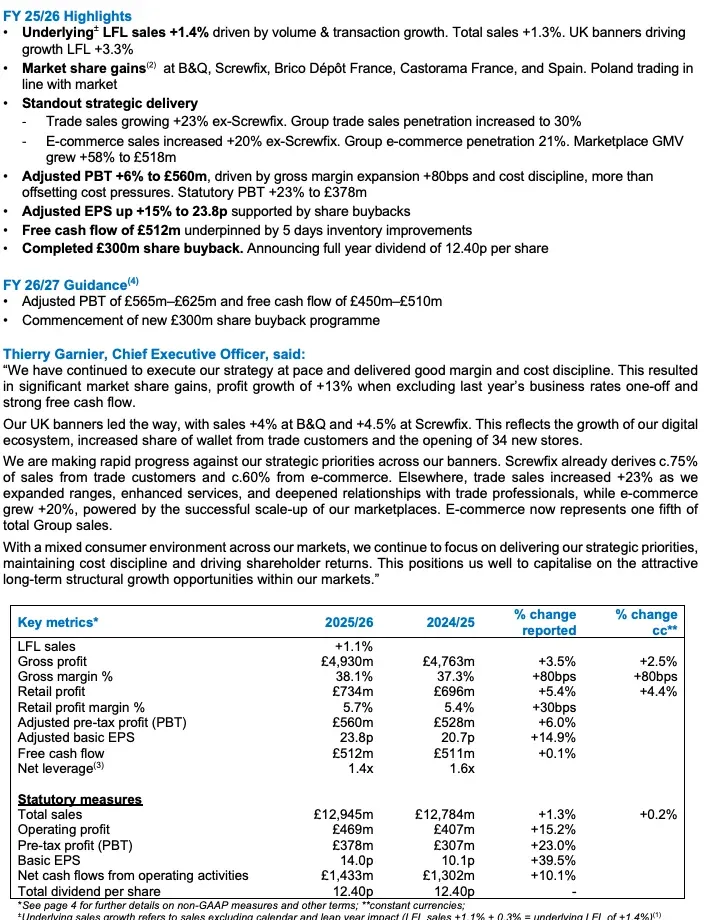 Figure 9: Kingfisher, the owner of B&Q and Screwfix, grew total sales 1.3% in the year to January 2026 while trade and online sales gained share. Source: Kingfisher plc, Full year results for the year ended 31 January 2026, Mar 2026. Screenshot of the source page, captured 20 Oct 2026.
How is Kingfisher doing in Europe?
Steady, with trade and online carrying the growth.
- Kingfisher’s total sales were £12,945 million in the year to January 2026 (Kingfisher, Mar 2026).
- Like-for-like sales rose 1.1% (Kingfisher, Mar 2026).
- The group ran 1,691 stores after a net 41 openings (Kingfisher, Mar 2026).
- E-commerce was 21% of group sales (Kingfisher, Mar 2026).
- Screwfix drew about 75% of its sales from trade customers (Kingfisher, Mar 2026).
- Retail profit was £734 million (Kingfisher, Mar 2026).
- In the first quarter of 2026/27 underlying like-for-like sales fell 0.7% (Kingfisher, May 2026).
How is Bunnings doing in Australia and New Zealand?
Growing, with higher revenue and earnings.
- Bunnings Group revenue was A$20,399 million in the 2026 financial year, against A$19,595 million a year earlier (Wesfarmers, Aug 2026).
- Earnings before tax were A$2,455 million (Wesfarmers, Aug 2026).
- Digital sales rose 7.6% (Wesfarmers, Aug 2026).
How far do US chains reach into Canada and Mexico?
Home Depot runs stores in both countries, and Sherwin-Williams has stores in Canada.
- Home Depot ran 2,035 stores in the United States (Home Depot 10-K, Mar 2026).
- It ran 182 in Canada and 142 in Mexico (Home Depot 10-K, Mar 2026).
- It employed 31,700 people in Canada and 17,800 in Mexico (Home Depot 10-K, Mar 2026).
- Sherwin-Williams’ Canada Division operated 263 paint stores (Sherwin-Williams 10-K, Feb 2026).
Methodology and Sources
We chose each figure because it came straight from the agency, company or research group that produced it. We did not use roundups or pages that repeat other pages. Store and contractor counts come from Census Bureau and Bureau of Labor Statistics files, retail results come from company filings and releases, and forecasts come from named trade and research groups. Where sources size the market differently, we attribute each number to its source and do not blend them. We recheck links and refresh the page every month. For related numbers, see home improvement spending and projects, home remodeling, construction, home services and the HVAC industry.
Glossary
- BLS: Bureau of Labor Statistics, the US agency that counts jobs, pay and prices.
- CBP: County Business Patterns, a Census Bureau count of employer establishments, workers and payroll.
- Comparable sales (comps): Sales at stores open long enough to compare with the same period a year earlier.
- DIY: Do it yourself, meaning homeowners who do their own projects.
- FBM: Foundation Building Materials, a wall and ceiling distributor Lowe’s bought in 2025.
- HIRI: Home Improvement Research Institute, a trade research group.
- NAHB: National Association of Home Builders.
- NAICS: North American Industry Classification System, the code system for industries.
- Nonemployer firm: A business with no paid employees, such as a solo contractor.
- Pro: A professional customer such as a contractor, remodeler or tradesperson.
- QCEW: Quarterly Census of Employment and Wages, a BLS count of establishments and pay.
- RMI: Remodeling Market Index, NAHB’s survey of remodelers. A reading of 50 is break-even.
- SRS: A roofing, landscape and pool supply distributor owned by Home Depot.
Sources
- Ace Hardware
- BLS Current Employment Statistics
- BLS Current Employment Statistics
- BLS Current Employment Statistics
- BLS Current Employment Statistics
- BLS Current Employment Statistics
- BLS Current Employment Statistics
- BLS Current Employment Statistics
- BLS Occupational Outlook Handbook
- BLS Occupational Outlook Handbook
- BLS Occupational Outlook Handbook
- BLS Occupational Outlook Handbook
- BLS Occupational Outlook Handbook
- BLS Occupational Outlook Handbook
- BLS Occupational Outlook Handbook
- BLS Quarterly Census of Employment and Wages
- BLS Quarterly Census of Employment and Wages
- BLS Quarterly Census of Employment and Wages
- BLS Quarterly Census of Employment and Wages
- BLS Quarterly Census of Employment and Wages
- BLS Quarterly Census of Employment and Wages
- BLS Quarterly Census of Employment and Wages
- Builders FirstSource 10-K
- Census Bureau via FRED
- Census Bureau, County Business Patterns
- Census Bureau, Monthly Retail Trade
- Census Bureau, Nonemployer Statistics
- Do it Best
- Floor & Decor
- Floor & Decor 10-K
- Fortune Brands 10-K
- HIRI
- Home Depot 10-K
- Home Depot Q2 fiscal 2026 release
- IBISWorld
- Kingfisher
- Kingfisher
- Lowe’s
- Lowe’s
- Lowe’s 10-K
- Masco 10-K
- NAHB
- NAHB
- NAHB
- NAHB
- NAHB Eye on Housing
- National Association of Realtors
- National Retail Federation
- Sherwin-Williams 10-K
- U.S. Bureau of Labor Statistics, All Employees, Building Material and Garden Equipment and Supplies Dealers, retrieved from FRED
- U.S. Bureau of Labor Statistics, All Employees, Specialty Trade Contractors, retrieved from FRED
- Wesfarmers