HVAC industry statistics tell one story again and again. The trade is big, the shops are small, and the work follows the weather, the housing market and the rules. This page collects the numbers from the groups that produced them, such as the Census Bureau, the Bureau of Labor Statistics, the Energy Information Administration, AHRI, public company reports, the EPA, Statistics Canada and the IEA.
Every number links to its source and carries a date. We do not cite roundups. When two sources measure different things, we say so. Many Census counts include plumbing, because the government groups plumbing, heating and air-conditioning contractors into one code.
The newest equipment data runs through August 2026. The newest company results cover the second quarter of 2026. The page is updated monthly.
For the field side of the trade, hvacloadcalculator.app sizes heating and cooling equipment for a home, and wiregaugecalc.com gives the wire size for the circuit that feeds it. The same load check runs on site in the free HVAC Load Calculator: Manual J iPhone app.
Key Takeaways
- HVAC contracting alone brought in $121.7 billion in 2022. It is the largest line of work inside the combined plumbing, heating and air-conditioning industry. (Census Bureau, Economic Census 2022 (construction), Dec 2025)
- Employer shops in this industry had 1,176,759 paid employees in 2022. (Census Bureau, County Business Patterns 2022, Dec 2024)
- Only about one employer shop in four had 10 or more employees in 2023. This is our sum of the Census size classes. (Census Bureau, County Business Patterns 2023, Jun 2025)
- Central air conditioner and heat pump shipments fell 20.0% in 2025, to 7,749,529 units. (AHRI, December 2025 shipment release, Feb 2026)
- Heat pumps out-shipped gas furnaces in 2025, 3,644,596 units to 3,247,426. (AHRI, December 2025 shipment release, Feb 2026)
- 88% of US households used air conditioning in 2020. (EIA, Nearly 90% of U.S. households used air conditioning in 2020, May 2022)
- 23.54 million US homes had main heating equipment that was 20 years old or more in 2020. (EIA, RECS 2020 table HC6.1, Mar 2023)
- 42% of US households heated mainly with electricity in 2024, up from 35% in 2010. (EIA, Electricity use is becoming more common for residential heating, Oct 2025)
- Producer prices for air-conditioning and heating equipment are about 60% higher than in January 2020. This is our calculation from the index. (BLS, Producer Price Index for air-conditioning and heating equipment (via FRED), Oct 2026)
- Trane ended the second quarter of 2026 with a record backlog of $12.1 billion, up 70%. (Trane Technologies, second-quarter 2026 results, Jul 2026)
- In the same quarter, Lennox home comfort revenue fell 7% while its commercial segment grew 24%. (Lennox, second-quarter 2026 results, Jul 2026)
- The AIM Act cuts the US supply of HFC refrigerants by 85% by 2036. (EPA, HFC phasedown questions and answers, Sep 2026)
- Canada had 16,754 plumbing, heating and air-conditioning employer businesses in June 2026. (Statistics Canada, Canadian Business Counts with employees, June 2026, Aug 2026)
How big is the HVAC contractor industry?
Heating and cooling is the biggest line of work inside a Census industry that also holds plumbing. The combined totals for that industry are on our plumbing industry page. This section looks at the HVAC cuts, at the wider construction market and at the firms that make and sell the equipment.
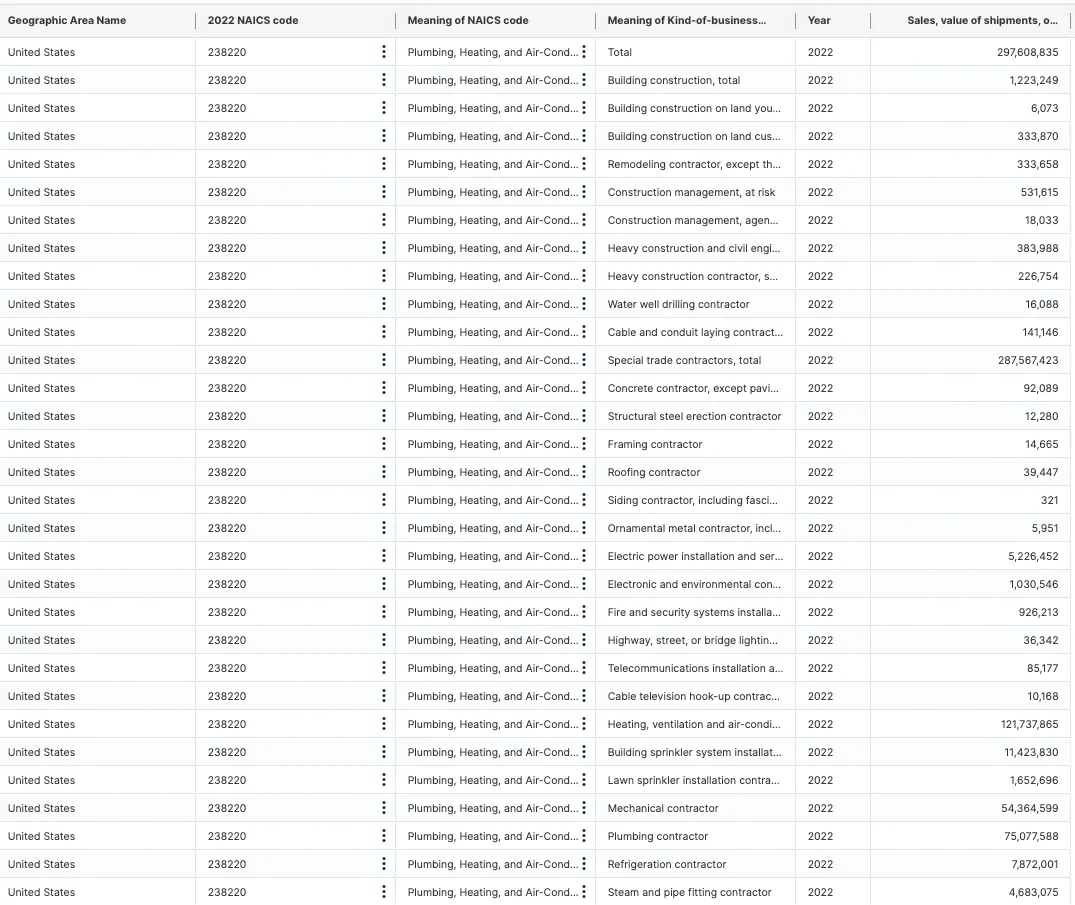 Figure 1: The Census kind-of-business table splits contractor sales by type of work. The heating, ventilation and air-conditioning row is the largest single trade line in it, ahead of plumbing, mechanical and refrigeration work. Source: Census Bureau, Economic Census 2022 (construction), Dec 2025. Screenshot of the source page, captured 20 Oct 2026.
Which kinds of work bring in the most money?
Refrigeration contracting brought in $7.9 billion in 2022, a separate line from comfort cooling (Census Bureau, Economic Census 2022 (construction), Dec 2025). These lines count the kind of work done, so they can include work by firms in other codes.
- Insulation work on boilers, pipes and ducts brought in $2.3 billion (Census Bureau, Economic Census 2022 (construction), Dec 2025).
- Installing electronic and environmental control systems brought in $1.0 billion (Census Bureau, Economic Census 2022 (construction), Dec 2025).
- Special trade contracting made up $287.6 billion of the combined industry’s sales (Census Bureau, Economic Census 2022 (construction), Dec 2025).
How big is the construction market around it?
All construction took in $2.92 trillion in 2022 (Census Bureau, Economic Census 2022 (construction), Dec 2025).
- All specialty trade contractors took in $1.28 trillion (Census Bureau, Economic Census 2022 (construction), Dec 2025).
- Building equipment contractors, the group that holds HVAC, plumbing and electrical, took in $589.3 billion (Census Bureau, Economic Census 2022 (construction), Dec 2025).
How big are the equipment makers and distributors?
Factories that make air-conditioning and warm air heating equipment shipped $40.2 billion from 874 plants in 2022 (Census Bureau, Economic Census 2022 (manufacturing), May 2025).
- Those plants employed 104,014 people (Census Bureau, Economic Census 2022 (manufacturing), May 2025).
- Wholesalers of warm air heating and air-conditioning equipment sold $96.6 billion from 6,856 locations (Census Bureau, Economic Census 2022 (wholesale), Jul 2025).
- Those wholesalers employed 90,928 people (Census Bureau, Economic Census 2022 (wholesale), Jul 2025).
How many HVAC shops are there, and how big are they?
The usual HVAC business is a small crew with a few trucks. The count of shops and jobs has grown for years, and small shops still dominate. The labor side is covered in our skilled trade shortage statistics.
 Figure 2: The Census profile for this industry shows the 2023 employer count that every size figure in this section builds on, and small shops make up most of it. Source: Census Bureau, County Business Patterns 2023, Jun 2025. Screenshot of the source page, captured 20 Oct 2026.
How many HVAC and plumbing shops and workers are there?
Employer establishments numbered 109,601 in 2022 (Census Bureau, County Business Patterns 2022, Dec 2024).
- They numbered 103,359 in 2019 (Census Bureau, County Business Patterns 2019, Dec 2024).
- Paid employment in 2019 was 1,099,138 (Census Bureau, County Business Patterns 2019, Dec 2024).
- The 2022 Economic Census counted 1,169,692 paid employees, using its own survey (Census Bureau, Economic Census 2022 (construction), Dec 2025).
- 93,416 establishments were open for the whole of 2022 (Census Bureau, Economic Census 2022 (construction), Dec 2025).
- Another 21,011 were not, a sign of how often shops start and stop (Census Bureau, Economic Census 2022 (construction), Dec 2025).
How many HVAC shops have 10 workers or more?
13,148 shops had 10 to 19 employees in 2023 (Census Bureau, County Business Patterns 2023, Jun 2025).
- 2,561 shops had 50 to 99 employees (Census Bureau, County Business Patterns 2023, Jun 2025).
- 256 shops had 250 to 499 employees (Census Bureau, County Business Patterns 2023, Jun 2025).
- 76 shops had 500 to 999 employees (Census Bureau, County Business Patterns 2023, Jun 2025).
- In the 2022 Economic Census, 49,926 establishments open all year had fewer than 5 employees (Census Bureau, Economic Census 2022 (construction), Dec 2025).
How many air conditioners, heat pumps and furnaces ship each year?
Shipments are the loudest signal in the trade. They swing with refrigerant rules, weather and housing, and 2025 was a sharp drop after a pull-forward in 2024.
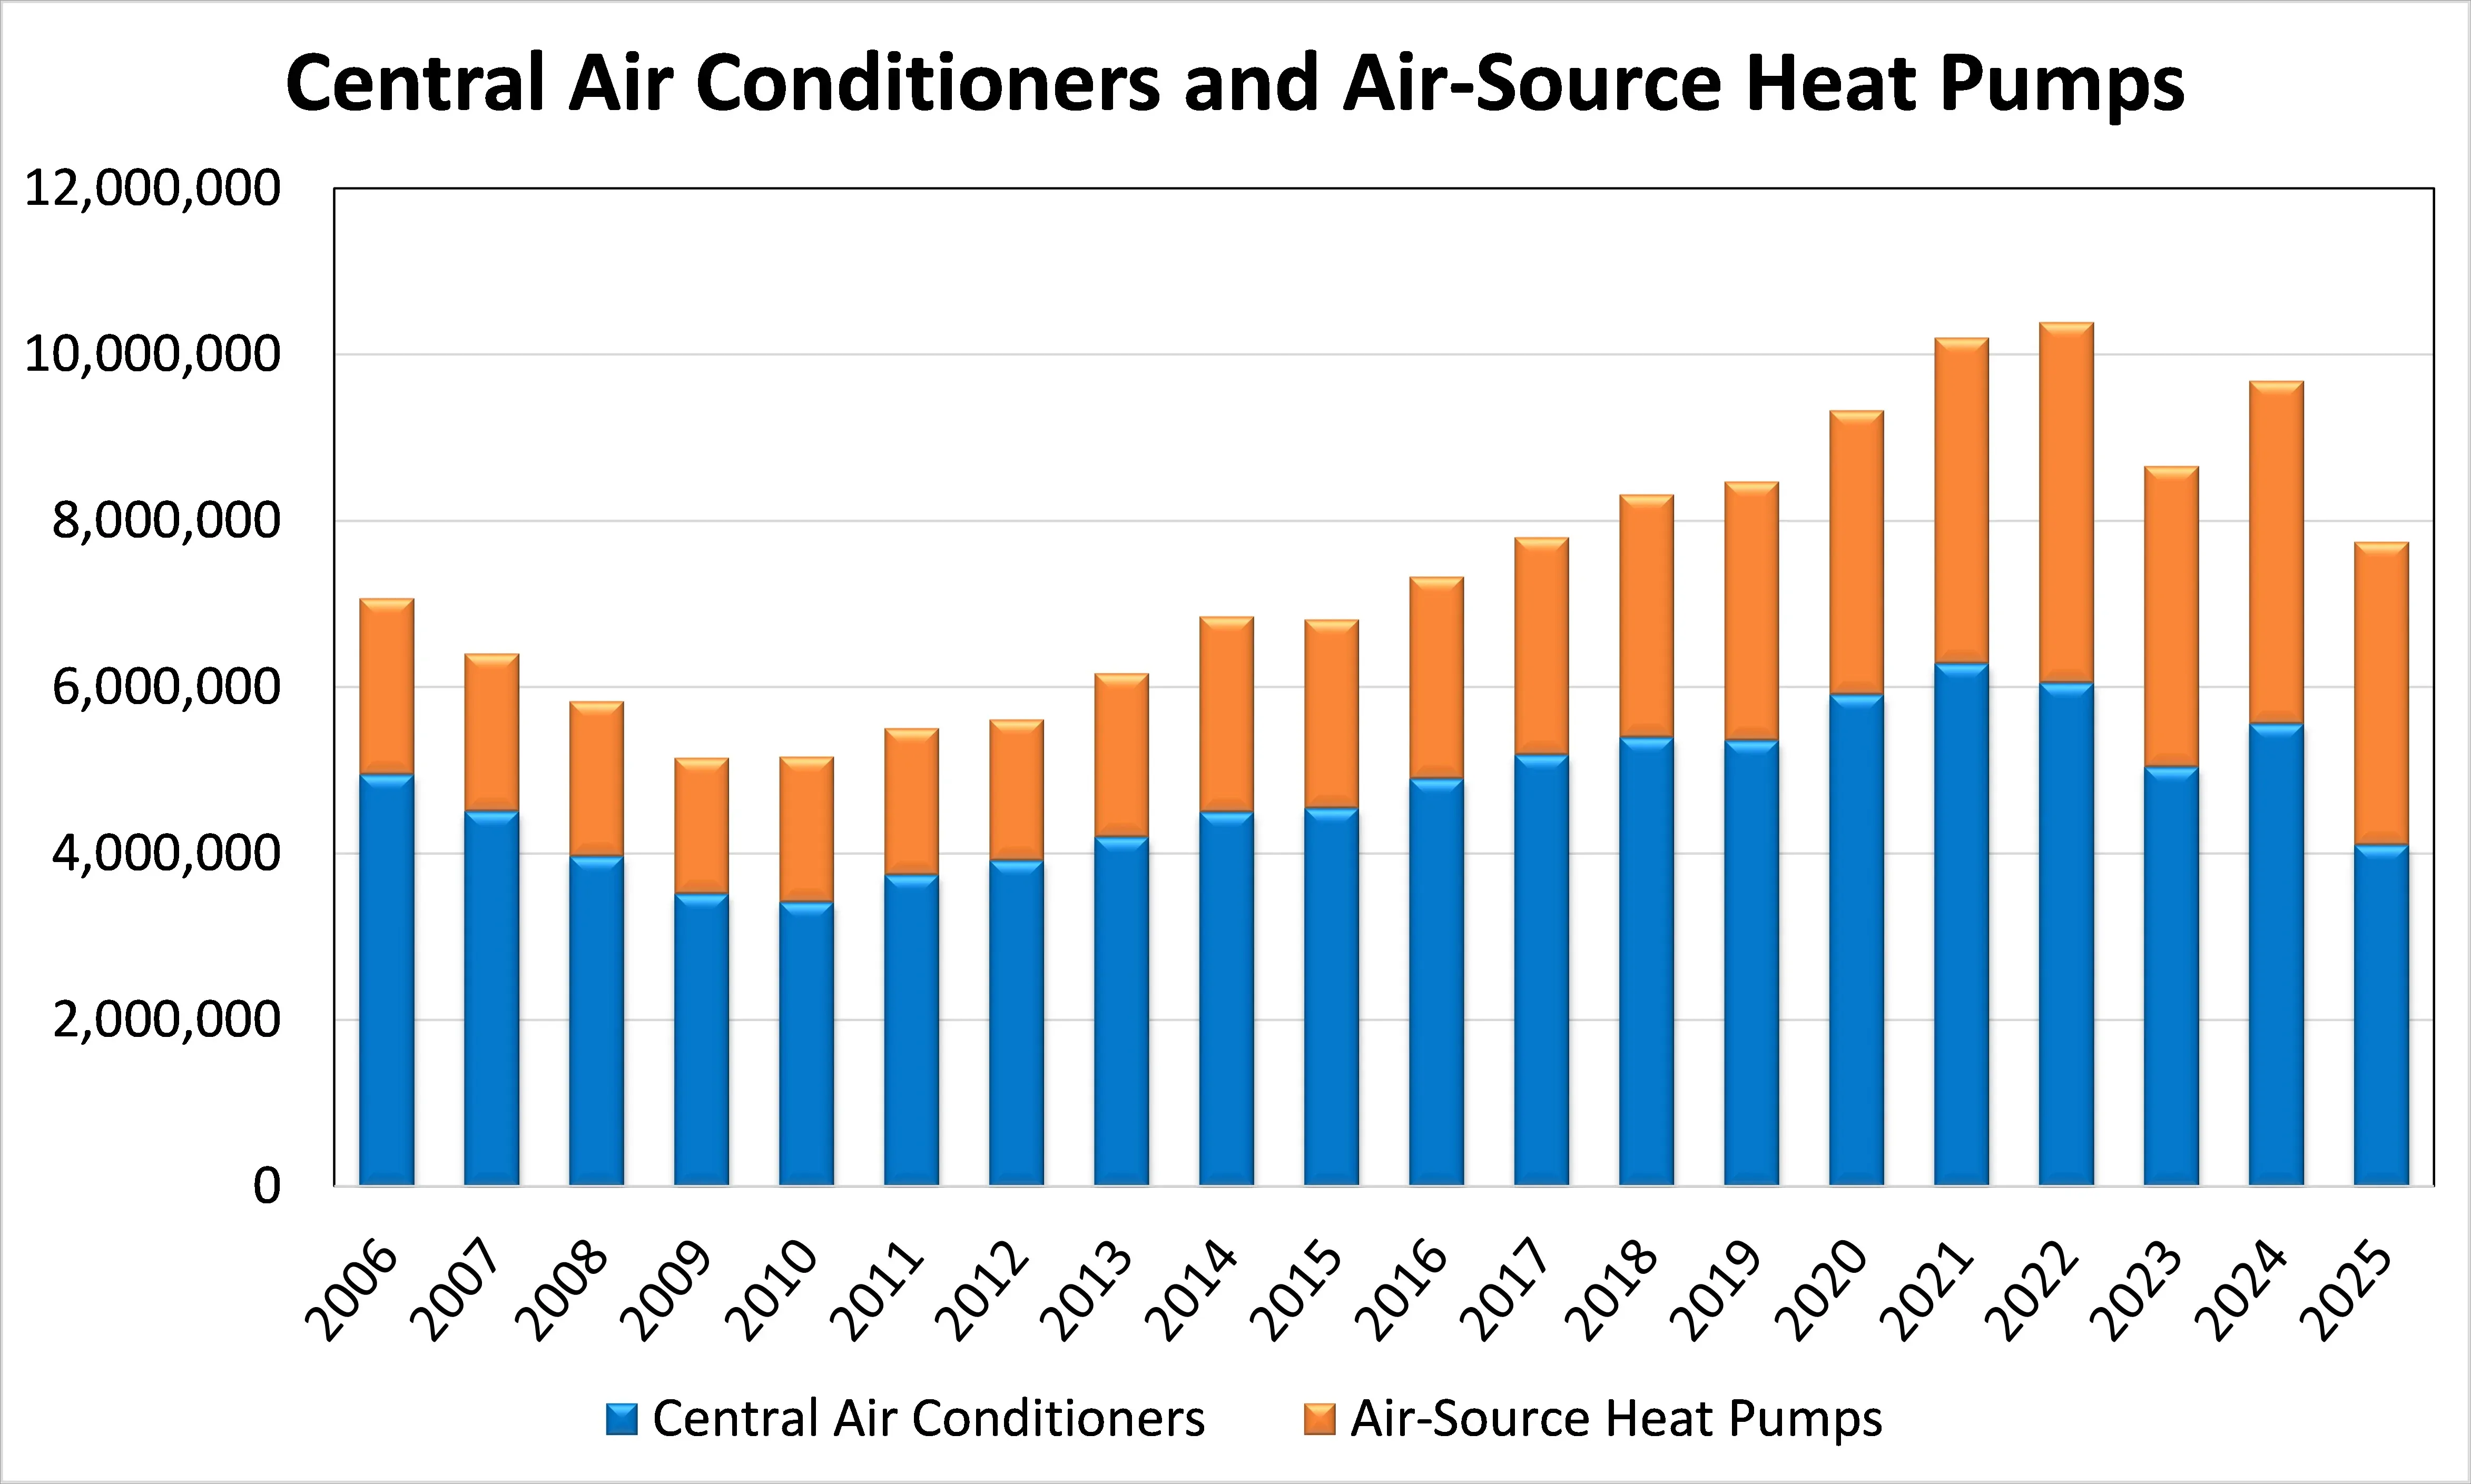 Figure 3: AHRI’s 20-year chart stacks central air conditioner and heat pump shipments by year. The 2025 bar is the lowest since 2016, and heat pumps are a growing share of each bar. Source: AHRI, Central Air Conditioners and Air-Source Heat Pumps historical data, Dec 2025. Chart published by the source, captured 20 Oct 2026.
How did AC and heat pump shipments change from 2024 to 2025?
Central air conditioner shipments fell 26.2% in 2025, to 4,104,933 units (AHRI, December 2025 shipment release, Feb 2026).
- Combined air conditioner and heat pump shipments were 9,681,770 in 2024 (AHRI, December 2025 shipment release, Feb 2026).
- December 2025 alone saw 408,244 units, down 21.4% from December 2024 (AHRI, December 2025 shipment release, Feb 2026).
- AHRI says its member companies make more than 90% of the equipment made and sold in North America, so its series is broad (AHRI, December 2025 shipment release, Feb 2026).
What about water heaters and oil furnaces?
Residential gas storage water heater shipments rose 1.8% in 2025, to 4,252,075 units (AHRI, December 2025 shipment release, Feb 2026).
- Residential electric storage water heaters shipped 5,028,226 units, down 0.6% (AHRI, December 2025 shipment release, Feb 2026).
- Oil warm air furnaces shipped 32,799 units, up 9.2% (AHRI, December 2025 shipment release, Feb 2026).
How much of the equipment is for commercial buildings?
Units of 65,000 BTUH or more, which AHRI counts as commercial, were 273,318 of the central air conditioners and heat pumps shipped in 2025 (AHRI, December 2025 shipment release, Feb 2026). We added the size rows in AHRI’s table to get this count. The rest were sized for homes and small buildings.
What do shipments look like in 2026 so far?
Combined air conditioner and heat pump shipments rose 6.2% through August 2026, to 6,390,257 units (AHRI, August 2026 shipment release, Oct 2026).
- Air conditioners alone rose 6.5% to 3,481,613 units (AHRI, August 2026 shipment release, Oct 2026).
- Heat pumps rose 5.7% to 2,908,644 units (AHRI, August 2026 shipment release, Oct 2026).
- Gas furnaces fell 5.0% to 2,106,454 units (AHRI, August 2026 shipment release, Oct 2026).
- August alone saw 756,739 air conditioners and heat pumps, up 11.4% (AHRI, August 2026 shipment release, Oct 2026).
- The same eight months of 2024 had 6,735,792 units, so 2026 is still below that mark (AHRI, August 2026 shipment release, Oct 2026).
Who are the biggest HVAC companies, and how are they doing?
Public company reports show a split market. Commercial and data center work is strong. Home comfort is soft. Distributors sit in the middle and feel both.
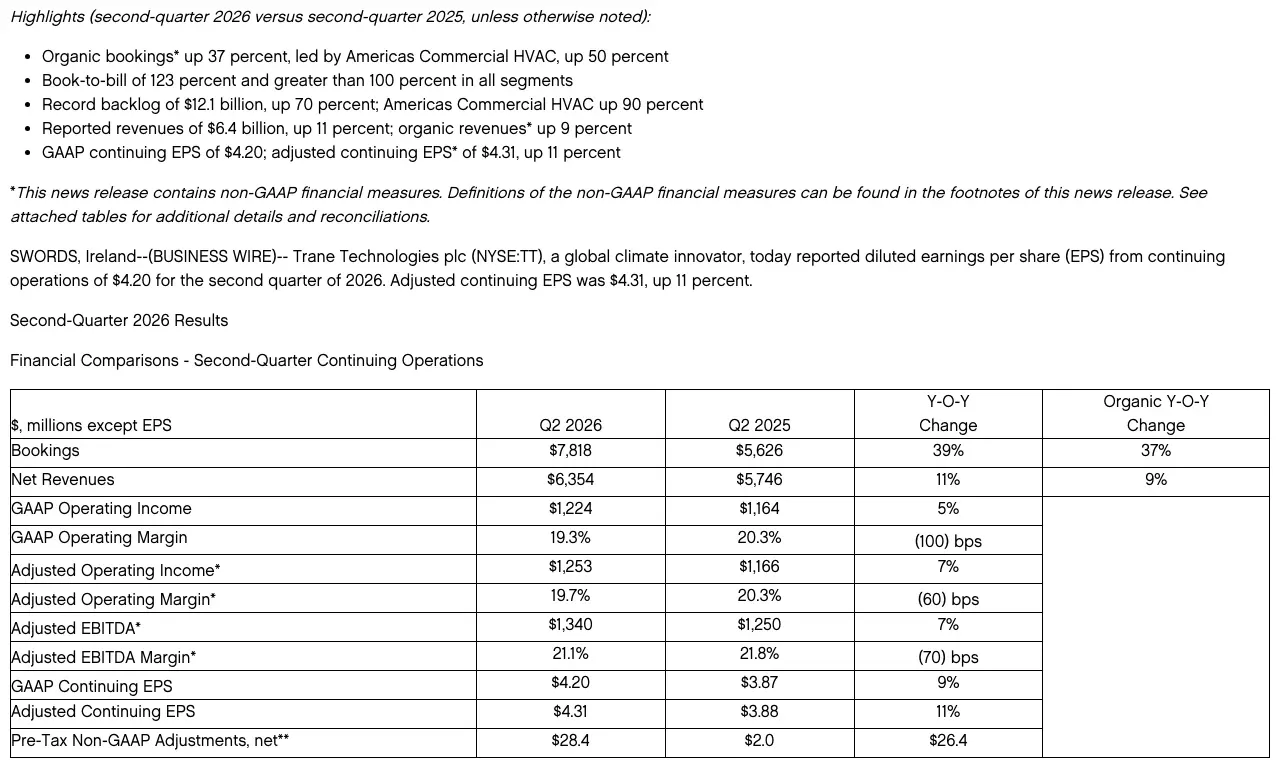 Figure 4: Trane’s second-quarter 2026 release lists bookings, revenue and a record backlog, which captures the commercial boom that other makers also report. Source: Trane Technologies, second-quarter 2026 results, Jul 2026. Screenshot of the source page, captured 20 Oct 2026.
How is the distributor side doing?
Watsco, the largest US HVAC distributor, saw 2025 revenue fall 5% to $7.24 billion (Watsco, full-year 2025 results, Feb 2026).
- Revenue was still 52% above 2019, which was $4.8 billion (Watsco, full-year 2025 results, Feb 2026).
- Domestic residential HVAC equipment sales rose 5% in the second quarter of 2026, with unit volume up 2% and average selling prices up 2% (Watsco, second-quarter 2026 results, Jul 2026).
- E-commerce reached $2.7 billion over the 12 months to June 2026, or 37% of sales (Watsco, second-quarter 2026 results, Jul 2026).
- Contractors used Watsco’s OnCallAir tool to present quotes to about 342,000 households in the same 12 months (Watsco, second-quarter 2026 results, Jul 2026).
- Watsco says North America has more than 2,100 HVAC distributors (Watsco, second-quarter 2026 results, Jul 2026).
How are the equipment makers doing?
Carrier reported 2025 net sales of $21.7 billion, down from $22.5 billion in 2024 (Carrier, full-year 2025 results, Feb 2026).
- Carrier’s Americas residential sales fell 38% in the fourth quarter of 2025 (Carrier, full-year 2025 results, Feb 2026).
- Carrier’s second-quarter 2026 net sales rose 4% to $6.35 billion (Carrier, second-quarter 2026 results, Jul 2026).
- Carrier’s commercial HVAC orders rose about 65% in that quarter, and data center orders rose more than 300% (Carrier, second-quarter 2026 results, Jul 2026).
- Lennox reported 2025 revenue of $5.2 billion, down 3% (Lennox, full-year 2025 results, Jan 2026).
- Trane reported 2025 revenue of $21.3 billion, up 7% (Trane Technologies, full-year 2025 results, Jan 2026).
- Trane’s second-quarter 2026 bookings rose 39% to $7.8 billion (Trane Technologies, second-quarter 2026 results, Jul 2026).
- Johnson Controls reported fiscal 2025 sales of $23.6 billion, up 3% (Johnson Controls, fiscal 2025 results, Nov 2025).
- Johnson Controls ended the year with a record backlog of $15 billion in its systems and services businesses (Johnson Controls, fiscal 2025 results, Nov 2025).
How are large commercial contractors doing?
Comfort Systems USA, a large commercial HVAC contractor, reported 2025 revenue of $9.10 billion, up from $7.03 billion (Comfort Systems USA, full-year 2025 results, Feb 2026).
- Its second-quarter 2026 revenue was $3.27 billion, up from $2.17 billion a year earlier (Comfort Systems USA, second-quarter 2026 results, Jul 2026).
- Its backlog reached $14.06 billion at the end of June 2026, up from $8.12 billion a year earlier (Comfort Systems USA, second-quarter 2026 results, Jul 2026).
How do homes and commercial buildings use HVAC equipment?
We found no single federal table that splits HVAC work between homes and commercial buildings. The best evidence is how many buildings have equipment, how old it is, and how much power it uses. Demand by service type is in our home services industry statistics.
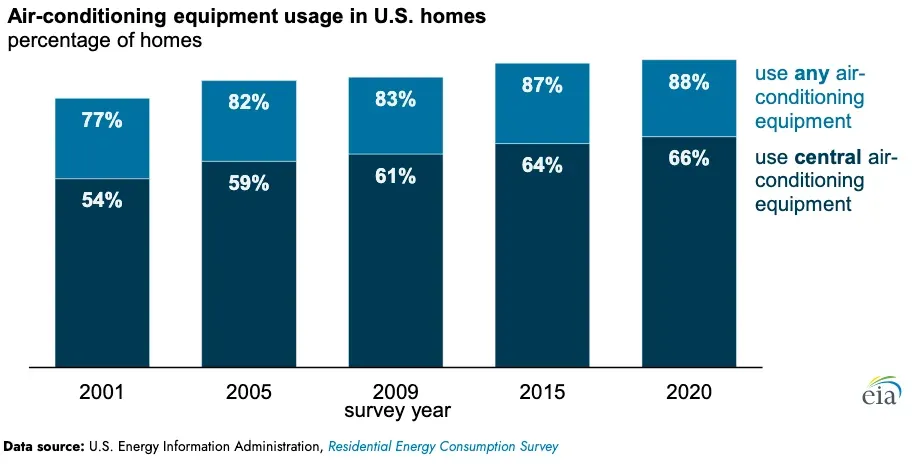 Figure 5: The share of homes with air conditioning rose in every survey from 2001 to 2020, and central systems grew with it. That growth is the installed base that shops now service and replace. Source: EIA, Nearly 90% of U.S. households used air conditioning in 2020, May 2022. Screenshot of the source page, captured 20 Oct 2026.
How many homes have central air and furnaces?
82.69 million US homes used central air conditioning or a central heat pump as their main cooling in 2020 (EIA, RECS 2020 table HC7.1, Mar 2023).
- 21.43 million homes relied on a window or wall unit (EIA, RECS 2020 table HC7.1, Mar 2023).
- 74.42 million homes used a central warm-air furnace as main heating (EIA, RECS 2020 table HC6.1, Mar 2023).
- 12.78 million homes had a smart or internet-connected thermostat (EIA, RECS 2020 table HC6.1, Mar 2023).
How old is the equipment in homes?
10.55 million homes had main air conditioning equipment that was 20 years old or more in 2020 (EIA, RECS 2020 table HC7.1, Mar 2023).
- Another 11.01 million homes had air conditioning that was 15 to 19 years old (EIA, RECS 2020 table HC7.1, Mar 2023).
- 14.66 million homes had main heating equipment that was 15 to 19 years old (EIA, RECS 2020 table HC6.1, Mar 2023).
How much energy do home HVAC systems use?
Space heating and air conditioning together took 52% of a household’s annual energy use in 2020 (EIA, Use of energy in homes, Dec 2023).
- Air conditioning alone used about 19% of home electricity, or 254 billion kilowatt-hours (EIA, Air conditioning electricity FAQ, Mar 2024).
- 93% of homes built from 2010 to 2020 used air conditioning, against 83% of homes built before 1950 (EIA, Nearly 90% of U.S. households used air conditioning in 2020, May 2022).
What about commercial buildings?
The US had about 5.9 million commercial buildings with 96.4 billion square feet of floor space in 2018 (EIA, Use of energy in commercial buildings, Jun 2023).
- Space heating used about 32% of the energy in those buildings (EIA, Use of energy in commercial buildings, Jun 2023).
- 78% of commercial buildings were cooled with electricity (EIA, CBECS 2018 building characteristics, Sep 2022).
- Natural gas heated 44% of commercial buildings and electricity heated 43% (EIA, CBECS 2018 building characteristics, Sep 2022).
- Cooling took about 14% of commercial electricity and ventilation took 18% (EIA, Air conditioning electricity FAQ, Mar 2024).
- Computing is projected to rise from 8% of commercial electricity in 2024 to 20% by 2050(EIA, Electricity use for commercial computing could surpass space cooling, Jun 2025).
Are heat pumps replacing furnaces in US homes?
Electric heat is gaining on gas, and heat pumps are doing much of the work. The change is slow, because it follows replacement cycles, not fashion.
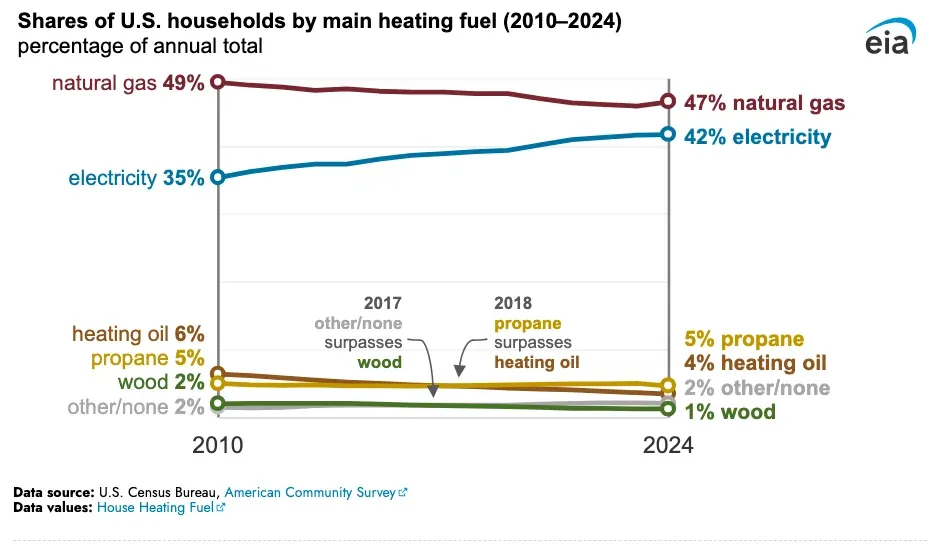 Figure 6: Electricity has climbed while natural gas has slipped since 2010, and heating oil has dropped below propane. This is the market that heat pump sales are drawing from. Source: EIA, Electricity use is becoming more common for residential heating, Oct 2025. Screenshot of the source page, captured 20 Oct 2026.
How many US homes heat with a heat pump?
Natural gas was the main heating fuel in 47% of US homes in 2024, down from 49% in 2010 (EIA, Electricity use is becoming more common for residential heating, Oct 2025).
- 16.13 million homes used a heat pump as main heating equipment in 2020 (EIA, RECS 2020 table HC6.1, Mar 2023).
- 1.06 million homes used a ductless mini-split heat pump as main heating (EIA, RECS 2020 table HC6.1, Mar 2023).
- The IEA estimates that over 20% of US households now rely on a heat pump for primary heating. This is a 2025 estimate, while EIA’s survey counted 2020 (IEA, Heat Pump Monitor 2026, Jul 2026).
How fast are heat pump sales growing?
In 2025, US heat pump sales were around 12% higher than sales of fossil fuel heating systems (IEA, Heat Pump Monitor 2026, Jul 2026).
- US heat pump sales almost doubled over the past decade (IEA, Heat Pump Monitor 2026, Jul 2026).
- Swapping a cooling-only unit for a reversible one typically costs USD 200 to 500 more (IEA, Heat Pump Monitor 2026, Jul 2026).
- If every cooling-only air conditioner were replaced by a reversible system at end of life, heat pumps could heat roughly 60% of US households by 2035 (IEA, Heat Pump Monitor 2026, Jul 2026).
- The IEA projects US heat pump sales to double by 2035 under current and stated policies (IEA, Heat Pump Monitor 2026, Jul 2026).
- More than 250,000 families claimed a federal credit for a heat pump on 2023 tax returns filed through May 2024 (Treasury, Inflation Reduction Act energy savings data, Aug 2024).
How big is the heat pump market worldwide?
Heat pumps supplied around 5% of global heating needs in 2024 (IEA, Heat Pump Monitor 2026 key findings, Jul 2026).
- In buildings, they covered around 12% of space heating needs (IEA, Heat Pump Monitor 2026 key findings, Jul 2026).
- Global manufacturing capacity was about 145 GW a year in 2024. China held about 35%, the United States 25% and the EU 20% (IEA, Heat Pump Monitor 2026 key findings, Jul 2026).
What rules are changing HVAC equipment and refrigerants?
Rules, not demand, caused the biggest swings of the last four years. Each change brings new equipment, new training and new prices.
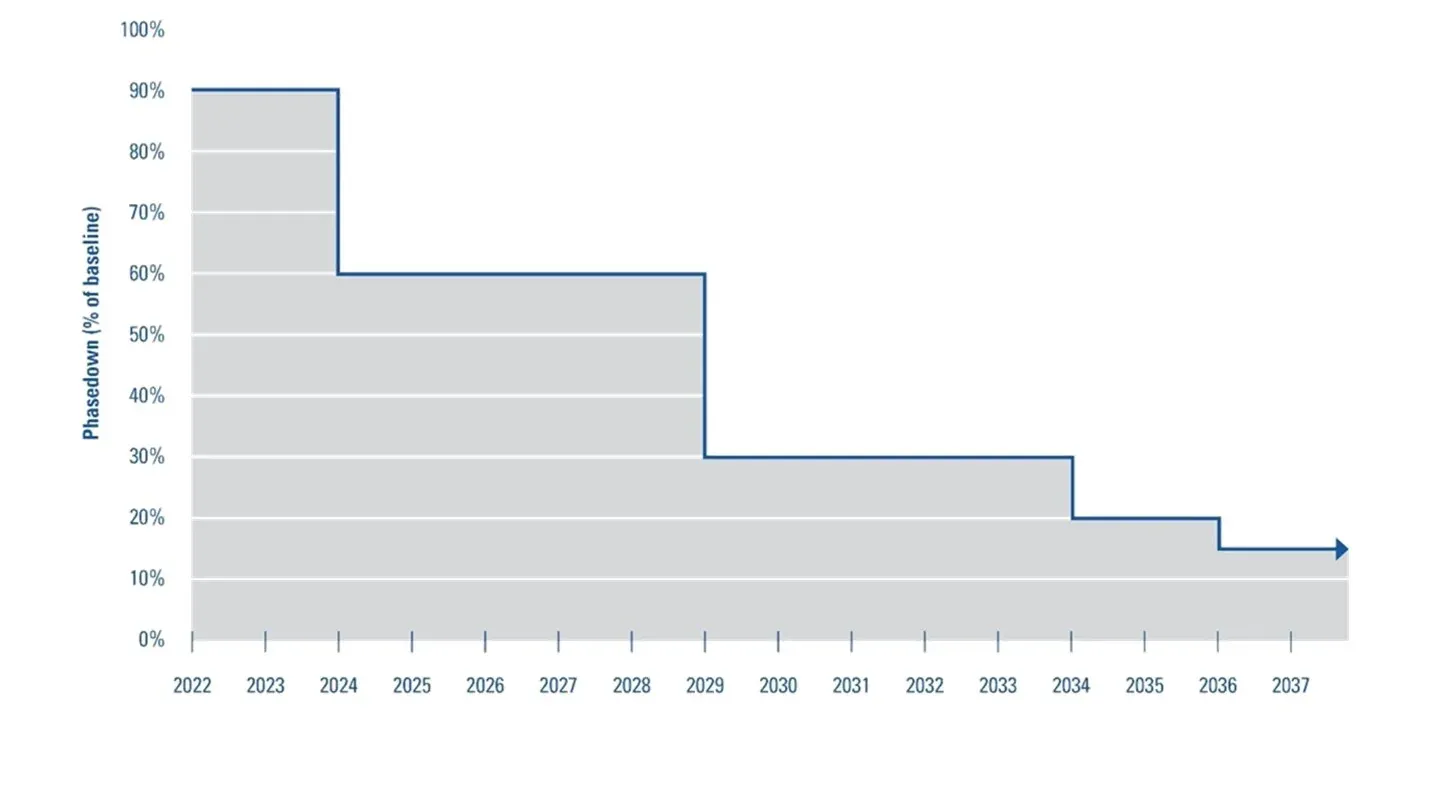 Figure 7: The AIM Act steps the HFC cap down in stages, with the two biggest cuts in 2024 and 2029. Every step pushes the trade toward lower-warming refrigerants. Source: EPA, HFC phasedown questions and answers, Sep 2026. Chart published by the source, captured 20 Oct 2026.
How fast is the HFC phasedown?
The HFC cap is 60% of the baseline for 2024 through 2028 (EPA, HFC phasedown questions and answers, Sep 2026).
- The cap drops to 30% for 2029 through 2033 (EPA, HFC phasedown questions and answers, Sep 2026).
- It falls to 15% from 2036 on (EPA, HFC phasedown questions and answers, Sep 2026).
What did the January 2025 refrigerant change do?
Starting January 1, 2025, EPA’s Technology Transitions rule restricted higher-warming HFCs in new residential and light commercial air conditioning and heat pump equipment. The prohibitions cover manufacture, sale, installation and import (EPA, Technology Transitions rules (October 2023 rule), Oct 2023).
- A December 2023 interim rule let shops install equipment made or imported before 2025 until January 1, 2026 (EPA, Technology Transitions rules (December 2023 rule), Dec 2023).
- A May 2026 final rule removed that January 1, 2026 install date, so pre-2025 inventory can be installed until it runs out (EPA, Technology Transitions final rule fact sheet, May 2026).
- The switch to A2L refrigerants touched about 55% of the products Watsco sold across 650 locations and forced it to convert over $1 billion of inventory (Watsco, full-year 2025 results, Feb 2026).
- Watsco added more than 10,000 new SKUs for the A2L launch (Watsco, second-quarter 2026 results, Jul 2026).
- Domestic residential equipment sales rose 22% in the fourth quarter of 2024 as buyers stocked older R-410A systems, with units up 20% (Watsco, full-year 2025 results, Feb 2026).
What are the efficiency standards?
The Department of Energy’s newer central air conditioner and heat pump standards took effect January 1, 2023, with a minimum of 13.4 SEER2 for split-system air conditioners (DOE, 2023 central air conditioner standards FAQ, Oct 2022).
- Split-system heat pumps must meet 14.3 SEER2 (DOE, 2023 central air conditioner standards FAQ, Oct 2022).
- In the Southeast and Southwest, split-system air conditioners under 45,000 BTU an hour must meet 14.3 SEER2 (DOE, 2023 central air conditioner standards FAQ, Oct 2022).
- The previous update took effect January 1, 2015 (DOE, 2023 central air conditioner standards FAQ, Oct 2022).
How much have HVAC equipment prices risen?
Equipment prices jumped in 2021 and 2022 and have kept climbing. A price book set in 2020 no longer matches what a shop pays today. For how shops price jobs, see our pricing statistics.
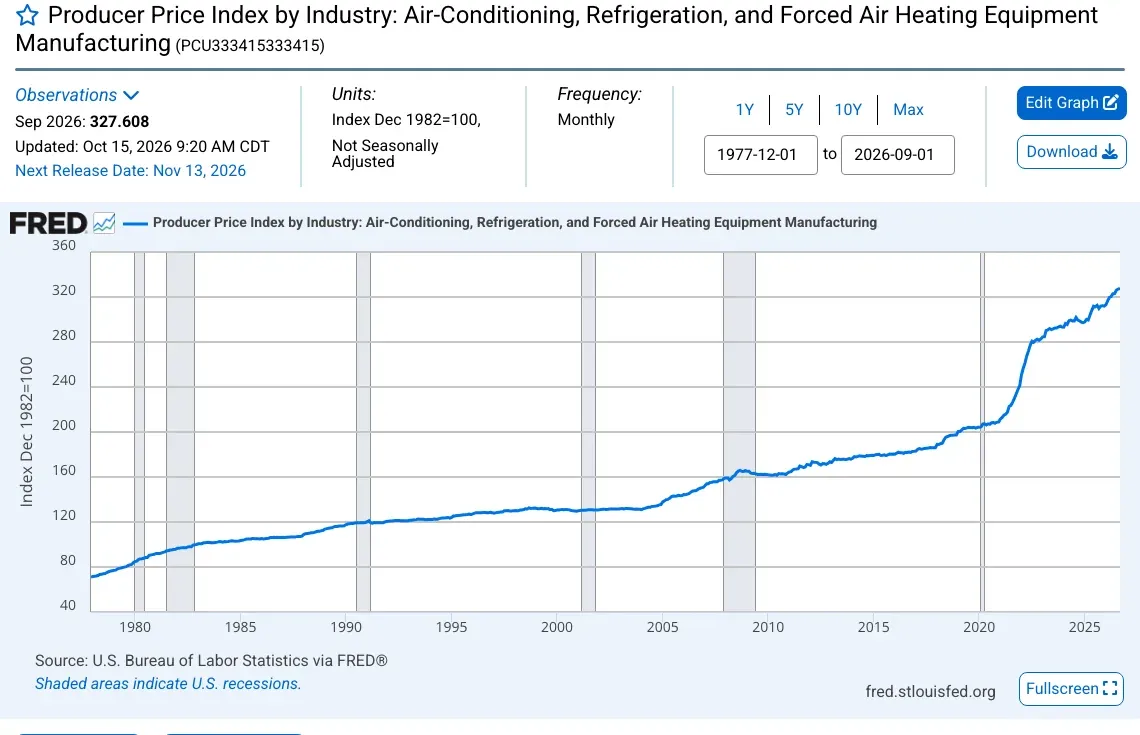 Figure 8: The producer price index for air-conditioning and heating equipment was nearly flat for years, then rose sharply after 2020. Prices have not come back down. Source: BLS, Producer Price Index for air-conditioning and heating equipment (via FRED), Oct 2026. Screenshot of the source page, captured 20 Oct 2026.
How much did equipment prices rise after 2020?
The index stood at 204.2 in January 2020 (BLS, Producer Price Index for air-conditioning and heating equipment (via FRED), Oct 2026). The index base is December 1982 equals 100.
- It reached 241.331 in December 2021 (BLS, Producer Price Index for air-conditioning and heating equipment (via FRED), Oct 2026).
- It reached 282.725 in December 2022 (BLS, Producer Price Index for air-conditioning and heating equipment (via FRED), Oct 2026).
- It reached 311.870 in December 2025 (BLS, Producer Price Index for air-conditioning and heating equipment (via FRED), Oct 2026).
- The September 2026 reading was 327.608 (BLS, Producer Price Index for air-conditioning and heating equipment (via FRED), Oct 2026).
What do distributors and makers say about prices?
Watsco’s domestic average selling price rose 11% in the fourth quarter of 2025 (Watsco, full-year 2025 results, Feb 2026).
- Watsco’s full-year gross margin hit a record 28.0% in 2025 (Watsco, full-year 2025 results, Feb 2026).
- Its second-quarter 2026 gross margin was 27.5% against 29.3% a year earlier, because 2026 price actions were smaller (Watsco, second-quarter 2026 results, Jul 2026).
- Lennox booked $30 million in tariff refunds in its second quarter of 2026 (Lennox, second-quarter 2026 results, Jul 2026).
- Lennox said economic doubt led to more deferred system replacements at the end of 2025 (Lennox, full-year 2025 results, Jan 2026).
What does the HVAC industry look like in Canada?
Canada is the same story in a colder climate. Shops are small, and heat pumps are growing fast from a low base.
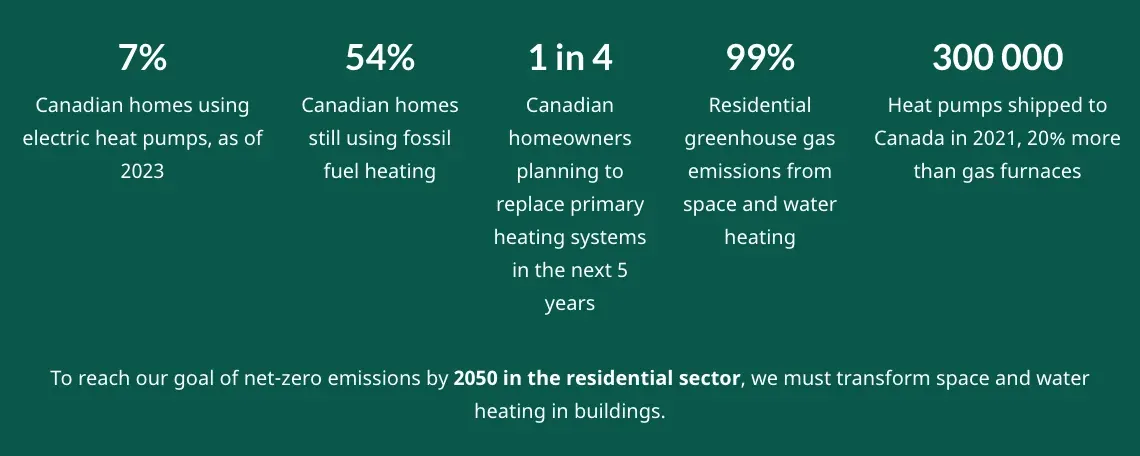 Figure 9: Natural Resources Canada’s summary panel shows how small the heat pump base still is and how many homeowners plan to replace heating soon. Source: NRCan, Electric heat pumps, Dec 2025. Screenshot of the source page, captured 20 Oct 2026.
How many HVAC businesses are there in Canada?
Canada also had 13,244 plumbing, heating and air-conditioning businesses with no employees in June 2026 (Statistics Canada, Canadian Business Counts without employees, June 2026, Aug 2026).
- 9,646 employer businesses had 1 to 4 employees (Statistics Canada, Canadian Business Counts with employees, June 2026, Aug 2026).
- 3,187 had 5 to 9 employees (Statistics Canada, Canadian Business Counts with employees, June 2026, Aug 2026).
- 1,988 had 10 to 19 employees (Statistics Canada, Canadian Business Counts with employees, June 2026, Aug 2026).
- Only 13 had 500 employees or more (Statistics Canada, Canadian Business Counts with employees, June 2026, Aug 2026).
- Employer businesses numbered 15,602 in December 2022 (Statistics Canada, Canadian Business Counts with employees, December 2022, Feb 2023).
How fast are Canadian homes moving to heat pumps?
About 7% of Canadian homes used electric heat pumps as of 2023 (NRCan, Electric heat pumps, Dec 2025).
- 54% of Canadian homes still used fossil fuel heating (NRCan, Electric heat pumps, Dec 2025).
- One in four homeowners planned to replace their main heating system within five years (NRCan, Electric heat pumps, Dec 2025).
- About 300,000 heat pumps shipped to Canada in 2021, 20% more than gas furnaces (NRCan, Electric heat pumps, Dec 2025).
- 286,778 new heat pumps were installed with federal support from December 2020 to March 2026 (NRCan, Greener Homes Initiative highlights, Apr 2026).
- The Canada Greener Homes Grant had issued $1.8 billion by then (NRCan, Greener Homes Initiative highlights, Apr 2026).
- Canada Energy Regulator data show over 800,000 residential heat pumps installed by 2020 (CER, heat pump market snapshot, Dec 2023).
- Heat pumps met just over 5% of residential space heating needs, against about 10% worldwide (CER, heat pump market snapshot, Dec 2023).
- Space heating takes about 60% of the energy used in Canada’s buildings (CER, heat pump market snapshot, Dec 2023).
How does the US compare with the rest of the world?
Cooling is the world’s growth story. The US and China hold most of the air conditioners, and the hottest places have the fewest.
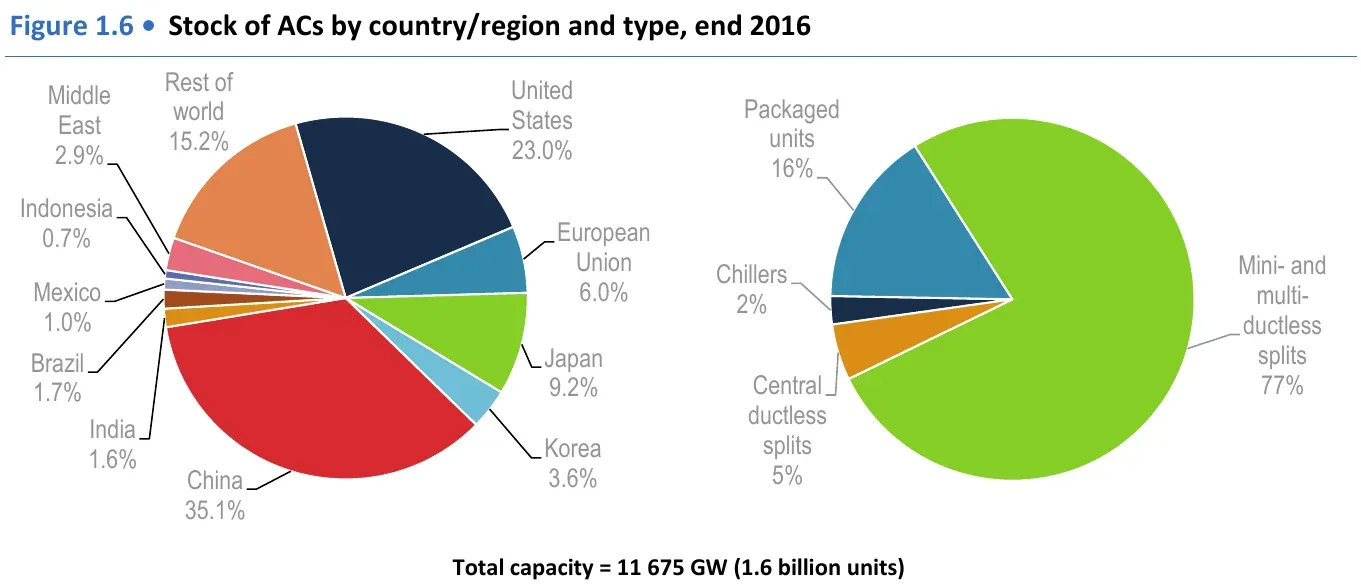 Figure 10: Two countries hold more than half of the world’s air conditioners. The data are for the end of 2016. Source: IEA, The Future of Cooling, May 2018. Chart published by the source, captured 20 Oct 2026.
How many air conditioners are in use worldwide?
About 1.6 billion air conditioners were in use at the end of 2016, with 570 million in China and 375 million in the United States (IEA, The Future of Cooling, May 2018).
- Annual sales of air conditioners had more than tripled since 1990, to 135 million units (IEA, The Future of Cooling, May 2018).
- Nearly 70% of all air conditioners were in residential buildings (IEA, The Future of Cooling, May 2018).
- Only 8% of the 2.8 billion people in the hottest parts of the world owned an air conditioner, against 90% in the United States and Japan (IEA, The Future of Cooling, May 2018).
- The IEA projected the world stock to reach 5.6 billion by 2050 (IEA, Future of Cooling news release, May 2018).
- Air conditioners sold in Japan and the European Union were typically 25% more efficient than those sold in the United States and China (IEA, Future of Cooling news release, May 2018).
Methodology and Sources
We chose HVAC stats that a reporter could check. Each one comes from the group that produced it, such as a government agency, a trade association that collects its own data, a public company report or an intergovernmental agency. We read each page or file and confirmed the number and the date before we used it. We did not use research firm market sizes, because they differ by a factor of two. Some counts come from data files linked on the cited Census and Statistics Canada pages. We added a few totals ourselves, and we say so where we did. These are the one-in-four share, the commercial-size shipment count and the 60% price change. Census codes group plumbing with heating and air conditioning, so many counts cover both. The page is checked and updated every month.
Glossary
- A2L: a class of refrigerants that burn only weakly and have low global warming potential. They replaced R-410A in new equipment.
- AHRI: the Air-Conditioning, Heating, and Refrigeration Institute, a trade group for equipment makers.
- AIM Act: the 2020 US law that phases down HFC refrigerants.
- BTUH: British thermal units per hour, a measure of cooling or heating size.
- CBECS: the Commercial Buildings Energy Consumption Survey from EIA.
- CBP: County Business Patterns, a yearly Census count of employer businesses.
- GWP: global warming potential, a measure of how strongly a gas warms the planet.
- HFC: hydrofluorocarbon, a family of refrigerants.
- NAICS: the North American Industry Classification System. Code 238220 is plumbing, heating and air-conditioning contractors.
- PPI: the Producer Price Index from the Bureau of Labor Statistics.
- RECS: the Residential Energy Consumption Survey from EIA.
- SEER2: a rating for cooling efficiency under the test that took effect in 2023.
Sources
- AHRI, Central Air Conditioners and Air-Source Heat Pumps historical data
- AHRI, December 2025 shipment release
- AHRI, August 2026 shipment release
- BLS, Producer Price Index for air-conditioning and heating equipment (via FRED)
- Canada Energy Regulator, heat pump market snapshot
- Carrier, full-year 2025 results
- Carrier, second-quarter 2026 results
- Census Bureau, County Business Patterns 2019
- Census Bureau, County Business Patterns 2022
- Census Bureau, County Business Patterns 2023
- Census Bureau, Economic Census 2022 (construction)
- Census Bureau, Economic Census 2022 (manufacturing)
- Census Bureau, Economic Census 2022 (wholesale)
- Comfort Systems USA, full-year 2025 results
- Comfort Systems USA, second-quarter 2026 results
- DOE, 2023 central air conditioner standards FAQ
- EIA, Air conditioning electricity FAQ
- EIA, CBECS 2018 building characteristics
- EIA, Electricity use for commercial computing could surpass space cooling
- EIA, Electricity use is becoming more common for residential heating
- EIA, Nearly 90% of U.S. households used air conditioning in 2020
- EIA, RECS 2020 table HC6.1
- EIA, RECS 2020 table HC7.1
- EIA, Use of energy in commercial buildings
- EIA, Use of energy in homes
- EPA, HFC phasedown questions and answers
- EPA, Technology Transitions final rule fact sheet
- EPA, Technology Transitions rules
- IEA, Future of Cooling news release
- IEA, Heat Pump Monitor 2026
- IEA, Heat Pump Monitor 2026 key findings
- IEA, The Future of Cooling
- Johnson Controls, fiscal 2025 results
- Lennox, full-year 2025 results
- Lennox, second-quarter 2026 results
- Natural Resources Canada, Electric heat pumps
- Natural Resources Canada, Greener Homes Initiative highlights
- Statistics Canada, Canadian Business Counts with employees, December 2022
- Statistics Canada, Canadian Business Counts with employees, June 2026
- Statistics Canada, Canadian Business Counts without employees, June 2026
- Trane Technologies, full-year 2025 results
- Trane Technologies, second-quarter 2026 results
- Treasury, Inflation Reduction Act energy savings data
- Watsco, full-year 2025 results
- Watsco, second-quarter 2026 results