Roofing industry statistics show a large trade built from small local shops, and one that follows the weather. US roofing contractors took in $69.9 billion in revenue in 2022 (Census Bureau, Economic Census, Dec 2024), and they employed 250,383 people on average in 2025 (BLS, QCEW, Aug 2026). Asphalt shingles, the cover on most American roofs, shipped 10.3% fewer squares in 2025 than in 2024 (ARMA, Q4 2025 shipment report, Jan 2026).
This page collects the numbers a roofing owner, supplier or reporter needs: how many companies there are, how big they are, what roofers earn, what materials cost, how storms drive demand, and what homeowners spend and expect. Every figure comes from the agency, trade body or research group that produced it. Each one is dated and linked.
Three things stand out. Most roofing companies are tiny. Demand swings with hail, wind and insurance payouts. And homeowners say they favor contractors that show their prices. The sections below back each point with data.
Related pages: home improvement statistics, construction labor shortage statistics and home services industry statistics.
Key Takeaways
- The US had 25,519 employer roofing establishments in 2023. (Census Bureau, County Business Patterns, Jun 2025)
- Small shops dominate: 15,714 of 24,044 roofing firms had fewer than five employees in 2022. (Census Bureau, Statistics of US Businesses, Apr 2025)
- Roofers die on the job at 48.7 per 100,000 full-time workers, against 3.3 for all workers. (BLS, Census of Fatal Occupational Injuries, Feb 2026)
- The median roofer earned $55,440 in May 2025. (BLS, Occupational Outlook Handbook, Sep 2026)
- 64.7% of employed roofers are Hispanic or Latino. (BLS, Current Population Survey, Feb 2026)
- Severe convective storms cost US insurers $51 billion in 2025, the third year in a row above $50 billion. (Triple-I, Apr 2026)
- US storm insured losses fell to about $27 billion in the first half of 2026, from more than $40 billion in each of the three years before. (Aon, Jul 2026)
- US asphalt shingle shipments fell 4.7% in the first half of 2026. (ARMA, Q2 2026 shipment report, Jul 2026)
- Only 14.2% of roofing jobs were done by the owner, so roofing is mostly a hired-out trade. (Census Bureau, American Housing Survey, Jan 2025)
- About 5.7 million US homes had a roof leak in the year before the 2023 survey. (Census Bureau, American Housing Survey, Jan 2025)
- 76.0% of US homes are roofed mainly with asphalt or composition shingles. (EIA, Residential Energy Consumption Survey, May 2026)
- 65% of homeowners say they are more likely to call a roofing contractor that shows prices on its website. (Roofing Contractor, 2026 homeowner survey, Jan 2026)
- The producer price index for prepared asphalt roofing and siding products rose from 252.3 in December 2019 to 374.3 in September 2026. (BLS, Producer Price Index, Sep 2026)
- Only 16% of roofing and exterior contractors follow up with homeowners the same day on unsold estimates. (ServiceTitan, Jan 2026)
How big is the roofing market in the US?
Roofing is a big trade, but no single company runs it. Private owners pay for almost all of the work, and the market is spread across thousands of local firms.
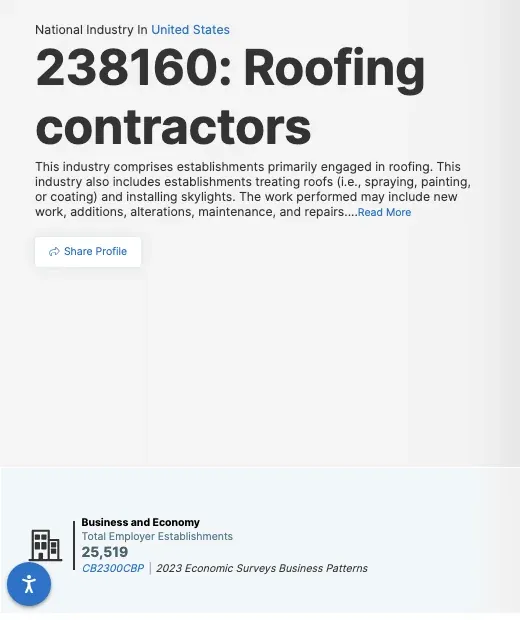 Figure 1: The Census Bureau profile for roofing contractors (NAICS 238160) counts employer establishments from County Business Patterns, the base for most roofing market sizing. Source: Census Bureau, County Business Patterns industry profile, Jun 2025. Screenshot of the source page, captured 20 Oct 2026.
How much do roofing contractors earn?
The 2022 Economic Census is the most complete count of roofing revenue. It splits the money by customer type, so you can see who pays.
- 24,082 roofing firms reported to the 2022 Economic Census (Census Bureau, Economic Census, Dec 2024).
- They did $67.9 billion of construction work (Census Bureau, Economic Census, Dec 2024).
- $64.1 billion of that came from roofing work itself (Census Bureau, Economic Census kind of business, Dec 2025).
- Gutter installation added $1.38 billion (Census Bureau, Economic Census kind of business, Dec 2025).
- Privately owned projects accounted for $59.4 billion of the work (Census Bureau, Economic Census, Dec 2024).
- State and local government projects were worth $6.63 billion (Census Bureau, Economic Census, Dec 2024).
- Federal projects were worth $1.86 billion (Census Bureau, Economic Census, Dec 2024).
- Value added, which is revenue after the cost of materials and subcontracted work, was $36.6 billion (Census Bureau, Economic Census, Dec 2024).
How many roofing companies are there, and is the count growing?
The count is growing. Two federal sources agree on the direction even though they count different things. The Census Bureau counts employer establishments. The Bureau of Labor Statistics counts every business that pays unemployment insurance tax.
- County Business Patterns counted 20,260 roofing establishments in 2018 (Census Bureau, County Business Patterns 2018, Jun 2020).
- Those establishments employed 185,224 people in 2018 (Census Bureau, County Business Patterns 2018, Jun 2020).
- Employment reached 215,242 in 2023 (Census Bureau, County Business Patterns 2023, Jun 2025).
- Annual payroll in 2023 was $15.19 billion (Census Bureau, County Business Patterns 2023, Jun 2025).
- BLS counted 24,475 roofing establishments in 2019 (BLS, QCEW 2019, Aug 2020).
- BLS counted 32,995 in 2025 (BLS, QCEW, Aug 2026).
How small are most roofing companies?
Most roofing sites are crews of a few people. Large national roofers exist, but there are very few of them.
- 16,661 establishments had fewer than five employees (Census Bureau, County Business Patterns 2023, Jun 2025).
- 3,826 had five to nine (Census Bureau, County Business Patterns 2023, Jun 2025).
- 1,715 had 20 to 49 (Census Bureau, County Business Patterns 2023, Jun 2025).
- 216 firms had 100 to 499 employees (Census Bureau, Statistics of US Businesses, Apr 2025).
- The few firms with 500 or more employees earned $4.89 billion (Census Bureau, Statistics of US Businesses, Apr 2025).
Which states have the most roofing work?
Roofing follows population, housing growth and storms. Three states lead on every measure.
- California had the most roofing establishments, 2,926 (Census Bureau, County Business Patterns 2023 by state, Jun 2025).
- Texas had 2,442 (Census Bureau, County Business Patterns 2023 by state, Jun 2025).
- Florida had 2,215, but the most roofing employees of any state, 30,080 (Census Bureau, County Business Patterns 2023 by state, Jun 2025).
- Roofing contractors did $7.07 billion of work in Florida (Census Bureau, Economic Census work by state, Dec 2025).
- They did $6.37 billion in Texas (Census Bureau, Economic Census work by state, Dec 2025).
- Pennsylvania ranked fourth for work done, at $3.25 billion (Census Bureau, Economic Census work by state, Dec 2025).
How many people work in roofing, and what do they earn?
Roofing needs no degree and pays a steady wage. The work is also dangerous and seasonal.
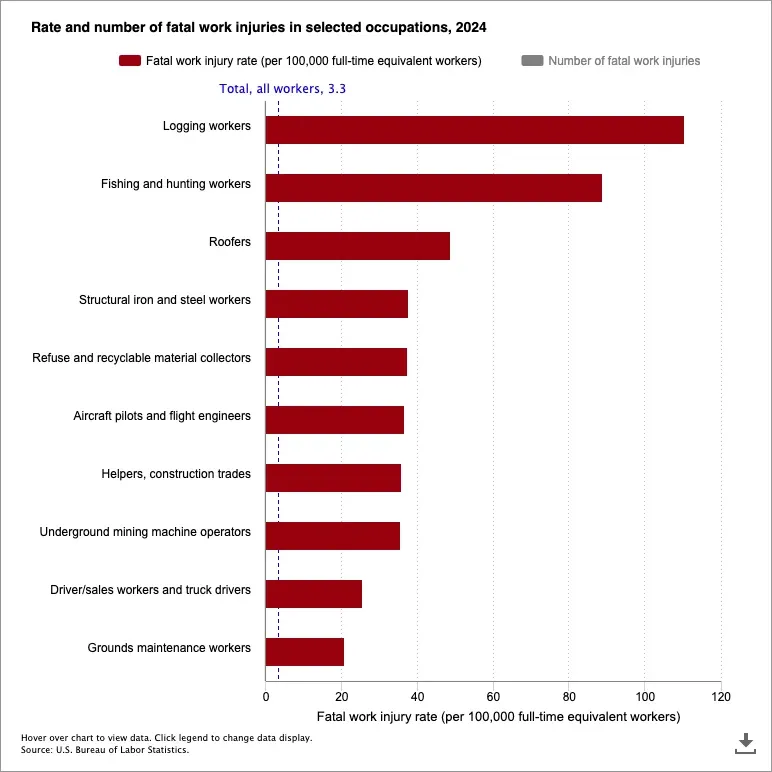 Figure 2: Only logging workers and fishing and hunting workers had a higher fatal injury rate than roofers in 2024, and the all-worker rate is a small fraction of the roofer rate. Source: BLS, Census of Fatal Occupational Injuries chart, Feb 2026. Screenshot of the source page, cropped to the chart, captured 20 Oct 2026.
How many roofers are there?
The headcount depends on who you count. The wage survey covers only people on payroll, while the outlook figures also count the self-employed.
- BLS expects 5% growth to 2035, or 8,800 more jobs (BLS, Occupational Outlook Handbook, Sep 2026).
- That would bring the total to 175,600 jobs by 2035 (BLS, Occupational Outlook Handbook, Sep 2026).
- The wage survey counted 135,490 roofers on payrolls (BLS, Occupational Employment and Wage Statistics, May 2026).
Who employs roofers?
Almost all roofers work for a roofing company, and a fifth work for themselves.
- 72% of roofer jobs are at roofing contractors (BLS, Occupational Outlook Handbook, Sep 2026).
- 20% of roofers are self-employed (BLS, Occupational Outlook Handbook, Sep 2026).
- 6,030 workers were employed as roofer helpers (BLS, Occupational Employment and Wage Statistics, May 2026).
What do roofers earn?
Pay differs by source and by state. Florida, where the most roofers work, pays among the lowest weekly wages for the trade.
- Roofers on payroll averaged $58,140 a year (BLS, Occupational Employment and Wage Statistics, May 2026).
- That is $27.95 an hour on average (BLS, Occupational Employment and Wage Statistics, May 2026).
- Roofer helpers averaged $45,150 a year (BLS, Occupational Employment and Wage Statistics, May 2026).
- Full-time roofers had median weekly earnings of $910, against $1,204 for all full-time workers (BLS, Current Population Survey, Feb 2026).
- Average pay at roofing contractors, including office staff, was $73,901 in 2025 (BLS, QCEW, Aug 2026).
- It was $53,718 in 2019 (BLS, QCEW 2019, Aug 2020).
- Florida roofing contractors paid an average of $1,145 a week (BLS, QCEW, Aug 2026).
- Illinois paid $1,686 (BLS, QCEW, Aug 2026).
Who works as a roofer?
The workforce skews toward mid-career workers.
- 73,000 roofers were 35 to 44 years old, the largest age group (BLS, Current Population Survey, Feb 2026).
- 63,000 were 25 to 34 (BLS, Current Population Survey, Feb 2026).
- 11,000 were 65 or older (BLS, Current Population Survey, Feb 2026).
- 87.0% of roofers are White and 4.2% are Black or African American (BLS, Current Population Survey, Feb 2026).
How seasonal is roofing work?
Roofing crews grow in summer and shrink in winter. That swing drives hiring, cash flow and overtime.
- Roofing employment bottomed out at 236,801 in February 2025 (BLS, QCEW first quarter 2025, Aug 2026).
- It peaked at 259,591 in July (BLS, QCEW third quarter 2025, Aug 2026).
- Average weekly pay was $1,288 in the first quarter (BLS, QCEW first quarter 2025, Aug 2026).
- It was $1,580 in the fourth quarter (BLS, QCEW fourth quarter 2025, Aug 2026).
- Construction crew headcount in the 2022 Economic Census rose from 155,089 in March to 174,804 in December (Census Bureau, Economic Census, Dec 2024).
How dangerous is roofing?
Roofing is one of the most dangerous jobs in the country, and nonfatal injuries are more common than in construction overall.
- 104 roofers died at work in 2024 (BLS, Census of Fatal Occupational Injuries, Feb 2026).
- Across construction and extraction jobs, 1,032 workers died (BLS, Census of Fatal Occupational Injuries release, Feb 2026).
- Falls, slips and trips killed 370 of them (BLS, Census of Fatal Occupational Injuries release, Feb 2026).
- Roofing contractors reported 2.4 injury and illness cases per 100 full-time workers, against 2.2 for construction overall (BLS, Survey of Occupational Injuries and Illnesses, Jan 2026).
What do roofing statistics say about material shipments and prices?
Material demand has softened while prices have not. Shingle volumes slid in 2025 and early 2026, yet the cost of asphalt products keeps climbing.
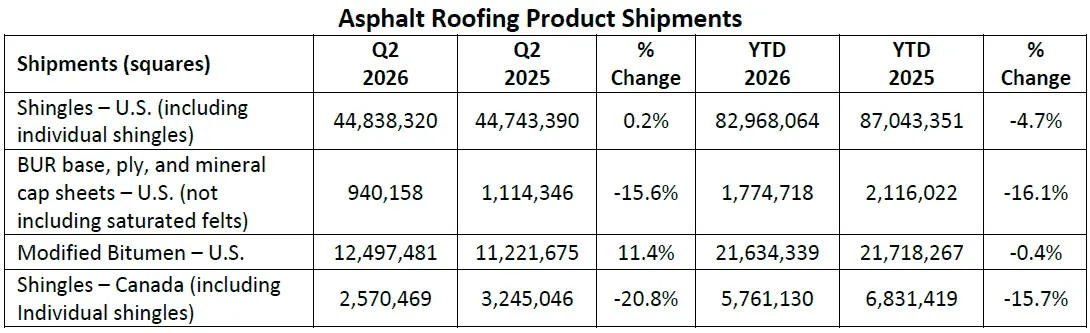 Figure 3: US shingle shipments were flat in the second quarter of 2026 but still trail the first half of 2025, while built-up roofing keeps falling and modified bitumen rebounded. Source: ARMA, Q2 2026 shipment report, Jul 2026. Chart published by the source, captured 20 Oct 2026.
How many shingles does the US ship?
Shipments are counted in squares, and each square covers 100 square feet of roof. ARMA collects them from manufacturers through an independent third party.
- US shingle shipments were 38,129,741 squares in the first quarter of 2026, down 9.9% (ARMA, Q1 2026 shipment report, Apr 2026).
- The second quarter was 44,838,320 squares, up 0.2% (ARMA, Q2 2026 shipment report, Jul 2026).
- The fourth quarter of 2025 fell 27.9% to 27,026,662 squares (ARMA, Q4 2025 shipment report, Jan 2026).
- Canadian shingle shipments rose 10.8% in 2025 to 10,614,693 squares (ARMA, Q4 2025 shipment report, Jan 2026).
- They fell 15.7% in the first half of 2026 to 5,761,130 squares (ARMA, Q2 2026 shipment report, Jul 2026).
What is happening to commercial low-slope materials?
Commercial roofs use membranes and built-up layers rather than shingles. Those shipments show a weaker picture.
- Built-up roofing sheets fell 22.7% in 2025 to 3,749,584 squares (ARMA, Q4 2025 shipment report, Jan 2026).
- They fell another 16.1% in the first half of 2026 (ARMA, Q2 2026 shipment report, Jul 2026).
- Modified bitumen fell 17.0% in 2025 to 37,535,469 squares (ARMA, Q4 2025 shipment report, Jan 2026).
- Modified bitumen rose 11.4% in the second quarter of 2026 to 12,497,481 squares (ARMA, Q2 2026 shipment report, Jul 2026).
Who makes the shingles?
Shingle and coating manufacturing is a small, concentrated industry compared with the contractors who install its products.
- 72 firms operated 165 establishments making asphalt shingle and coating materials in 2022 (Census Bureau, Economic Census manufacturing, Dec 2024).
- They shipped $14.95 billion of product (Census Bureau, Economic Census manufacturing, Dec 2024).
- They employed 10,358 people (Census Bureau, Economic Census manufacturing, Dec 2024).
How fast are roofing prices rising?
Producer price indexes track what sellers charge. They show that both contractors and material makers have raised prices since 2019.
- The index for what nonresidential roofing contractors charge went from 138.8 in December 2019 to 232.9 in September 2026, with December 2007 as 100 (BLS, Producer Price Index, Sep 2026).
- The index for asphalt shingle and coating makers went from 254.3 to 370.4 over the same period (BLS, Producer Price Index, Sep 2026).
- The index for roofing asphalts, pitches and coatings jumped from 299.2 in December 2025 to 347.8 by July 2026 (BLS, Producer Price Index, Sep 2026).
How much do storms drive roof replacement?
Hail does much of the damage to roofs, and the money follows the storm map. A quiet storm season cuts demand the same way a bad one raises it.
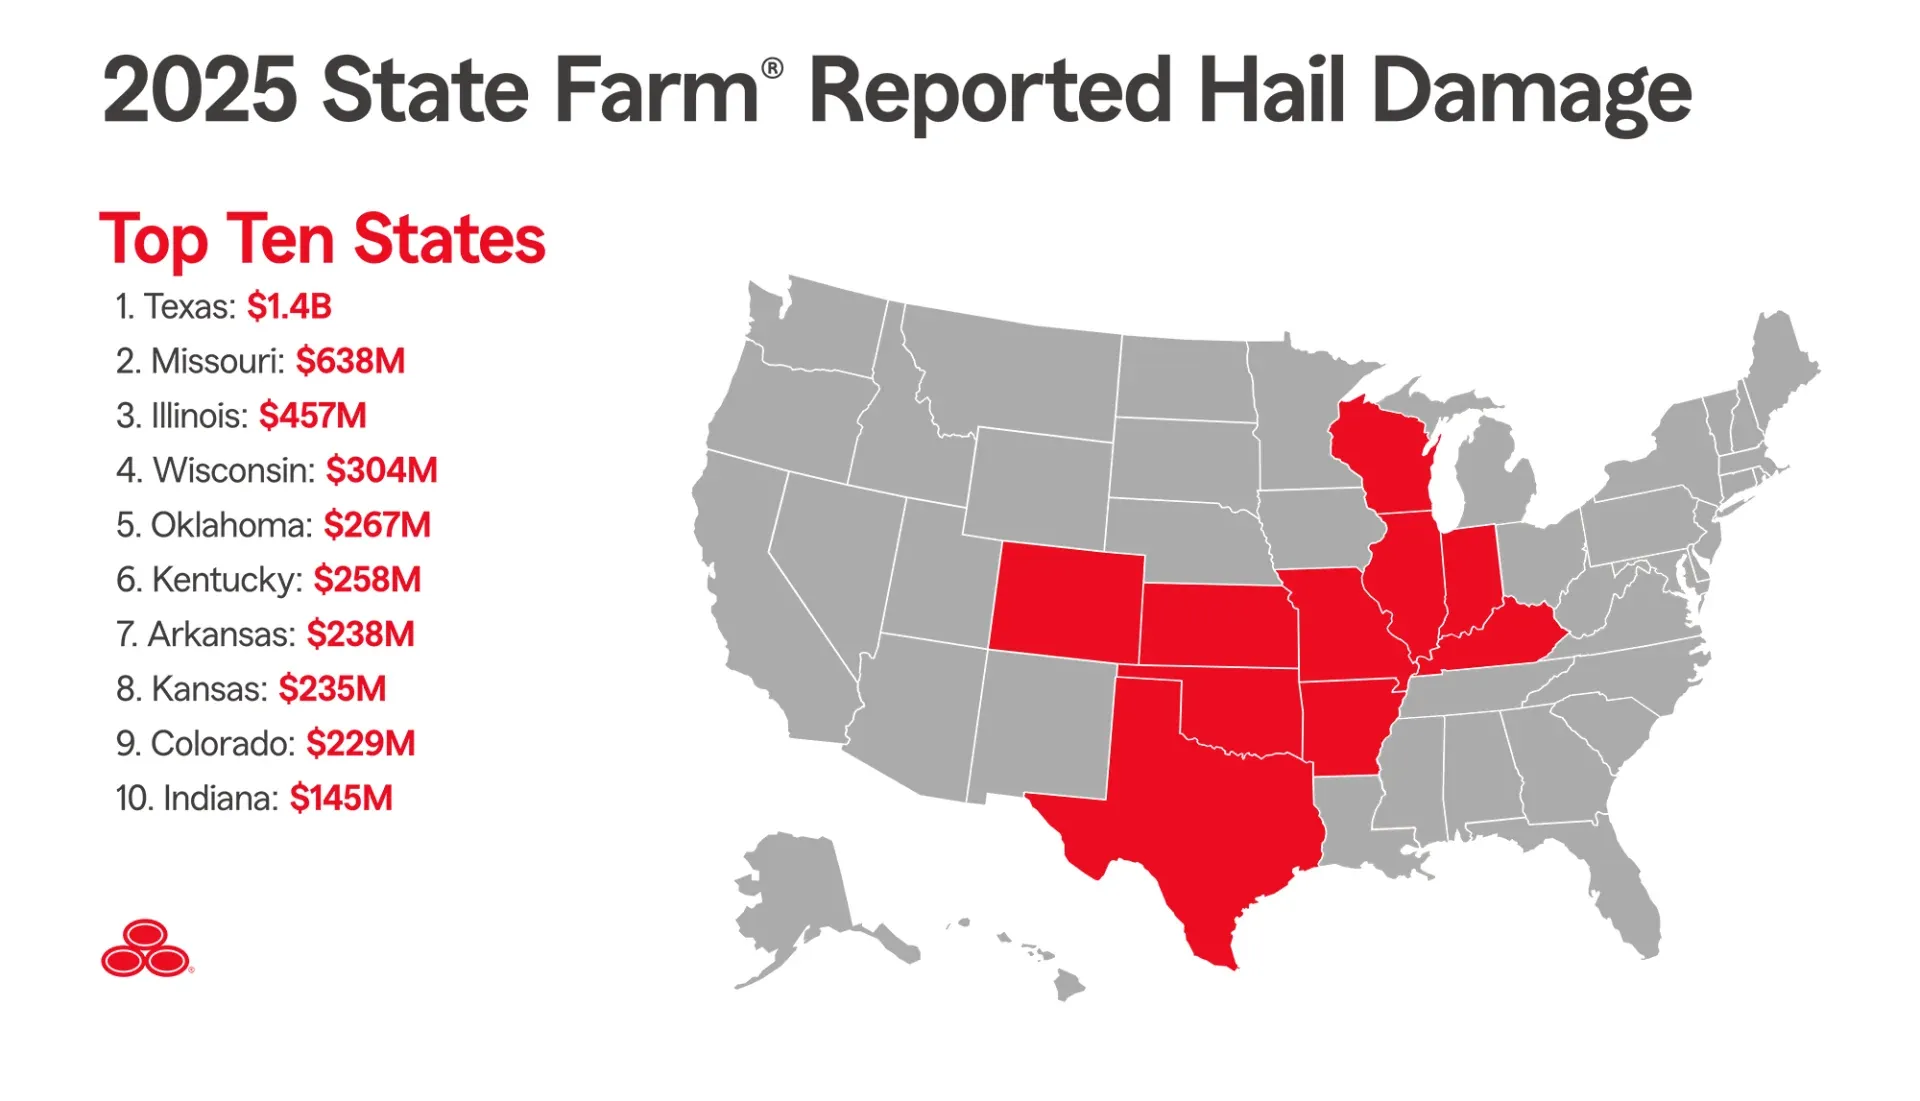 Figure 4: Hail claims paid by the largest US home insurer cluster in the Plains and Midwest, with Texas far ahead of every other state. Source: State Farm, hail claims report, Apr 2026. Chart published by the source, captured 20 Oct 2026.
How much did severe storms cost insurers in 2025?
Severe convective storms mean hail, straight-line winds, tornadoes and thunderstorms. Roofs take most of the damage.
- Total economic damage from these storms passed $68 billion in 2025 (Triple-I, Apr 2026).
- Hail alone causes as much as 80% of severe storm claims in a given year (Triple-I, Apr 2026).
- Roofs bear an estimated 70% to 90% of insured residential catastrophe losses (Triple-I, Apr 2026).
- A record 300 tornadoes in March 2025 generated $8.4 billion in insured losses (Triple-I, Apr 2026).
- Swiss Re counted $46 billion of insured storm losses for North America in 2025, the third costliest year on record (Swiss Re Institute, Apr 2026).
- North America’s insured natural catastrophe losses were $90 billion in 2025, down from $117 billion in 2024 (Swiss Re Institute, Apr 2026).
How is 2026 compared with earlier years?
The first half of 2026 was quieter for insurers, even though storm activity was high. That matters for roofers because insured losses fund replacements.
- Swiss Re put first-half 2026 storm losses at $28 billion, the lowest since 2021 (Swiss Re Institute, Aug 2026).
- That ended four straight years of first-half losses above $30 billion (Swiss Re Institute, Aug 2026).
- Global insured catastrophe losses of $42 billion were the lowest for a first half since 2020 (Swiss Re Institute, Aug 2026).
- The April 23 to 29 outbreak was the costliest event of the half, at more than $5 billion (Aon, Jul 2026).
- Illinois saw about four times its long-term average of tornadoes (Aon, Jul 2026).
- The US had 11 billion-dollar insured disasters in the half (Aon, Jul 2026).
- US natural disasters made up $36 billion of insured losses, 75% of the world total (Aon, Jul 2026).
Where does hail hit hardest?
State Farm is the largest US home insurer, and its payouts show where roofs get damaged.
- State Farm paid more than $5.6 billion in hail claims in 2025 (State Farm, Apr 2026).
- Texas alone took $1.4 billion (State Farm, Apr 2026).
- Missouri followed with $638 million (State Farm, Apr 2026).
- Illinois was third at $457 million (State Farm, Apr 2026).
- March 2026 storms produced over 50,000 Midwest claims (State Farm, Apr 2026).
- On March 10 alone, the National Weather Service logged more than 650 hail events across nine states (State Farm, Apr 2026).
Which roof types and storm upgrades are growing?
Asphalt shingles still rule, but buyers and insurers now care more about how a roof performs in a storm. That shift creates upgrade work for contractors who know the standards.
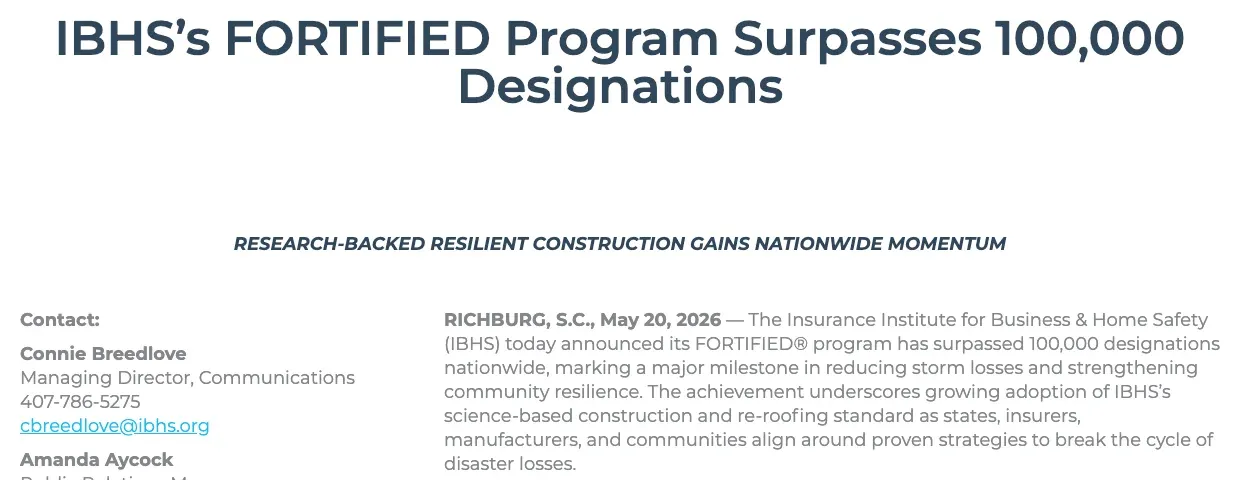 Figure 5: IBHS announced that its FORTIFIED storm-resistant construction and re-roofing standard passed 100,000 designations, a sign that roofing upgrades are moving into the mainstream. Source: IBHS, FORTIFIED milestone release, May 2026. Screenshot of the source page, captured 20 Oct 2026.
What are US roofs made of?
Shingles cover three of every four homes. Metal is the main alternative.
- Metal is the main roofing material on 9.4% of US homes (EIA, Residential Energy Consumption Survey, May 2026).
- Ceramic or clay tile covers 4.7% (EIA, Residential Energy Consumption Survey, May 2026).
- Concrete tile covers 3.5% (EIA, Residential Energy Consumption Survey, May 2026).
- Wood shingles or shakes cover 3.2% (EIA, Residential Energy Consumption Survey, May 2026).
- Slate or synthetic slate covers 1.5% (EIA, Residential Energy Consumption Survey, May 2026).
- 69% of homeowners in a trade-magazine survey said they have asphalt shingles (Roofing Contractor, 2026 homeowner survey, Jan 2026).
Do impact-resistant shingles and FORTIFIED roofs work?
IBHS tests shingles with lab-made hailstones and runs the FORTIFIED program. Both are now part of how insurers and states talk about roofs.
- IBHS tested a record 24 impact-resistant shingle products in 2025 (IBHS, hail impact-resistant shingle ratings, Nov 2025).
- Those products represent about 95% of impact-resistant shingles sold each year (IBHS, hail impact-resistant shingle ratings, Nov 2025).
- Most earned a Good rating and none earned Excellent (IBHS, hail impact-resistant shingle ratings, Nov 2025).
- FORTIFIED passed 100,000 designations nationwide (IBHS, FORTIFIED milestone release, May 2026).
- More than half of all designations came in the last three years (IBHS, FORTIFIED milestone release, May 2026).
- Every $1 spent on hazard mitigation can save up to $33 in future disaster costs (Triple-I, Apr 2026).
Are metal and solar roofing growing?
Fewer contractors sold metal roofing in the latest survey, while more worked with solar. Homeowners are curious about solar but few have it.
- 67% of contractors sold metal roofing in 2025, down from 79% the year before (Roofing Contractor, 2026 State of the Industry, Jan 2026).
- 41% of contractors worked with solar, and it averaged 5% of their sales (Roofing Contractor, 2026 State of the Industry, Jan 2026).
- 9% of homeowners surveyed have solar panels on the roof (Roofing Contractor, 2026 homeowner survey, Jan 2026).
- 35% said they are interested in roof-mounted panels (Roofing Contractor, 2026 homeowner survey, Jan 2026).
- Wind and hail resistant shingles made up 28% of residential contractors’ shingle sales (Roofing Contractor, 2025 State of the Industry, Feb 2025).
How many roofs need work, and what do homeowners spend?
Plenty of roofs are failing, and roofing is the most common big exterior project. Most owners hire it out.
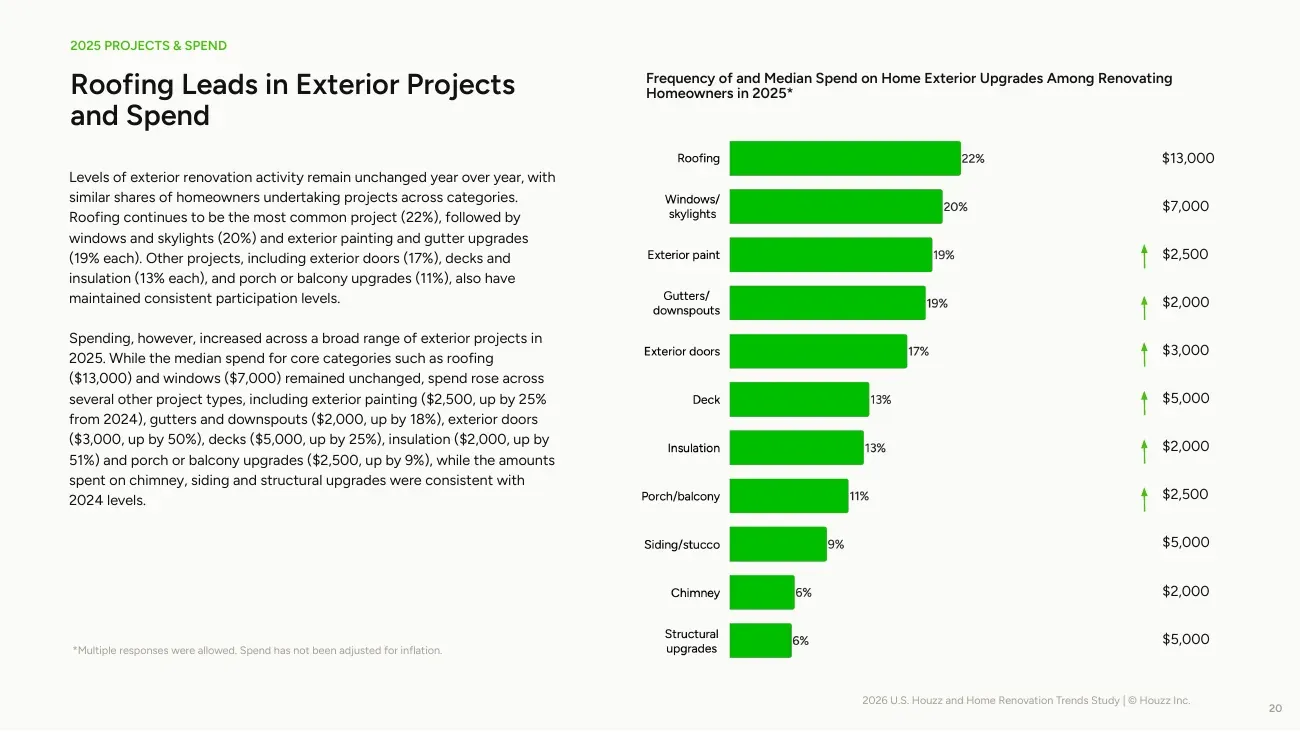 Figure 6: Roofing was the most common exterior project among renovating homeowners in 2025 and carried the highest median spend of any exterior upgrade. Source: Houzz, 2026 U.S. Houzz and Home Renovation Trends Study, Apr 2026. Screenshot of page 20 of the report, captured 20 Oct 2026.
How many US roofs have problems?
The American Housing Survey asks owners and renters about roof damage. These counts come from our tabulation of the public survey file.
- 3.46 million homes had missing shingles or other missing roofing (Census Bureau, American Housing Survey, Jan 2025).
- 1.46 million had holes in the roof (Census Bureau, American Housing Survey, Jan 2025).
- 1.88 million had a sagging or uneven roof surface (Census Bureau, American Housing Survey, Jan 2025).
- 63.2 million occupied homes were built before 1980 (EIA, Residential Energy Consumption Survey, May 2026).
- 20.2 million were built before 1950 (EIA, Residential Energy Consumption Survey, May 2026).
How common are roofing projects?
Roofing is not a small purchase. It is the most common exterior project, and most owners hire it out.
- 22% of renovating homeowners did a roofing project in 2025, the most common exterior project (Houzz, Apr 2026).
- Windows and skylights came next at 20% (Houzz, Apr 2026).
- Exterior painting and gutter work were each at 19% (Houzz, Apr 2026).
- Siding and stucco were at 9% (Houzz, Apr 2026).
What do roofing industry marketing statistics say about finding a roofer?
Word of mouth beats search, and search beats social media. The homeowner survey from Roofing Contractor shows where leads come from.
- 74% of homeowners find roofers by word of mouth (Roofing Contractor, 2026 homeowner survey, Jan 2026).
- 62% go back to a contractor they already know (Roofing Contractor, 2026 homeowner survey, Jan 2026).
- 54% use online search (Roofing Contractor, 2026 homeowner survey, Jan 2026).
- 25% use social media and 11% use AI search results (Roofing Contractor, 2026 homeowner survey, Jan 2026).
- 88% of contractors start jobs within two weeks of an accepted quote (Roofing Contractor, 2026 homeowner survey, Jan 2026).
- About a third of contractors (33%) show no pricing at all on their websites (Roofing Contractor, 2026 homeowner survey, Jan 2026).
What does it cost to run a roofing company?
Materials are the biggest cost, and margins are thin. Owners who price jobs from guesses lose money on the work they win.
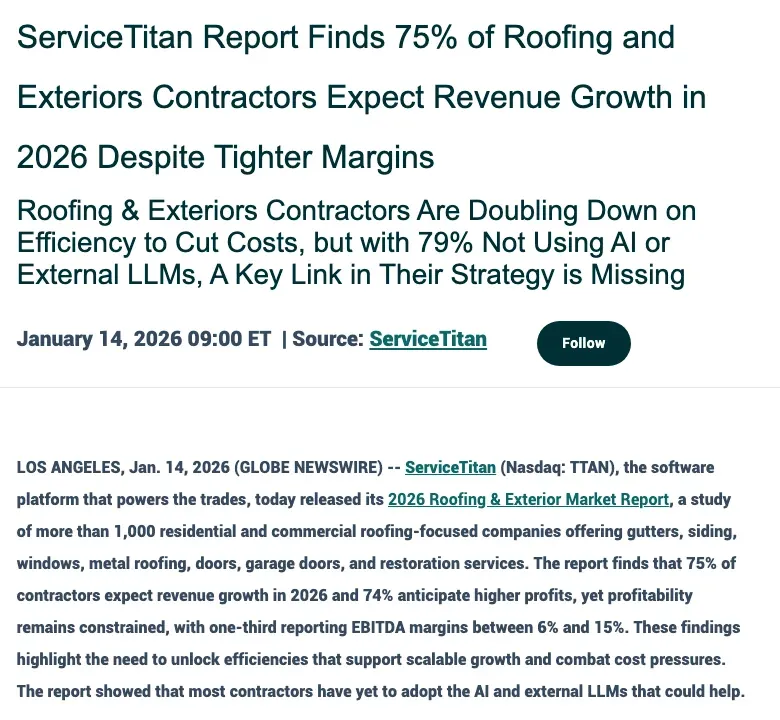 Figure 7: ServiceTitan’s survey of more than 1,000 roofing and exterior companies found most expect more revenue, yet one third report EBITDA margins of only 6% to 15%. Source: ServiceTitan, 2026 Roofing and Exterior Market Report announcement, Jan 2026. Screenshot of the source page, captured 20 Oct 2026.
Where does the money go?
The Economic Census lists what roofing companies spend. Materials are the largest line by far.
- Roofing contractors spent $25.8 billion on materials (Census Bureau, Economic Census, Dec 2024).
- They paid $6.01 billion to subcontractors (Census Bureau, Economic Census, Dec 2024).
- Fringe benefits cost $3.43 billion (Census Bureau, Economic Census, Dec 2024).
- Gasoline and diesel cost $1.08 billion (Census Bureau, Economic Census, Dec 2024).
- Advertising and promotion cost $508 million (Census Bureau, Economic Census, Dec 2024).
- Software purchases cost $154 million (Census Bureau, Economic Census, Dec 2024).
How profitable is roofing?
Contractors are optimistic about sales and worried about costs. Profit pressure comes from labor, overhead and materials.
- 75% of contractors expect revenue growth in 2026 and 74% expect higher profits (ServiceTitan, Jan 2026).
- One third report EBITDA margins between 6% and 15% (ServiceTitan, Jan 2026).
- 39% name rising labor and overhead costs as the top threat (ServiceTitan, Jan 2026).
- 60% are focused on optimizing labor costs and 45% on material costs (ServiceTitan, Jan 2026).
- 38% of contractors in the trade magazine’s survey worry about material costs (Roofing Contractor, 2026 State of the Industry, Jan 2026).
- Labor costs rose an average of 14% for contractors who saw an increase (Roofing Contractor, 2026 State of the Industry, Jan 2026).
- 35% of residential contractors name low-ball pricing from competitors as a top challenge (Roofing Contractor, 2025 State of the Industry, Feb 2025).
What does a typical roofing workforce look like?
Subcontractors carry a large share of the work.
- Roofing companies’ workforces are 54% full-time employees on average (Roofing Contractor, 2026 State of the Industry, Jan 2026).
- Subcontractors make up 29% of the workforce (Roofing Contractor, 2026 State of the Industry, Jan 2026).
- Roofing contractors spent $207 million on temporary and leased staff (Census Bureau, Economic Census, Dec 2024).
How are roofing contractors using technology and planning for growth?
Roofers are adopting estimating, measuring and AI tools, but unevenly. The data also shows gaps in follow-up speed and in showing prices online.
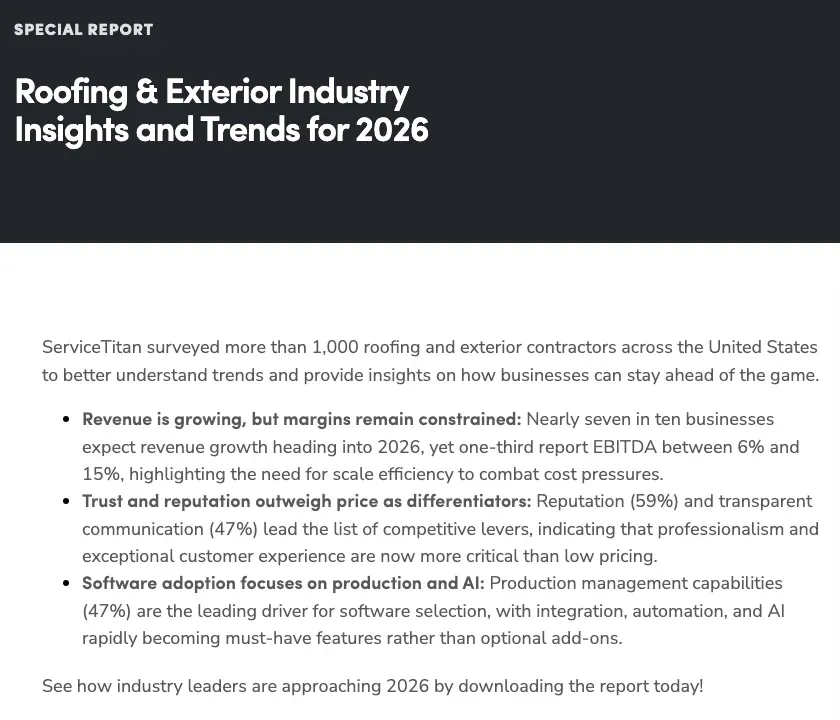 Figure 8: ServiceTitan’s roofing report says reputation and clear communication now matter more than low price, and that production tools lead software buying decisions. Source: ServiceTitan, Roofing and Exterior Industry Insights and Trends for 2026, Jan 2026. Screenshot of the source page, captured 20 Oct 2026.
Which tools do roofers use?
Accounting and estimating software are the most common business tools in the trade magazine’s survey. Newer tools are following.
- 63% of contractors use estimating software (Roofing Contractor, 2026 State of the Industry, Jan 2026).
- 67% use enterprise or accounting software (Roofing Contractor, 2026 State of the Industry, Jan 2026).
- 71% of residential roofers use estimating software in the 2025 survey (Roofing Contractor, 2025 State of the Industry, Feb 2025).
- 61% use aerial measurement tools (Roofing Contractor, 2025 State of the Industry, Feb 2025).
- 54% use drones (Roofing Contractor, 2025 State of the Industry, Feb 2025).
Are roofers using AI?
AI use is rising fast, though most of it is generic chat tools rather than features built into business software.
- 40% of contractors use AI, up from 29% a year earlier (Roofing Contractor, 2026 State of the Industry, Jan 2026).
- 25% use outside large language model tools such as ChatGPT or Gemini (ServiceTitan, Jan 2026).
- Only 4% use AI features built into their CRM (ServiceTitan, Jan 2026).
What do roofers expect next?
Sentiment is upbeat, with one new worry: government rules.
- 78% expect sales to rise in 2026 (Roofing Contractor, 2026 State of the Industry, Jan 2026).
- 89% expect sales to rise over the next three years (Roofing Contractor, 2026 State of the Industry, Jan 2026).
- Concern about government intervention and regulation jumped from 11% to 29% (Roofing Contractor, 2026 State of the Industry, Jan 2026).
- 61% of commercial contractors name the lack of qualified workers as an issue (Roofing Contractor, 2025 State of the Industry, Feb 2025).
What wins jobs in roofing?
Roofers say trust beats price. Insurance work adds a layer of delay.
- 59% name reputation as their top differentiator (ServiceTitan, Jan 2026).
- 47% name transparent communication (ServiceTitan, Jan 2026).
- 40% of contractors do insurance work (ServiceTitan, Jan 2026).
- 47% of them cite claims complexity as a challenge (ServiceTitan, Jan 2026).
- 36% cite adjuster delays (ServiceTitan, Jan 2026).
- Production management is the top software buying driver, at 47% (ServiceTitan, Jan 2026).
Methodology and Sources
We picked statistics from agencies, regulators, trade bodies and research groups that produced the data, and we opened every link before using it. Where a source publishes data files rather than a written finding, we tabulated the file ourselves: the American Housing Survey counts of roof problems and roofing jobs, and the Residential Energy Consumption Survey counts of roof material and home age. Contractor survey results come from trade-magazine and software-vendor surveys, so they describe the roofing companies that answered, not every company. Money figures are nominal US dollars. We refresh the page every month.
Glossary
- NAICS 238160: the industry code for roofing contractors.
- Establishment: one business location. A firm can have several.
- QCEW: the BLS Quarterly Census of Employment and Wages, a count of jobs and pay from unemployment insurance records.
- OEWS: the BLS Occupational Employment and Wage Statistics survey.
- CFOI: the BLS Census of Fatal Occupational Injuries.
- Severe convective storm: a storm that brings hail, damaging straight-line wind or tornadoes.
- Square: 100 square feet of roof area, the unit used for shingle shipments.
- BUR: built-up roofing, a layered flat-roof system.
- Modified bitumen: a rolled asphalt membrane used on low-slope roofs.
- EBITDA: earnings before interest, taxes, depreciation and amortization, a measure of operating profit.
- FORTIFIED: the IBHS storm-resistant construction and re-roofing standard.
- IBHS: the Insurance Institute for Business and Home Safety.
Sources
- Aon
- ARMA, Q1 2026 shipment report
- ARMA, Q2 2026 shipment report
- ARMA, Q4 2025 shipment report
- BLS, Census of Fatal Occupational Injuries
- BLS, Census of Fatal Occupational Injuries release
- BLS, Current Population Survey
- BLS, Current Population Survey
- BLS, Current Population Survey
- BLS, Occupational Employment and Wage Statistics
- BLS, Occupational Outlook Handbook
- BLS, Producer Price Index
- BLS, Producer Price Index
- BLS, Producer Price Index
- BLS, Producer Price Index
- BLS, QCEW
- BLS, QCEW 2019
- BLS, QCEW first quarter 2025
- BLS, QCEW fourth quarter 2025
- BLS, QCEW third quarter 2025
- BLS, Survey of Occupational Injuries and Illnesses
- Census Bureau, American Housing Survey
- Census Bureau, County Business Patterns
- Census Bureau, County Business Patterns 2018
- Census Bureau, County Business Patterns 2023
- Census Bureau, County Business Patterns 2023 by state
- Census Bureau, Economic Census
- Census Bureau, Economic Census kind of business
- Census Bureau, Economic Census manufacturing
- Census Bureau, Economic Census work by state
- Census Bureau, Statistics of US Businesses
- EIA, Residential Energy Consumption Survey
- Houzz
- IBHS, FORTIFIED milestone release
- IBHS, hail impact-resistant shingle ratings
- Roofing Contractor, 2025 State of the Industry
- Roofing Contractor, 2026 homeowner survey
- Roofing Contractor, 2026 State of the Industry
- ServiceTitan
- ServiceTitan, Roofing and Exterior Industry Insights and Trends for 2026
- State Farm
- Swiss Re Institute
- Swiss Re Institute
- Triple-I