Home remodeling statistics show an industry that is large, steady and a little soft in 2026. Owners spend hundreds of billions of dollars a year on the homes they already have. They pick the jobs that pay back, hire pros for the big ones and watch the price of every board and wage.
Every number here comes from the group that produced it: the Census Bureau, the National Association of Home Builders, Zonda’s Cost vs. Value report, the National Association of Realtors, Houzz, the National Kitchen & Bath Association and the Bureau of Labor Statistics. We do not cite roundups. Where two groups measure different things, we say so. A remodel can mean a kitchen gut job or a new garage door, and the sources do not always count the same way.
The newest government count covers 2025. The newest surveys run through October 2026. The Cost vs. Value and Realtor resale reports are the 2025 editions, the latest published. Use this page for project costs, resale value, who pays and what it costs the contractor to do the work. For total owner spending and do-it-yourself versus pro work, see home improvement statistics. For firm counts, see home improvement industry statistics. This page is updated monthly.
Key Takeaways
- Owners spent $383.8 billion on private residential improvements in 2025, the highest yearly total since 2012. (Census Bureau, Value of Construction Put in Place, Jul 2026)
- Remodeling spending has been larger than single-family construction spending for seven straight quarters. (NAHB Eye on Housing, State Projections of Remodeling, Aug 2026)
- Homeowners spent about $670 billion on remodeling in 2024, and 23% of owner households reported a project. (NAHB Eye on Housing, Who Drives Remodeling Spending, May 2026)
- Remodeling spending rose 2.5% in August 2026 but was down 7.4% from a year earlier. (NAHB Eye on Housing, Construction Spending, Oct 2026)
- A garage door replacement recouped 268% of its cost at resale, the best return of 28 projects. (Zonda, Cost vs. Value Report, Sep 2025)
- An upscale primary suite addition costing $351,613 recouped 18%, the worst return of the 28. (Zonda, Cost vs. Value Report, Sep 2025)
- A new steel front door recovered 100% of its cost, the top result in the Realtor and NARI report. (NAR, 2025 Remodeling Impact Report, Apr 2025)
- A primary suite addition, a kitchen upgrade and new roofing each earned a 10 out of 10 joy score from owners. (NAR, 2025 Remodeling Impact Report, Apr 2025)
- The median kitchen remodel cost $24,000 in 2025, up from $22,000. (Houzz, 2026 U.S. Houzz and Home Renovation Trends Study, Apr 2026)
- Owners spend 9.5 months planning a kitchen and 5.8 months building it. (Houzz, 2026 U.S. Houzz and Home Renovation Trends Study, Apr 2026)
- Professional kitchen and bath renovation spending is forecast to grow 4.4% in 2026, against 0.6% for do-it-yourself. (NKBA, 2026 Kitchen & Bath Industry Outlook, Feb 2026)
- Remodelers’ average net profit margin hit 6.3% in 2024, the highest since 1996. (NAHB Eye on Housing, Remodelers Saw Profit Margin Gains in 2024, Apr 2026)
- Nonlabor input costs for remodelers rose 6.6% in the year to the second quarter of 2026, the 11th straight quarterly rise. (NAHB Eye on Housing, Q2 2026 Remodeling Market Update, Sep 2026)
How big is the home remodeling industry?
Big enough to outweigh new single-family building, and no longer growing fast. The climb since 2012 reached a high in 2025 and has slipped in 2026.
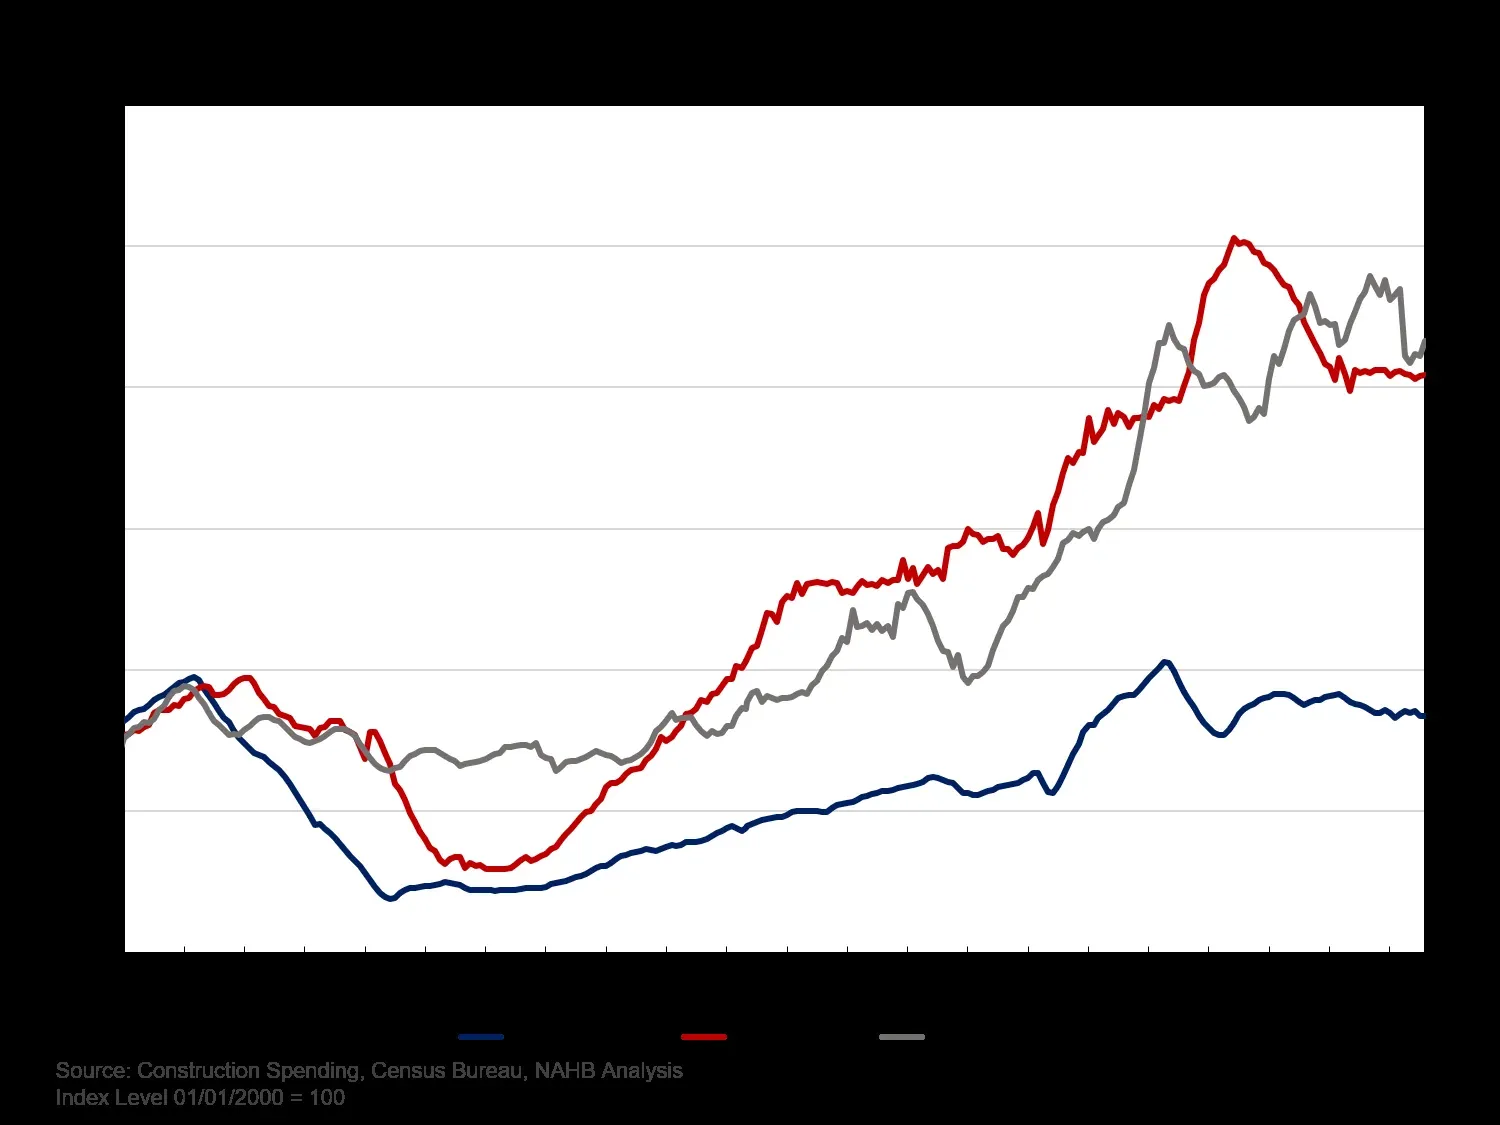 Figure 1: Improvement spending (gray line) has grown faster than single-family spending (blue line) since 2000, and it has slipped from its early 2026 peak. The index sets January 2000 at 100. Source: NAHB analysis of Census Bureau construction spending, NAHB Eye on Housing, Oct 2026. Chart published by the source, captured 20 Oct 2026.
How much do owners spend on improvements each year?
The Census Bureau counts private residential improvements to owner-occupied homes. It leaves out rentals, vacant homes and seasonal homes.
- Improvement spending was $115.3 billion in 2012 (Census Bureau, Value of Construction Put in Place 2012 to 2021, Jan 2025).
- It reached $269.2 billion in 2021 (Census Bureau, Value of Construction Put in Place 2012 to 2021, Jan 2025).
- It was $354.8 billion in 2022 and fell to $330.7 billion in 2023 (Census Bureau, Value of Construction Put in Place, Jul 2026).
- It rose to $371.2 billion in 2024 (Census Bureau, Value of Construction Put in Place, Jul 2026).
- Census says the series does not include spending on rental, vacant or seasonal properties (Census Bureau, Value of Construction Put in Place, Jul 2026).
How does remodeling compare with new homes?
NAHB estimates remodeling by state from national Census data. Its quarterly figures are seasonally adjusted annual rates.
- Remodeling spending was $274.7 billion in the first quarter of 2026, the third straight quarterly fall (NAHB Eye on Housing, State Projections of Remodeling, Aug 2026).
- Remodeling made up 37.7% of private residential fixed investment (NAHB Eye on Housing, State Projections of Remodeling, Aug 2026).
- The fourth quarter of 2025 came in at $280.1 billion, and the third quarter of 2025 at $282.6 billion (NAHB Eye on Housing, NAHB Debuts State Remodeling Resource, May 2026).
Which states remodel the most?
Population explains most of it. NAHB found a 0.97 correlation between state remodeling spending and Census population estimates.
- California led with 8.0% of spending, or $22.2 billion, then Texas at 7.3%, or $20.2 billion (NAHB Eye on Housing, State Projections of Remodeling, Aug 2026).
- Florida had 5.5%, or $15.4 billion, and New York 4.0%, or $11.2 billion (NAHB Eye on Housing, State Projections of Remodeling, Aug 2026).
- California, Texas and Florida together took over 20% of spending, or $57.8 billion (NAHB Eye on Housing, State Projections of Remodeling, Aug 2026).
- The top 10 states took over 40% of fourth quarter 2025 spending, or $114.5 billion (NAHB Eye on Housing, NAHB Debuts State Remodeling Resource, May 2026).
- Ten states had falling spending in the first quarter of 2026, up from five a quarter earlier (NAHB Eye on Housing, State Projections of Remodeling, Aug 2026).
What do remodeling projects cost?
A job’s price depends on what you count. Zonda reports the average cost of 28 defined projects, and Houzz reports the median that owners say they spent. The two do not match, and neither is wrong.
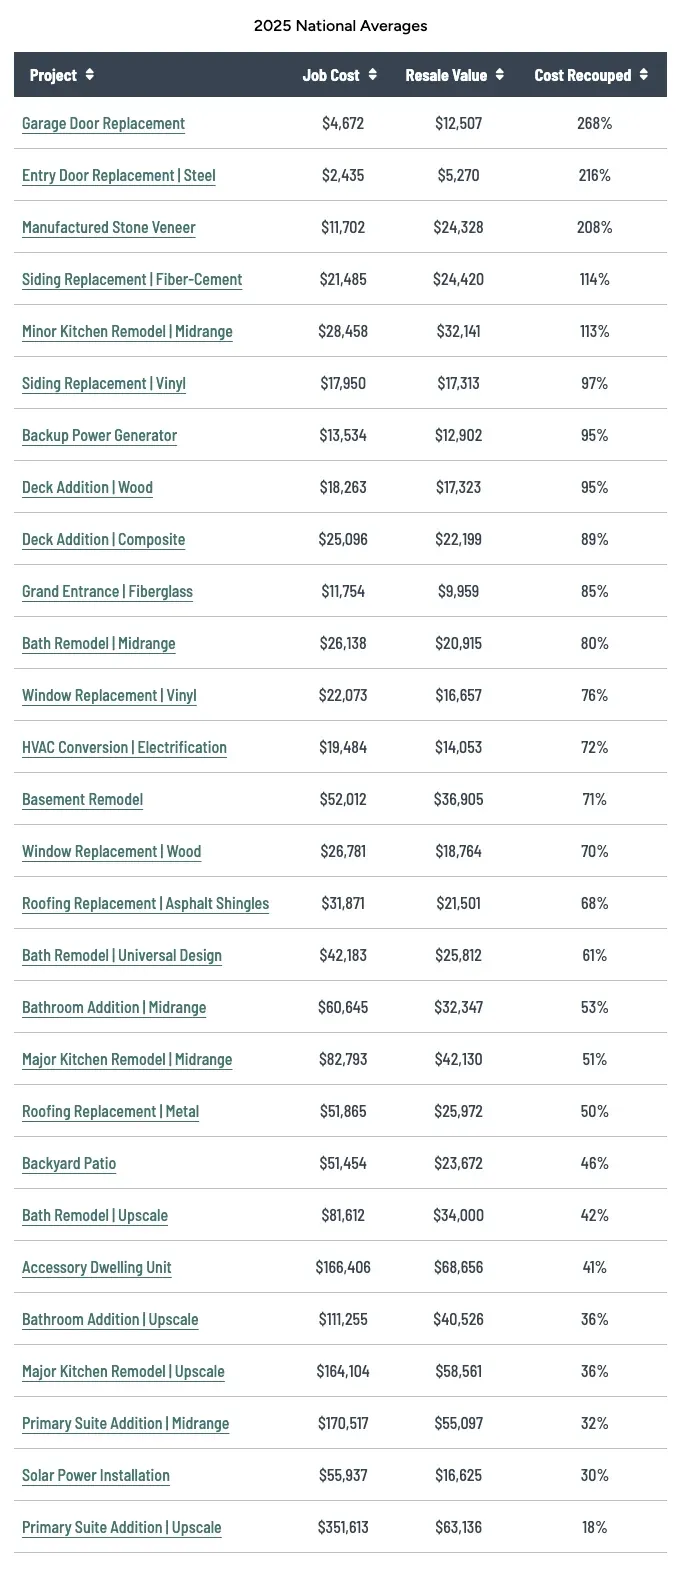 Figure 2: Costs run from a door to a whole new suite, so a single “average remodel” price means little. Source: Zonda, Cost vs. Value Report 2025, Sep 2025. Screenshot of the source page, captured 20 Oct 2026.
What do exterior projects cost?
Zonda compares the average cost of 28 projects with their value at resale.
- A vinyl siding replacement cost $17,950 and a fiber-cement one $21,485 (Zonda, Cost vs. Value Report, Sep 2025).
- An asphalt shingle roof replacement cost $31,871 and a metal roof $51,865 (Zonda, Cost vs. Value Report, Sep 2025).
- Vinyl window replacement cost $22,073 and wood window replacement $26,781 (Zonda, Cost vs. Value Report, Sep 2025).
- A wood deck addition cost $18,263 and a composite deck $25,096 (Zonda, Cost vs. Value Report, Sep 2025).
- A garage door replacement cost $4,672, a steel entry door $2,435 and manufactured stone veneer $11,702 (Zonda, Cost vs. Value Report, Sep 2025).
What do systems and big additions cost?
- An HVAC electrification conversion cost $19,484 and a backup power generator $13,534 (Zonda, Cost vs. Value Report, Sep 2025).
- A basement remodel cost $52,012 and a backyard patio $51,454 (Zonda, Cost vs. Value Report, Sep 2025).
- An accessory dwelling unit cost $166,406 and a solar power installation $55,937 (Zonda, Cost vs. Value Report, Sep 2025).
- A midrange primary suite addition cost $170,517 (Zonda, Cost vs. Value Report, Sep 2025).
What do owners say they paid for smaller jobs?
Houzz reports the median spend owners gave for each project type in 2025.
- The median roofing job cost $13,000 and the median window job $7,000 (Houzz, 2026 U.S. Houzz and Home Renovation Trends Study, Apr 2026).
- Decks had a $5,000 median, and exterior doors $3,000, up 50% in a year (Houzz, 2026 U.S. Houzz and Home Renovation Trends Study, Apr 2026).
- Exterior painting had a $2,500 median, up 25%, and gutters and downspouts $2,000, up 18% (Houzz, 2026 U.S. Houzz and Home Renovation Trends Study, Apr 2026).
- Insulation had a $2,000 median, up 51% (Houzz, 2026 U.S. Houzz and Home Renovation Trends Study, Apr 2026).
- Living rooms had a $5,000 median, laundry rooms $3,000 and dining rooms $2,500 (Houzz, 2026 U.S. Houzz and Home Renovation Trends Study, Apr 2026).
- Home offices had a $2,000 median, up from $1,300, and closets $1,000, down from $1,250 (Houzz, 2026 U.S. Houzz and Home Renovation Trends Study, Apr 2026).
- Ventilation work had a $600 median, and water treatment and entertainment systems $1,500 each (Houzz, 2026 U.S. Houzz and Home Renovation Trends Study, Apr 2026).
- Renovating owners averaged 2.7 interior room projects and 2.8 system upgrades (Houzz, 2026 U.S. Houzz and Home Renovation Trends Study, Apr 2026).
Which remodeling projects pay back at resale?
Small, visible exterior jobs win. The biggest interior jobs return about half their cost or less, which is fine if the owner plans to stay.
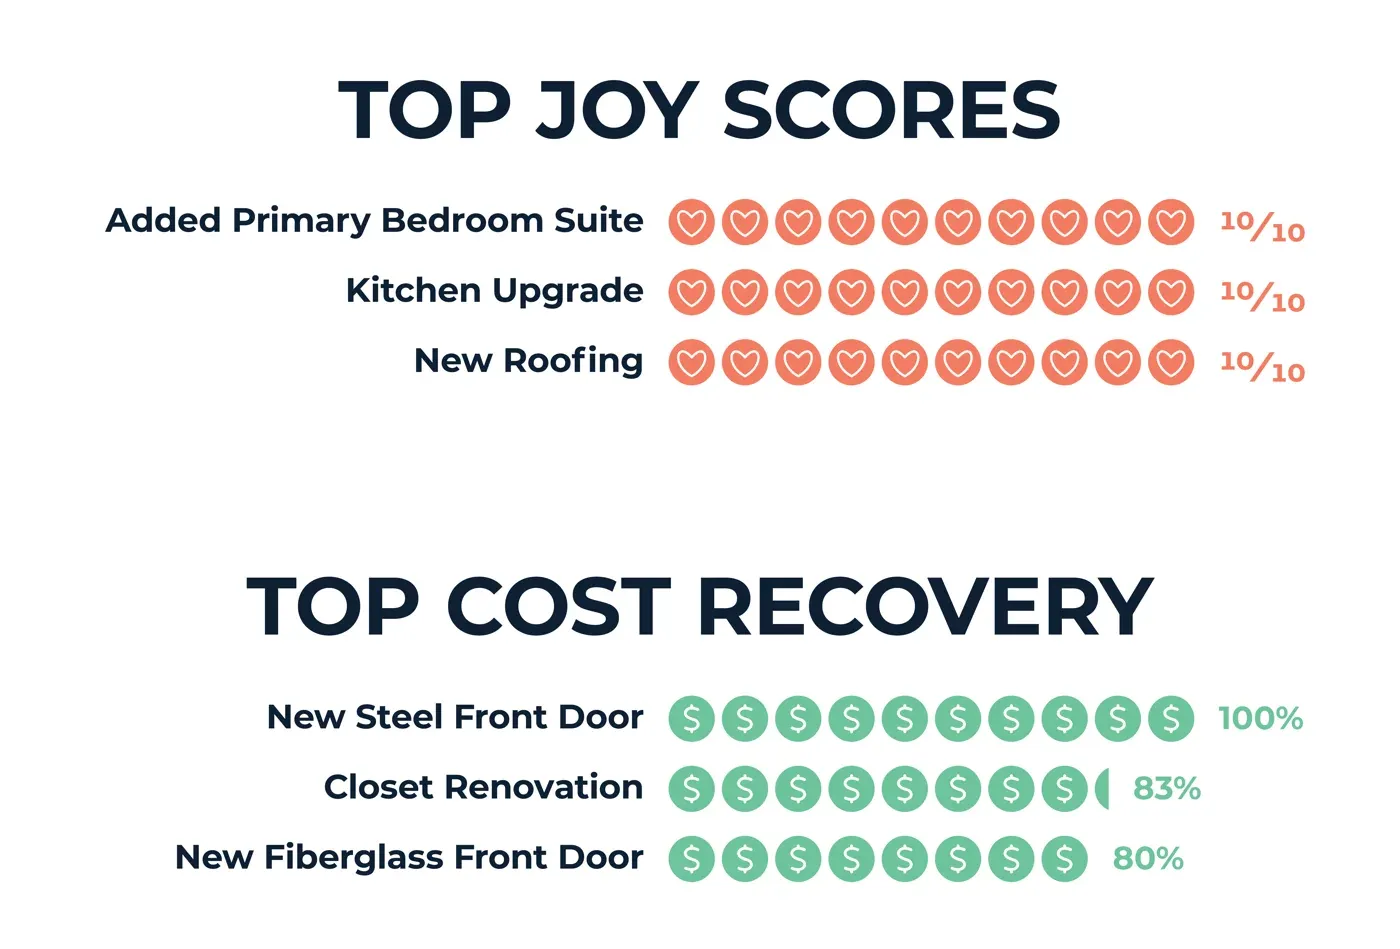 Figure 3: The projects owners love most (primary suite, kitchen, roof) are not the ones that recover the most cost (steel door, closet, fiberglass door). Source: NAR and NARI, 2025 Remodeling Impact Report, Apr 2025. Chart published by the source, cropped and captured 20 Oct 2026.
Which projects recoup more than they cost?
Zonda’s figures use a resale value from surveys of real estate professionals.
- Eight of the top 10 projects were exterior replacements (Zonda, 2025 Cost vs. Value Report, Sep 2025).
- A steel entry door recouped 216% and manufactured stone veneer 208% (Zonda, Cost vs. Value Report, Sep 2025).
- Fiber-cement siding recouped 114% and a midrange minor kitchen remodel 113% (Zonda, Cost vs. Value Report, Sep 2025).
- A backup generator entered the top 10 for the first time, and its return topped 100% in hurricane-prone and storm-affected regions (Zonda, 2025 Cost vs. Value Report, Sep 2025).
- The Pacific and West South-Central regions had the strongest overall returns (Zonda, 2025 Cost vs. Value Report, Sep 2025).
Which projects return the least?
The biggest projects sit at the bottom of the table.
- A midrange major kitchen remodel recouped 51% of $82,793, and an upscale one 36% of $164,104 (Zonda, Cost vs. Value Report, Sep 2025).
- A midrange primary suite addition recouped 32% (Zonda, Cost vs. Value Report, Sep 2025).
- An accessory dwelling unit recouped 41% and a solar installation 30% (Zonda, Cost vs. Value Report, Sep 2025).
- Zonda said basement remodels proved the most consistent of the newly added projects nationwide (Zonda, 2025 Cost vs. Value Report, Sep 2025).
- A basement remodel recouped 71%, HVAC electrification 72% and an asphalt roof 68% (Zonda, Cost vs. Value Report, Sep 2025).
What do Realtors say about cost recovery?
NARI members estimated the cost and Realtors estimated resale value. The two groups do not use the same project list as Zonda.
- A closet renovation recovered 83% and a new fiberglass front door 80% (NAR, 2025 Remodeling Impact Report, Apr 2025).
- New vinyl windows recovered 74%, new wood windows 71% and a basement conversion 71% (NAR, 12 Remodeling Projects That Offer the Best Value at Resale, Apr 2025).
- An attic conversion recovered 67%, and a complete kitchen renovation and a minor kitchen upgrade each recovered 60% (NAR, 12 Remodeling Projects That Offer the Best Value at Resale, Apr 2025).
- A bathroom addition recovered 56%, a new primary suite 54% and a bathroom renovation 50% (NAR, 12 Remodeling Projects That Offer the Best Value at Resale, Apr 2025).
What do agents tell sellers to do first?
- Realtors most often recommended painting the whole home, at 50% (NAR, 2025 Remodeling Impact Report, Apr 2025).
- 41% recommended painting one interior room, and 37% a new roof (NAR, 2025 Remodeling Impact Report, Apr 2025).
- Realtors saw more demand for kitchen upgrades (48%), new roofing (43%) and bathroom renovations (35%) over two years (NAR, 2025 Remodeling Impact Report, Apr 2025).
- 46% of home buyers say they are less willing to compromise on the condition of the home they buy (NAR, 12 Remodeling Projects That Offer the Best Value at Resale, Apr 2025).
How do owners feel after a remodel?
- 64% of owners wanted to be at home more after a project, and 46% enjoyed their living space more (NAR, 2025 Remodeling Impact Report, Apr 2025).
- If cost were no object, 92% of owners said they would remodel more areas (NAR, 2025 Remodeling Impact Report, Apr 2025).
What do kitchen and bathroom remodels cost?
Kitchens and baths carry the widest price spread of any room. A shop that quotes both from one flat number will be wrong on one side of the range.
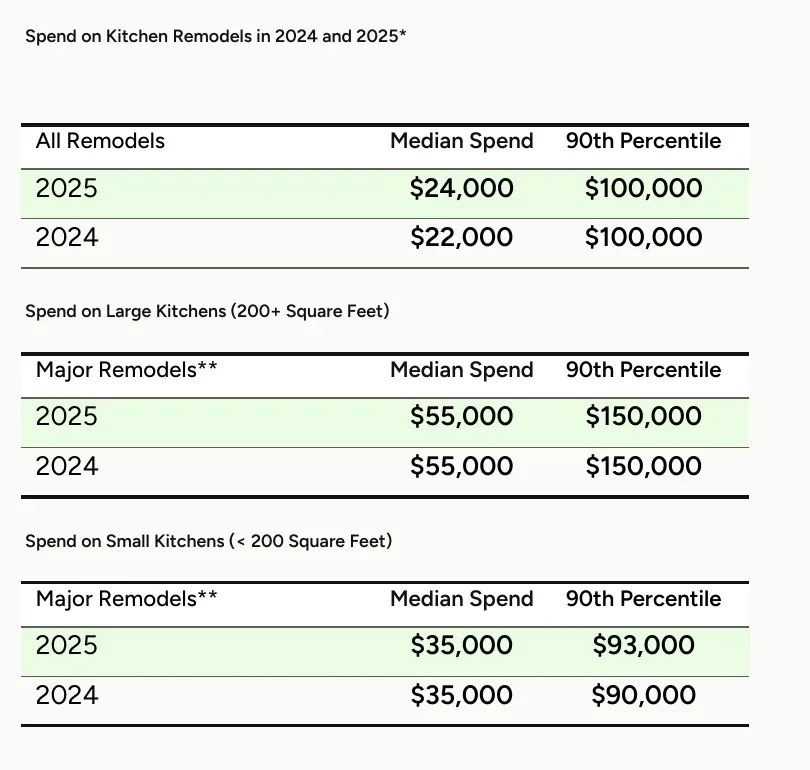 Figure 4: The top tenth of kitchen jobs cost far more than the median, and the gap is widest for major remodels of large kitchens. Source: Houzz, 2026 U.S. Houzz and Home Renovation Trends Study, Apr 2026. Chart published by the source, cropped and captured 20 Oct 2026.
How much do kitchen remodels cost?
Houzz counts a major remodel as one where at least all cabinets and appliances are replaced.
- The 90th percentile for all kitchen remodels was $100,000, and some reached $400,000 or more (Houzz, 2026 U.S. Houzz and Home Renovation Trends Study, Apr 2026).
- A major remodel of a large kitchen, 200 square feet or more, had a $55,000 median and a $150,000 90th percentile (Houzz, 2026 U.S. Houzz and Home Renovation Trends Study, Apr 2026).
- A major remodel of a small kitchen had a $35,000 median, and its 90th percentile rose to $93,000 from $90,000 (Houzz, 2026 U.S. Houzz and Home Renovation Trends Study, Apr 2026).
How much do bathroom remodels cost?
- The median primary bathroom remodel cost $15,000, up from $13,000, and its 90th percentile was $50,000 (Houzz, 2026 U.S. Houzz and Home Renovation Trends Study, Apr 2026).
- A major remodel of a primary bath of 100 square feet or more had a $30,000 median, up from $25,000 (Houzz, 2026 U.S. Houzz and Home Renovation Trends Study, Apr 2026).
- Its 90th percentile was $75,000, up from $70,000 (Houzz, 2026 U.S. Houzz and Home Renovation Trends Study, Apr 2026).
- A major remodel of a smaller primary bath had a $18,000 median, and its 90th percentile slipped to $44,000 (Houzz, 2026 U.S. Houzz and Home Renovation Trends Study, Apr 2026).
- The median guest bathroom job cost $7,000, up from $6,000 (Houzz, 2026 U.S. Houzz and Home Renovation Trends Study, Apr 2026).
How big is the kitchen and bath market?
NKBA’s forecasts come from John Burns Research and Consulting.
- The US kitchen and bath industry is projected at $228 billion in 2026, up 0.1% (NKBA, 2026 Kitchen & Bath Industry Outlook, Feb 2026).
- Repair and remodel kitchen and bath spending is projected up 2.9%, while new construction spending is projected down 3% (NKBA, 2026 Kitchen & Bath Industry Outlook, Feb 2026).
- The mid-year update put the market change at minus 0.4%, with inflation doing more of the work than project volume (NKBA, Mid-Year Update, Jul 2026).
- The Kitchen & Bath Market Index fell to 52.7 in the second quarter from 54.9, still above the 50 line that marks expansion (NKBA, Q2 2026 Kitchen & Bath Market Index, Jul 2026).
- Firms cut their full-year 2026 revenue-weighted outlook to minus 2% from plus 4% (NKBA, Q2 2026 Kitchen & Bath Market Index, Jul 2026).
- The index for building and remodeling firms was 53.2, and for design firms 49.7 (NKBA, Q2 2026 Kitchen & Bath Market Index, Jul 2026).
Which jobs do remodelers see most often?
- Remodelers gave bathroom remodels a 4.1 out of 5 for how common they were in 2025, and 73% rated them common or very common (NAHB Eye on Housing, Bathroom Remodeling Is Most Common Project in 2025, Jan 2026).
- Kitchen remodels scored 3.9 and whole house remodels 3.5 (NAHB Eye on Housing, Bathroom Remodeling Is Most Common Project in 2025, Jan 2026).
Who pays for remodeling?
Married couples with children at home, owners in their 30s to 60s, and higher earners. Single owners and the youngest and oldest owners remodel less.
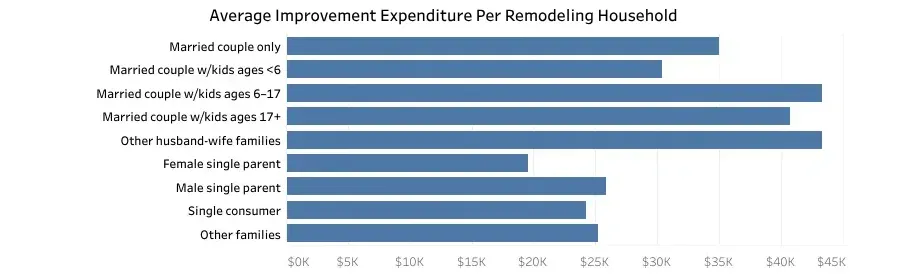 Figure 5: Married couples with school-age children and multigenerational families spend the most per remodeling household, near $43,000, while single parents spend far less. Source: NAHB Eye on Housing, Who Drives Remodeling Spending, from the 2024 Consumer Expenditure Survey, May 2026. Screenshot of the source page, cropped and captured 20 Oct 2026.
Which households spend the most?
NAHB used the Consumer Expenditure Survey and counted additions, alterations and replacements.
- About 60% of households with a project were married couples, 12 million households spending $458 billion (NAHB Eye on Housing, Who Drives Remodeling Spending, May 2026).
- Married couples with children made up 37.3% of remodeling dollars (NAHB Eye on Housing, Who Drives Remodeling Spending, May 2026).
- Couples with children ages 6 to 17 averaged $43,330 per remodeling household, and spent $159,187 on additions (NAHB Eye on Housing, Who Drives Remodeling Spending, May 2026).
- Single consumers made up 14% of spending, but only 19% of them remodeled (NAHB Eye on Housing, Who Drives Remodeling Spending, May 2026).
- Male single parents averaged $25,904 and female single parents $19,542 (NAHB Eye on Housing, Who Drives Remodeling Spending, May 2026).
Which ages and generations spend the most?
- Owners aged 35 to 44 averaged $42,400 when they remodeled, and those aged 55 to 64 averaged $40,300 (NAHB Eye on Housing, Who Drives Remodeling Spending, May 2026).
- Only 18% of owners aged 85 and older remodeled (NAHB Eye on Housing, Who Drives Remodeling Spending, May 2026).
- Baby Boomers spent about $254 billion, or 38% of all remodeling dollars (NAHB Eye on Housing, Who Drives Remodeling Spending, May 2026).
- Gen X spent more than $207 billion (NAHB Eye on Housing, Who Drives Remodeling Spending, May 2026).
- Millennials who remodeled averaged about $36,300, the highest of any generation (NAHB Eye on Housing, Who Drives Remodeling Spending, May 2026).
- Only 21% of Gen Z owners remodeled, and they made up 1.8% of spending (NAHB Eye on Housing, Who Drives Remodeling Spending, May 2026).
Does income change the size of the job?
- Owners earning $200,000 or more accounted for about 40% of remodeling spending (NAHB Eye on Housing, Who Drives Remodeling Spending, May 2026).
- Nearly 29% of those households remodeled, against 18% of households earning under $50,000 (NAHB Eye on Housing, Who Drives Remodeling Spending, May 2026).
- The higher-income households that remodeled spent nearly $61,000, more than three times the lowest-income group (NAHB Eye on Housing, Who Drives Remodeling Spending, May 2026).
How do owners hire for a remodel?
Owners hire in pieces: a general contractor or builder for some, trades directly for many. On every room type, planning takes longer than building.
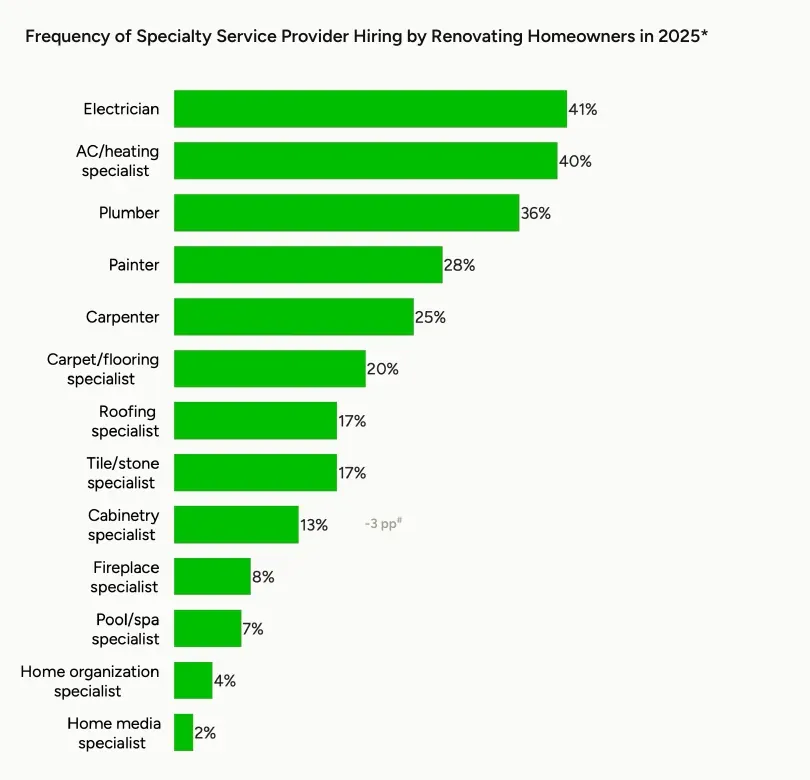 Figure 6: Electricians, heating and cooling specialists and plumbers lead specialty hiring, with painters and carpenters next, which means one remodel can bring several separate trades to one house. Source: Houzz, 2026 U.S. Houzz and Home Renovation Trends Study, Apr 2026. Chart published by the source, cropped and captured 20 Oct 2026.
Who do owners hire?
- 48% of renovating owners hired specialty service providers directly, with 1.6 hired per project (Houzz, 2026 U.S. Houzz and Home Renovation Trends Study, Apr 2026).
- 41% hired construction pros, up from 40% (Houzz, 2026 U.S. Houzz and Home Renovation Trends Study, Apr 2026).
- 13% hired a builder and 8% a kitchen or bath remodeler (Houzz, 2026 U.S. Houzz and Home Renovation Trends Study, Apr 2026).
- 22% hired a design pro, and interior designers and architects were each hired by 8% (Houzz, 2026 U.S. Houzz and Home Renovation Trends Study, Apr 2026).
- Painters were hired by 28% and carpenters by 25% (Houzz, 2026 U.S. Houzz and Home Renovation Trends Study, Apr 2026).
- Flooring specialists were hired by 20%, and roofing and tile or stone specialists by 17% each (Houzz, 2026 U.S. Houzz and Home Renovation Trends Study, Apr 2026).
- Cabinetry specialists were hired by 13%, down 3 points (Houzz, 2026 U.S. Houzz and Home Renovation Trends Study, Apr 2026).
How long does a remodel take?
Houzz splits each project into planning time and construction time, from the owner’s view.
- A primary bathroom takes 8.4 months of planning and 4.8 months of work (Houzz, 2026 U.S. Houzz and Home Renovation Trends Study, Apr 2026).
- A dining room takes 7.6 months of planning and 4.8 months of work (Houzz, 2026 U.S. Houzz and Home Renovation Trends Study, Apr 2026).
- A guest bathroom takes 7.3 months of planning and 4.3 months of work (Houzz, 2026 U.S. Houzz and Home Renovation Trends Study, Apr 2026).
- A laundry room takes 7.0 months of planning and 4.2 months of work (Houzz, 2026 U.S. Houzz and Home Renovation Trends Study, Apr 2026).
- A closet takes 6.6 months of planning and 4.3 months of work (Houzz, 2026 U.S. Houzz and Home Renovation Trends Study, Apr 2026).
- A home office takes 6.1 months of planning and 3.4 months of work (Houzz, 2026 U.S. Houzz and Home Renovation Trends Study, Apr 2026).
Are contractors busy, and do jobs run over?
- 42% of NARI members had more contracting projects than two years earlier (NAR, 2025 Remodeling Impact Report, Apr 2025).
- 57% said project scopes had grown larger (NAR, 2025 Remodeling Impact Report, Apr 2025).
- Among owners who went over budget, 32% said the project was more complex than expected and 22% found unexpected construction problems (Houzz, 2026 U.S. Houzz and Home Renovation Trends Study, Apr 2026).
What does remodeling cost the contractor?
The money is made or lost between the quote and the invoice. Remodelers earned their best margins in more than two decades in 2024, and input costs keep rising. For how shops price work, see pricing statistics. For crew supply, see skilled trade shortage statistics.
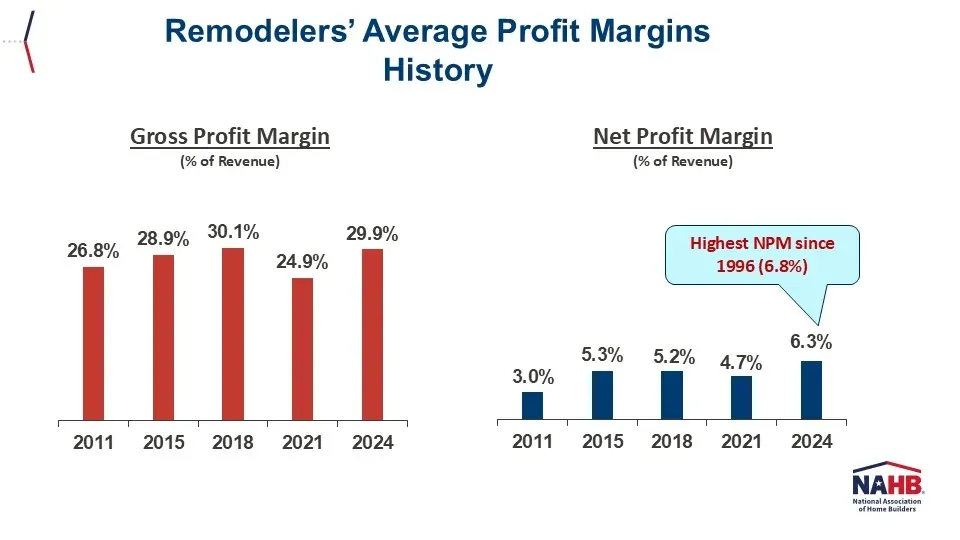 Figure 7: Net margin was 3.0% in 2011 and 6.3% in 2024, a thin cushion, so a small pricing miss on a job can wipe out the profit on several others. Source: NAHB Remodelers’ Cost of Doing Business Study, via NAHB Eye on Housing, Apr 2026. Chart published by the source, captured 20 Oct 2026.
What does a remodeling company earn?
The numbers come from NAHB’s Remodelers’ Cost of Doing Business Study.
- Remodelers averaged $2.7 million in revenue in fiscal 2024 (NAHB Eye on Housing, Remodelers Saw Profit Margin Gains in 2024, Apr 2026).
- Cost of sales took $1.9 million, or 70.1% of revenue, for a gross margin of 29.9% (NAHB Eye on Housing, Remodelers Saw Profit Margin Gains in 2024, Apr 2026).
- Operating expenses averaged $646,000, or 23.6% of revenue (NAHB Eye on Housing, Remodelers Saw Profit Margin Gains in 2024, Apr 2026).
- Gross margin was 24.9% in 2021, a record low (NAHB Eye on Housing, Remodelers Saw Profit Margin Gains in 2024, Apr 2026).
- Trade contractor costs fell from 36% of revenue in 2021 to 30% in 2024 (NAHB Eye on Housing, Remodelers Saw Profit Margin Gains in 2024, Apr 2026).
- Net margin was 4.7% in 2021 and 5.2% in 2018 (NAHB Eye on Housing, Remodelers Saw Profit Margin Gains in 2024, Apr 2026).
- Equity paid for 50% of assets in 2024, up from 33% in 2015 (NAHB Eye on Housing, Remodelers Saw Profit Margin Gains in 2024, Apr 2026).
What are materials and labor doing to the bid?
- The NAHB Remodeling Input Price Index rose 3.9% in the first quarter of 2026 before the larger rise in the second (NAHB Eye on Housing, Q2 2026 Remodeling Market Update, Sep 2026).
- That compares with 5.4% for final demand and 7.8% for new residential construction (NAHB Eye on Housing, Q2 2026 Remodeling Market Update, Sep 2026).
- Remodelers employed 454,100 people in the second quarter of 2026, over 49% of residential building construction jobs (NAHB Eye on Housing, Q2 2026 Remodeling Market Update, Sep 2026).
- That is 5,100 fewer than in the first quarter and 1.0% fewer than a year earlier, yet 19% above the level before COVID (NAHB Eye on Housing, Q2 2026 Remodeling Market Update, Sep 2026).
- Average hourly pay for remodeling employees was $37.91, up 2.3% in a year (NAHB Eye on Housing, Q2 2026 Remodeling Market Update, Sep 2026).
- Real earnings were negative because pay growth trailed both the Consumer Price Index and the PCE price index (NAHB Eye on Housing, Q2 2026 Remodeling Market Update, Sep 2026).
Where do remodelers buy products?
- Specialty retailers, lumber yards and wholesale distributors together take about 70% of building product purchases (NAHB Eye on Housing, Where Do Builders and Remodelers Buy Building Products, Apr 2025).
- Remodelers are three times as likely as home builders to buy at home improvement centers (NAHB Eye on Housing, Where Do Builders and Remodelers Buy Building Products, Apr 2025).
- 68% of remodelers buy hand and power tools at those centers (NAHB Eye on Housing, Where Do Builders and Remodelers Buy Building Products, Apr 2025).
What do the finishing trades earn?
- Drywall and ceiling tile installers earned a median $59,780, and 118,000 held jobs in 2025 (BLS Occupational Outlook Handbook, Drywall Installers, Aug 2026).
- BLS projects 2% growth for drywall installers through 2035 (BLS Occupational Outlook Handbook, Drywall Installers, Aug 2026).
- Flooring installers and tile and stone setters earned a median $54,390, and 97,000 held jobs (BLS Occupational Outlook Handbook, Flooring Installers and Tile and Stone Setters, Aug 2026).
- BLS projects 4% growth for flooring and tile workers through 2035 (BLS Occupational Outlook Handbook, Flooring Installers and Tile and Stone Setters, Aug 2026).
- About 25% of carpenters are self-employed (BLS Occupational Outlook Handbook, Carpenters, Aug 2026).
Methodology and Sources
We chose figures that describe what remodeling work costs, what it returns, who pays for it and what it costs the contractor. Every figure comes from the organization that produced it, such as the Census Bureau, NAHB, Zonda, NAR, NARI, Houzz, NKBA or BLS. We opened each source page or file before citing it. We left out roundups and any number we could not trace to a source we opened. Remodeling statistics differ by source because each defines a remodel differently, so we name the source for every number and do not blend them. The Cost vs. Value and Remodeling Impact figures are estimates from industry surveys, not sale prices. The page is checked and updated every month.
Glossary
- Cost recouped: the share of a project’s cost that Zonda’s survey of real estate professionals says the project adds to a home’s sale price.
- CES: Consumer Expenditure Survey, the Bureau of Labor Statistics survey of household spending.
- KBMI: Kitchen & Bath Market Index, the quarterly NKBA and John Burns index. A reading above 50 means expansion.
- NAHB: National Association of Home Builders.
- NARI: National Association of the Remodeling Industry.
- NKBA: National Kitchen & Bath Association.
- RIPI: NAHB Remodeling Input Price Index, a measure of nonlabor input prices for remodelers.
- SAAR: seasonally adjusted annual rate.
- Joy score: a 1 to 10 rating of how happy owners were with a project after it was done, from the NAR report.
Sources
- Census Bureau, Value of Construction Put in Place, Jul 2026
- Census Bureau, Value of Construction Put in Place 2012 to 2021, Jan 2025
- NAHB Eye on Housing, State Projections of Remodeling, Aug 2026
- NAHB Eye on Housing, NAHB Debuts State Remodeling Resource, May 2026
- NAHB Eye on Housing, Construction Spending, Oct 2026
- NAHB Eye on Housing, Who Drives Remodeling Spending, May 2026
- NAHB Eye on Housing, Remodelers Saw Profit Margin Gains in 2024, Apr 2026
- NAHB Eye on Housing, Q2 2026 Remodeling Market Update, Sep 2026
- NAHB Eye on Housing, Bathroom Remodeling Is Most Common Project in 2025, Jan 2026
- NAHB Eye on Housing, Where Do Builders and Remodelers Buy Building Products, Apr 2025
- Zonda, Cost vs. Value Report, Sep 2025
- Zonda, 2025 Cost vs. Value Report, Sep 2025
- NAR, 2025 Remodeling Impact Report, Apr 2025
- NAR, 12 Remodeling Projects That Offer the Best Value at Resale, Apr 2025
- Houzz, 2026 U.S. Houzz and Home Renovation Trends Study, Apr 2026
- NKBA, 2026 Kitchen & Bath Industry Outlook, Feb 2026
- NKBA, Mid-Year Update, Jul 2026
- NKBA, Q2 2026 Kitchen & Bath Market Index, Jul 2026
- BLS Occupational Outlook Handbook, Drywall Installers, Aug 2026
- BLS Occupational Outlook Handbook, Flooring Installers and Tile and Stone Setters, Aug 2026
- BLS Occupational Outlook Handbook, Carpenters, Aug 2026