Construction labor shortage statistics point two ways at once. Job openings have cooled from the 2022 peak, and some builders have cut staff. Yet most contractors still say they cannot find the people they need, and they say it is no easier than last year.
This page collects the latest primary numbers on open jobs, hiring trouble, project delays, age, immigration and pay. Each figure comes from the agency, trade group or research body that produced it. We link the source and give the month of the data. When two sources disagree, we say so.
If you run an HVAC or home service shop with a few techs, read the sections on delays, pay and how contractors respond first. They show what the same labor squeeze does to your costs, your schedule and your prices.
Key Takeaways
- Construction job openings peaked at 457,000 in March 2022 (BLS JOLTS, Mar 2022).
- Builders and remodelers need about 723,000 hires a year to cover growth and exits (Home Builders Institute, Oct 2025).
- 82% of firms have a hard time filling hourly craft jobs and 80% say the same for salaried jobs, the highest share in three years (AGC and Sage Outlook, Jan 2026).
- The skilled labor shortage costs single-family builders $10.806 billion a year and about 19,000 homes not built (NAHB and Home Builders Institute, Jun 2025).
- A new single-family home took 8.8 months from permit to finish in 2025, about 1.6 months longer than in 2015 (NAHB Eye on Housing, Sep 2026).
- Workers aged 55 and older were 21.7% of the construction workforce in 2024 (CPWR Construction Chart Book, Sep 2025).
- Gen Z grew from 6.4% to 16.8% of the construction workforce between 2019 and 2024 (NAHB Eye on Housing, Oct 2026).
- Foreign-born workers were 26.3% of the construction workforce in 2024, and one in three craftsmen (NAHB Eye on Housing, Apr 2026).
- 9.1% of foreign-born workers had construction jobs in 2025, against 4.3% of native-born workers (BLS Foreign-Born Workers, May 2026).
- About 29% of contractors reported at least one effect from immigration enforcement in the past six months (AGC News Release, Sep 2026).
- Pay for construction, extraction, farming, fishing and forestry occupations rose 3.9% in the 12 months to June 2026, against 3.2% for all workers (BLS Employment Cost Index, Jun 2026).
- 15% of the construction workforce was unauthorized in 2023, the highest share of any industry (Pew Research Center, Aug 2025).
- UK construction needs an average of 41,200 extra workers a year from 2026 to 2030 (CITB Construction Workforce Outlook, Jun 2026).
How many construction jobs are open right now?
Open jobs are well below the 2022 high, but the industry has not stopped hiring. The shortage now shows up in who can be hired, not in a flood of postings.
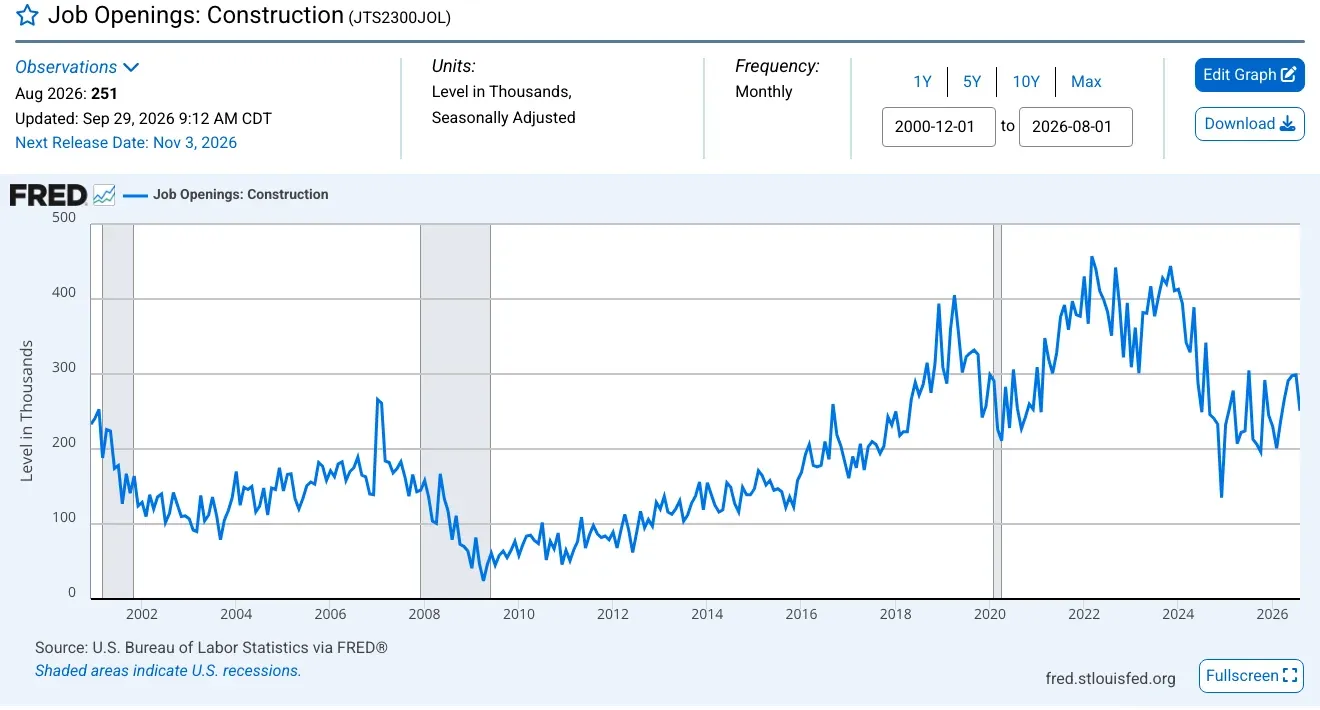 Figure 1: Construction job openings rose through the 2010s, peaked in 2022 and have moved in a lower, choppier range since 2024. Source: BLS Job Openings and Labor Turnover Survey, Job Openings: Construction, retrieved from FRED, Aug 2026. Chart published by FRED from BLS data, captured 20 Oct 2026.
How far have openings fallen from the peak?
Openings and quits both fell hard after 2022. A quieter market means fewer workers are switching jobs.
- The construction job openings rate peaked at 5.6% in March 2022 (BLS JOLTS, Mar 2022).
- Construction quits fell from 251,000 in March 2022 to 152,000 in August 2026 (BLS JOLTS, Aug 2026).
- The construction total separations rate fell from 5.4% in August 2019 to 3.2% in August 2026 (BLS JOLTS, Aug 2026).
- Open construction jobs rose from 291,000 in May to 305,000 in June 2026, against 224,000 a year earlier (NAHB Eye on Housing, Aug 2026).
Where is construction hiring and where is it not?
The split is between housing and everything else. Payrolls for residential trade contractors slipped while nonresidential trade contractors added jobs.
- Residential specialty trade contractors employed 2,340,300 people in September 2026, down from 2,369,100 a year earlier (BLS Current Employment Statistics, Sep 2026).
- Nonresidential specialty trade contractors employed 2,939,600 people, up from 2,854,900 a year earlier (BLS Current Employment Statistics, Sep 2026).
- Construction payrolls peaked at 7,726,000 in April 2006, before the housing crash (BLS Current Employment Statistics, Apr 2006).
- The construction unemployment rate was 3.5% in September 2026, against 3.8% a year earlier (BLS Current Population Survey, Sep 2026).
- There are 8.3 million payroll construction workers, and residential construction accounts for 3.3 million of them (Home Builders Institute, Oct 2025).
- The share of tradesmen in the construction workforce fell from 71% in 2005 to under 61% in 2022, as the industry lost more than a million craftsmen (Home Builders Institute, Oct 2025).
How many workers will the industry need each year?
Federal projections count replacements as well as growth. Most of the need comes from people who leave or switch jobs, not from new building.
- BLS projects about 587,000 openings a year in construction and extraction occupations from 2025 to 2035 (BLS Occupational Outlook Handbook, Aug 2026).
- About 213,300 workers a year are expected to leave the labor force from these occupations (BLS Employment Projections, Aug 2026).
- Another 335,100 workers a year are expected to move to other occupations (BLS Employment Projections, Aug 2026).
- BLS expects employment in these occupations to grow by 385,700, or 5.1%, from 7,492,900 jobs in 2025 (BLS Employment Projections, Aug 2026).
- 63% of firms expect to add headcount in 2026, down from 69% in the 2025 outlook (AGC and Sage Outlook, Jan 2026).
- 15% of firms expect to cut headcount, up from 10% a year earlier (AGC and Sage Outlook, Jan 2026).
How hard is it to hire construction workers?
Hard, and about as hard as it has been in years, even in a softer market. Two things are true at once: some firms are cutting staff, and most still cannot find the skills they want.
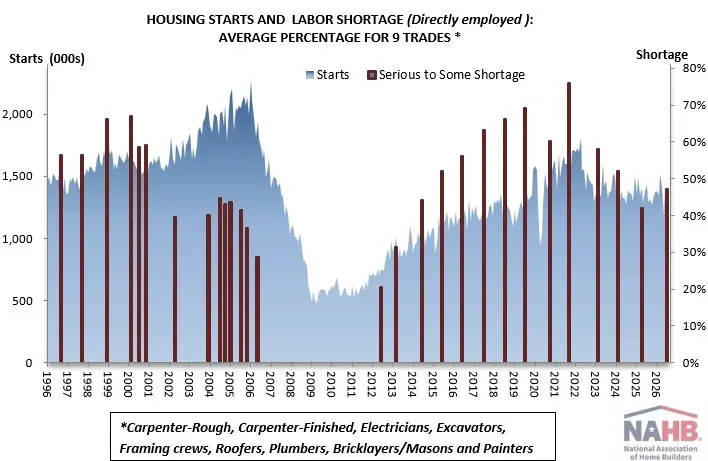 Figure 2: The share of builders reporting a shortage in nine core trades fell from its 2021 high, then rose again in 2026, while housing starts stayed far below their mid-2000s peak. Source: NAHB Eye on Housing, Labor Shortages a Growing Problem, Sep 2026. Chart published by the source, captured 20 Oct 2026.
Do contractors still say hiring is hard?
Yes. Firms that plan to hire report trouble in both craft and office roles, and open-shop and union firms both feel it.
- Among firms with hourly craft openings, 86% of open-shop firms and 77% of union firms report difficulty filling them (AGC and Sage Outlook, Jan 2026).
- 41% of firms with salaried openings say those roles are harder to fill than a year ago (AGC and NCCER Workforce Survey, Sep 2026).
- 37% of firms cut headcount by at least 5% in the past 12 months, while 34% raised it by at least 5% (AGC and NCCER Workforce Survey, Sep 2026).
- 57% of firms name an insufficient supply of workers or subcontractors as a top concern for 2026 (AGC and Sage Outlook, Jan 2026).
- 56% name rising direct labor costs, and 53% name worker quality (AGC and Sage Outlook, Jan 2026).
- 18% of surveyed home builders rate the availability of labor and subcontractors as poor, and 36% rate it good (NAHB Housing Market Index, Sep 2026).
- Federal Reserve districts said labor supply was generally adequate, yet shortages persisted for specialized, technical and skilled trade workers (Federal Reserve Beige Book, Oct 2026).
Why is the builder shortage reading so high with so few starts?
Builders report shortages even though they are starting fewer homes. That points to a thinner pool of skilled workers rather than a flood of demand.
- Starts were consistently over 1.8 million a year in 2004 to 2006, when the nine-trade shortage reading was lower than today (NAHB Eye on Housing, Oct 2026).
- NAHB says home building competes for labor with other parts of construction, particularly data centers, and that immigration enforcement adds to worker fears (NAHB Eye on Housing, Oct 2026).
- Data center construction spending was up 46% year over year (NAHB Eye on Housing, Aug 2026).
Are data centers pulling workers away from other jobs?
Data centers are the one segment adding strain. Firms that build them report more competition for the same skilled people.
- 36% of firms that work on data centers say the projects made open positions harder to fill (AGC and NCCER Workforce Survey, Sep 2026).
- 37% of those firms name the availability of workers or subcontractors as their biggest challenge (AGC News Release, Sep 2026).
- Data centers had the highest net optimism reading of 17 project types, at 57% (AGC and Sage Outlook, Jan 2026).
Which construction trades are hardest to fill?
Finish and framing trades lead the list, and electricians, plumbers and HVAC workers sit in the middle. The pattern is not the same as the 2021 peak.
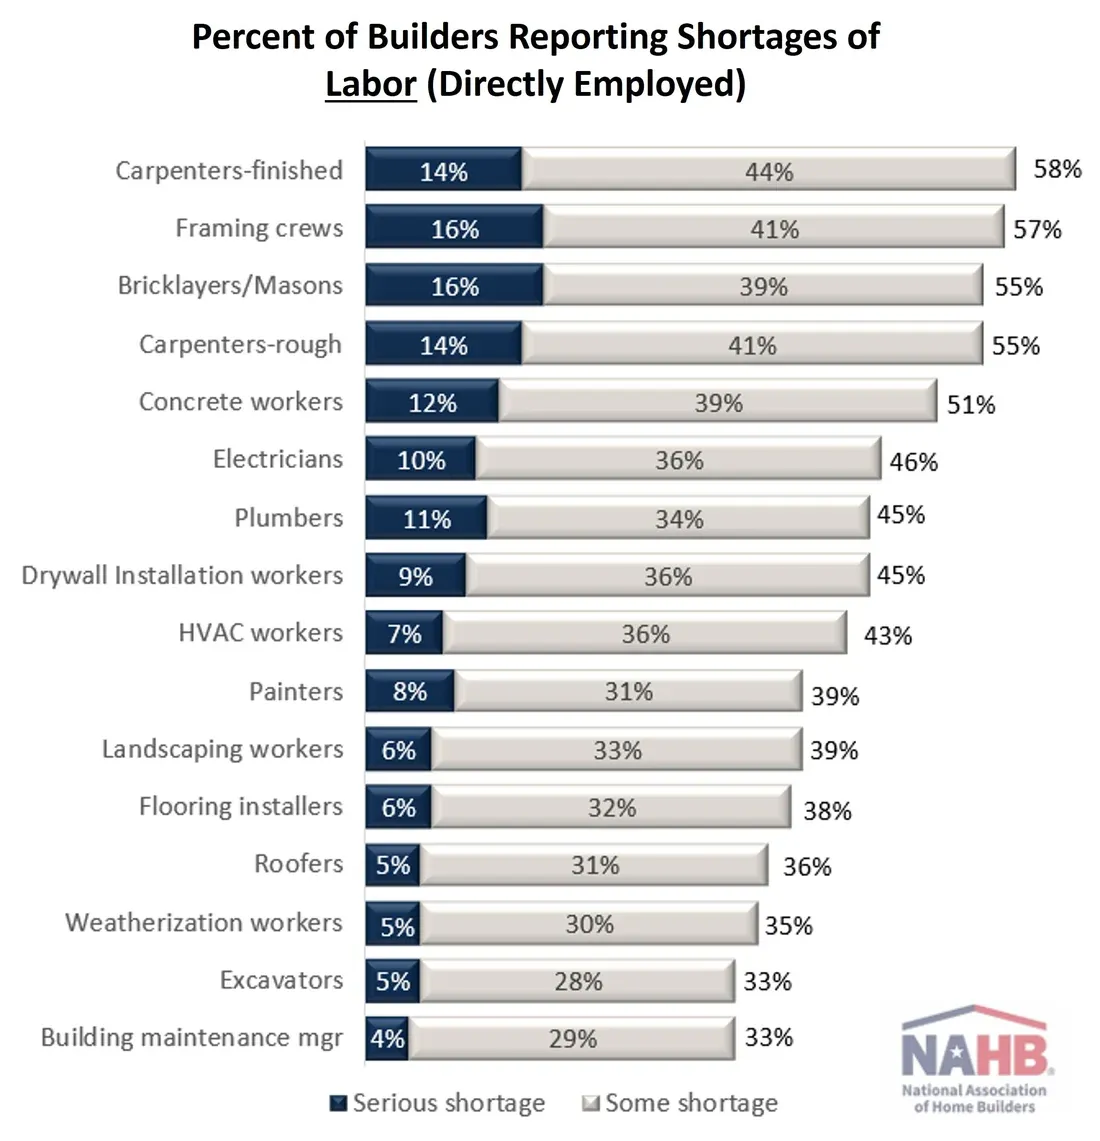 Figure 3: Finished carpenters, framing crews and bricklayers top the builder shortage list, while excavators and maintenance managers sit at the bottom. Source: NAHB Eye on Housing, Labor Shortages a Growing Problem, Sep 2026. Chart published by the source, captured 20 Oct 2026.
How do the trades compare with each other?
The HMI asked 415 builders about 16 trades. The table behind the chart shows how deep each shortage runs.
- 16% of builders report a serious shortage of bricklayers and masons, and 39% report some shortage (NAHB Housing Market Index, Sep 2026).
- More than half of builders report shortages of both subcontractors and directly employed workers in the same five trades: framers, rough and finished carpenters, bricklayers and concrete workers (NAHB Eye on Housing, Oct 2026).
- Builders subcontract 84% of the total construction cost of a single-family home (NAHB Eye on Housing, Oct 2026).
- Builders use an average of two dozen different subcontractors per home (NAHB Eye on Housing, Oct 2026).
How does today compare with the 2021 peak?
Serious shortages are far less common than they were. Some shortage is still the norm.
- 16% of builders report a serious shortage of framing crews, down from 43% in October 2021 (NAHB Housing Market Index, Sep 2026).
- 10% report a serious shortage of electricians, down from 29% in October 2021 (NAHB Housing Market Index, Sep 2026).
- 14% report a serious shortage of rough carpenters, down from 39% in October 2021 (NAHB Housing Market Index, Sep 2026).
Which office and management roles are hard to fill?
Salaried roles that run jobs are as scarce as the crews. These are the people who plan, price and schedule the work.
- 74% of firms with openings for project managers and supervisors report difficulty filling them (AGC and NCCER Workforce Survey, Sep 2026).
- 66% report difficulty finding quality-control personnel (AGC and NCCER Workforce Survey, Sep 2026).
- 64% report difficulty finding engineers (AGC and NCCER Workforce Survey, Sep 2026).
How many openings does each construction trade create a year?
Laborers and carpenters produce the most openings, followed by managers and equipment operators.
- About 137,000 openings a year are projected for construction laborers and helpers (BLS Occupational Outlook Handbook, Aug 2026).
- About 62,800 openings a year are projected for carpenters (BLS Occupational Outlook Handbook, Aug 2026).
- About 49,700 openings a year are projected for construction managers (BLS Occupational Outlook Handbook, Aug 2026).
- About 42,500 openings a year are projected for construction equipment operators, who hold 534,100 jobs (BLS Occupational Outlook Handbook, Aug 2026).
- About 12,000 openings a year are projected for roofers, who hold 166,900 jobs (BLS Occupational Outlook Handbook, Aug 2026).
Do worker shortages delay construction projects?
They do. Contractors list labor first among the causes of delay, and homes take longer to build than they did a decade ago. A schedule that slips costs a small shop real money.
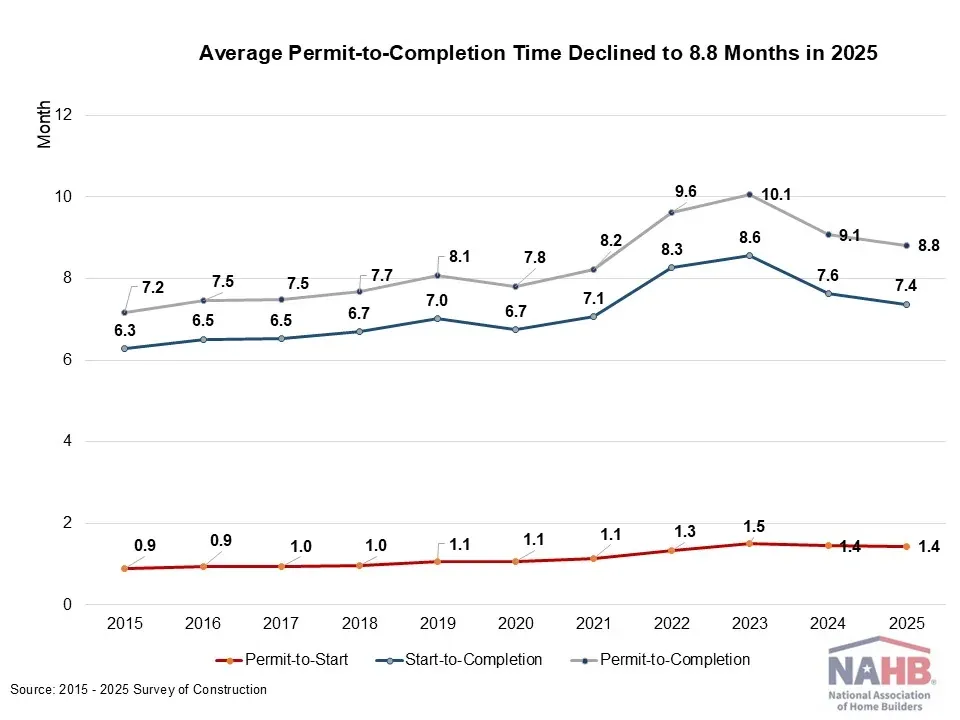 Figure 4: Permit-to-completion time for single-family homes climbed from 7.2 months in 2015 to a peak of 10.1 months in 2023, then eased to 8.8 months in 2025. Source: NAHB Eye on Housing, Single-Family Home Construction Time Declines in 2025, 2025. Chart published by the source from Census Bureau Survey of Construction data, captured 20 Oct 2026.
What else delays projects besides labor?
Labor leads, but equipment, owners and permits are close behind. Shortages rarely act alone.
- 29% of firms cite longer lead times or shortages for electrical equipment as a cause of delay (AGC and NCCER Workforce Survey, Sep 2026).
- 28% cite owner directives to halt or redesign projects (AGC and NCCER Workforce Survey, Sep 2026).
- 26% cite government delays such as a lack of approvals or inspectors (AGC and NCCER Workforce Survey, Sep 2026).
- 26% cite shortages or long lead times for other materials and equipment (AGC and NCCER Workforce Survey, Sep 2026).
Why do owners cancel or postpone projects?
Money matters more than labor in these decisions. Cost and financing top the list.
- 55% of firms had at least one non-data-center project canceled, postponed or scaled back in the past six months (AGC and NCCER Workforce Survey, Sep 2026).
- 34% of those firms cite increasing costs, and 27% cite financing that is unavailable or too expensive (AGC and NCCER Workforce Survey, Sep 2026).
- 10% cite changes in demand because of tariffs, down from 16% a year earlier (AGC and NCCER Workforce Survey, Sep 2026).
How long does it take to build a home?
Slower than a decade ago, even after the recent improvement. NAHB says part of the gap may reflect the skilled labor shortage.
- Permit to start took 1.4 months and construction itself took 7.4 months for homes finished in 2025 (NAHB Eye on Housing, Sep 2026).
- Homes built by owners took 14.3 months from permit to completion (NAHB Eye on Housing, Sep 2026).
What do longer builds cost?
The longer a build runs, the more the builder pays in interest and carrying costs. Smaller builders lose the most time.
- The shortage adds an unweighted average of 1.98 months to construction time, with smaller builders seeing even longer delays (NAHB and Home Builders Institute, Jun 2025).
- Higher carrying costs from longer builds come to $2.663 billion a year (NAHB and Home Builders Institute, Jun 2025).
- Lost production of single-family homes is worth $8.143 billion a year (NAHB and Home Builders Institute, Jun 2025).
How old is the construction workforce?
Older than the headlines suggest in some places, younger in others. The workforce is close to the national median age, but a large block of experienced leaders sits near retirement.
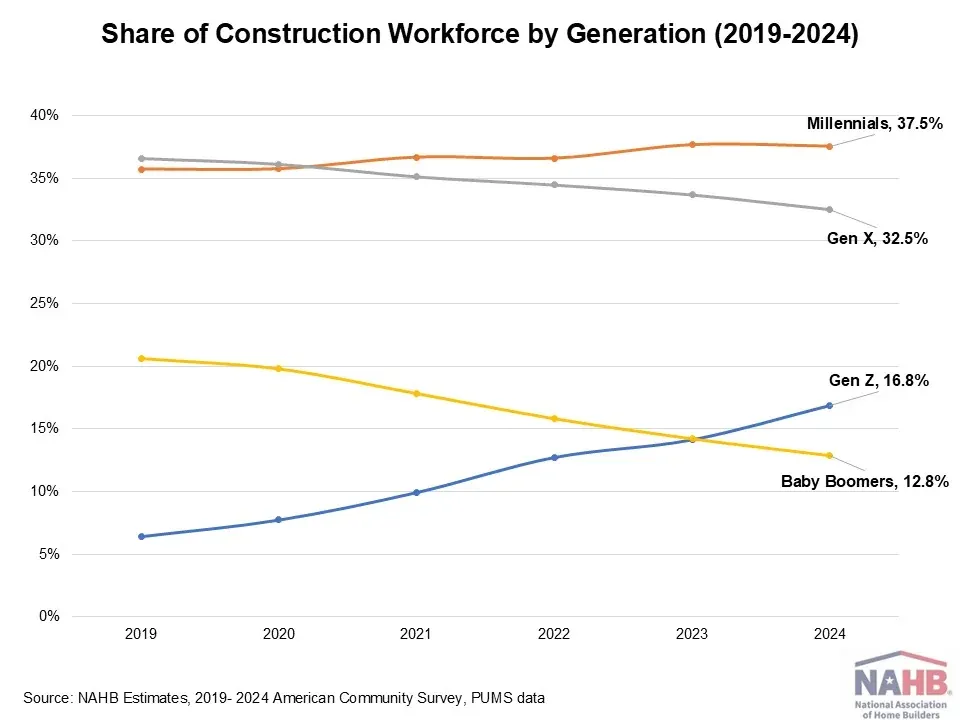 Figure 5: Baby Boomers fell from 20.6% to 12.8% of the construction workforce between 2019 and 2024 while Gen Z rose from 6.4% to 16.8%. Source: NAHB Eye on Housing, Median Age in Construction Holds at 42, 2024. Chart published by the source from American Community Survey data, captured 20 Oct 2026.
What is the median age of a construction worker?
About 42, which matches the national workforce. Trades are younger and managers are older.
- The median construction worker is 42, one year older than the national median (NAHB Eye on Housing, Oct 2026).
- BLS puts the median age of construction industry workers at 42.2, against 42.1 for all employed workers (BLS Current Population Survey, Annual 2025).
- CPWR puts the average age in construction at 42.3, against 42.4 across all industries (CPWR Construction Chart Book, Sep 2025).
- The median age of construction trades workers is 40 (NAHB Eye on Housing, Oct 2026).
- Roofers have a median age of 35, pipelayers 34 and helpers in the trades 32 (NAHB Eye on Housing, Oct 2026).
How many construction workers are near retirement age?
More than one in five is 55 or older, and the share is rising. Retirement will matter most among managers.
- 1,989,000 construction workers were aged 55 to 64 and 702,000 were 65 or older, out of 12.1 million (BLS Current Population Survey, Annual 2025).
- The 55 and older share of the construction workforce rose from 16.9% in 2011 to 21.3% in 2023 (CPWR Construction Chart Book, Sep 2025).
- 59.2% of construction managers were 55 or older in 2024 (CPWR Construction Chart Book, Sep 2025).
- 40.1% of construction truck drivers and 24.4% of foremen were 55 or older (CPWR Construction Chart Book, Sep 2025).
- Baby Boomers are now only 12.8% of the workforce after falling from 20.6% in 2019 as many retired (NAHB Eye on Housing, Oct 2026).
Are younger workers filling the gap?
Some are. The mix is shifting toward Gen Z and Millennials, but the industry still has fewer under-25s than the national average.
- Only 10.7% of construction workers were under 25 in 2024, against 13.7% across all industries (NAHB Eye on Housing, Oct 2026).
How much does construction depend on immigrant workers?
A great deal, and that is why enforcement shows up on jobsites. The trades lean on foreign-born labor more than the industry as a whole does.
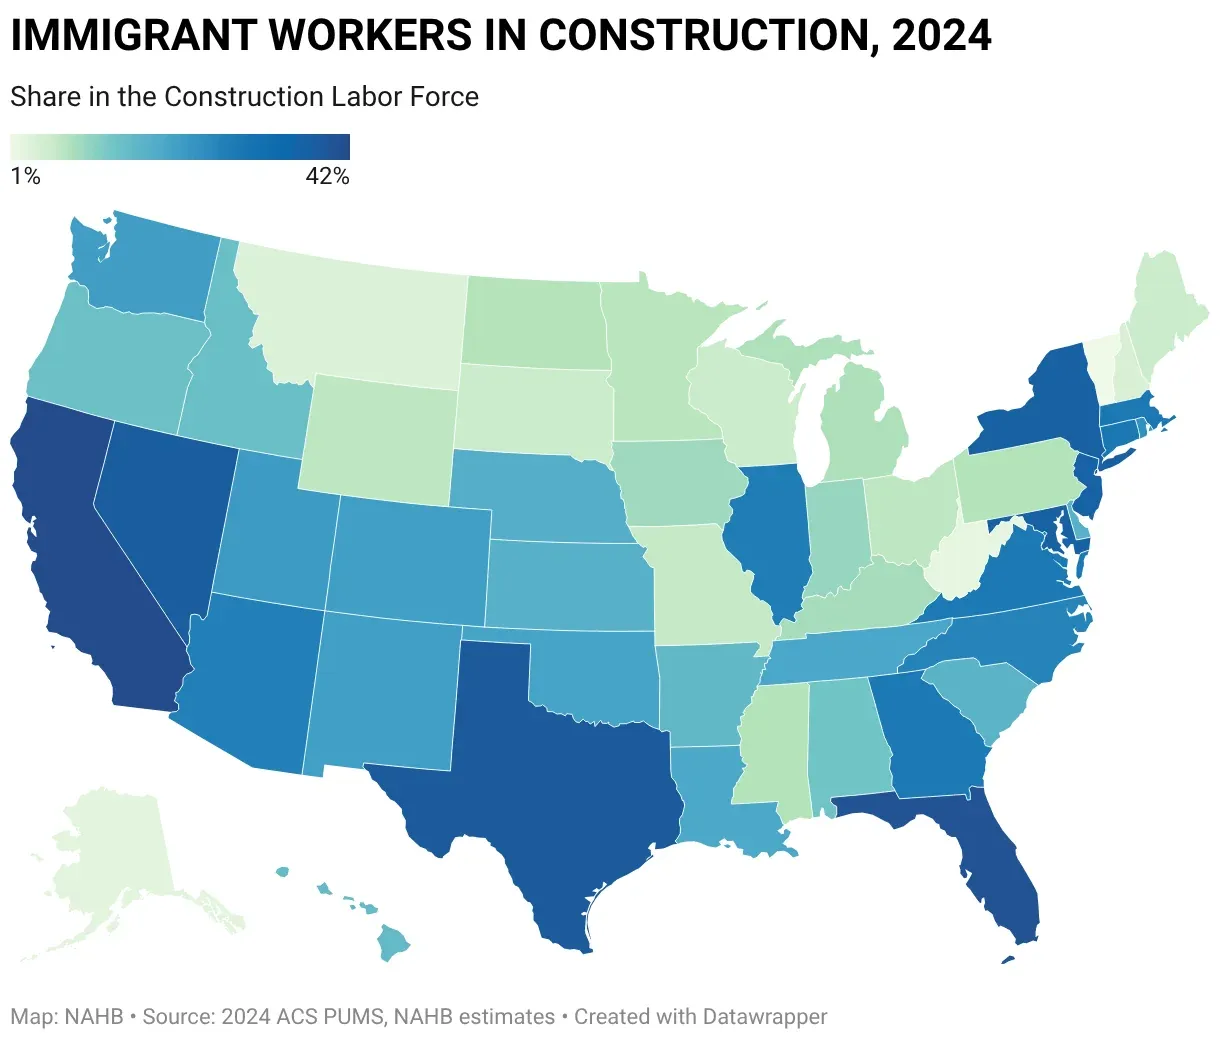 Figure 6: Immigrant shares of the construction labor force run from about 1% in the least reliant states to 42% in the most reliant. Source: NAHB Eye on Housing, Which States and Construction Trades Depend the Most on Immigrant Workers, 2024. Chart published by the source from American Community Survey data, captured 20 Oct 2026.
What share of construction workers were born abroad?
More than a quarter, and the share has climbed for years. Native-born workers are the ones missing.
- Immigrants make up more than 40% of the construction workforce in California and Florida, 39% in Texas and 38% in Nevada (NAHB Eye on Housing, Apr 2026).
- The immigrant share of construction reached a then-record 25.5% in 2023 (NAHB Eye on Housing, Nov 2024).
- Construction was still short 550,000 native-born workers compared with its 2006 peak (NAHB Eye on Housing, Nov 2024).
- Foreign-born workers rose from 23.6% to 29.9% of the construction workforce from 2011 to 2023, in CPWR’s count (CPWR Construction Chart Book, Sep 2025).
- Hispanic workers grew from 24.3% to 34.0% of the construction workforce over the same years (CPWR Construction Chart Book, Sep 2025).
- 15.5% of foreign-born men worked in construction and extraction occupations in 2025, against 7.8% of native-born men (BLS Foreign-Born Workers, May 2026).
Which trades rely on immigrant labor the most?
Finish trades, where immigrants are a majority. Roofers, painters and drywall crews depend on them most.
- 57% of drywall and ceiling tile installers are foreign-born (NAHB Eye on Housing, Apr 2026).
- 56% of plasterers and stucco masons are foreign-born (NAHB Eye on Housing, Apr 2026).
- 53% of roofers and 53% of painters are foreign-born (NAHB Eye on Housing, Apr 2026).
- 43% of construction laborers and 35% of carpenters are foreign-born (NAHB Eye on Housing, Apr 2026).
- Only 28 of the roughly 390 construction occupations are trades, yet they hold about 60% of the construction labor force (NAHB Eye on Housing, Apr 2026).
How is immigration enforcement affecting jobsites?
For most firms, not at all. For close to three in ten, it has meant lost workers, and for some it has meant a visit from agents.
- 6% of firms say immigration agents visited a jobsite or offsite location (AGC and NCCER Workforce Survey, Sep 2026).
- 12% say workers left or failed to appear because of actual or rumored immigration actions (AGC and NCCER Workforce Survey, Sep 2026).
- 16% say their subcontractors lost workers (AGC and NCCER Workforce Survey, Sep 2026).
- 42% of respondents in the South report an effect, against 37% in the Northeast, 22% in the West and 17% in the Midwest (AGC News Release, Sep 2026).
- In the earlier AGC and Sage survey, 33% of firms had been affected by enforcement in the previous six months (AGC and Sage Outlook, Jan 2026).
- 24% of firms in that survey said subcontractors lost workers, and 11% said their own workers left or failed to appear (AGC and Sage Outlook, Jan 2026).
- 19% of workers in construction occupations were unauthorized immigrants in 2023 (Pew Research Center, Aug 2025).
- The unauthorized immigrant workforce reached a record 9.7 million in 2023, up from 7.8 million in 2021 (Pew Research Center, Aug 2025).
Are construction wages rising because of the shortage?
Yes, but more slowly than at the 2024 peak, and the trend differs between housing and the rest of the industry. Pay still beats the national average for trade work.
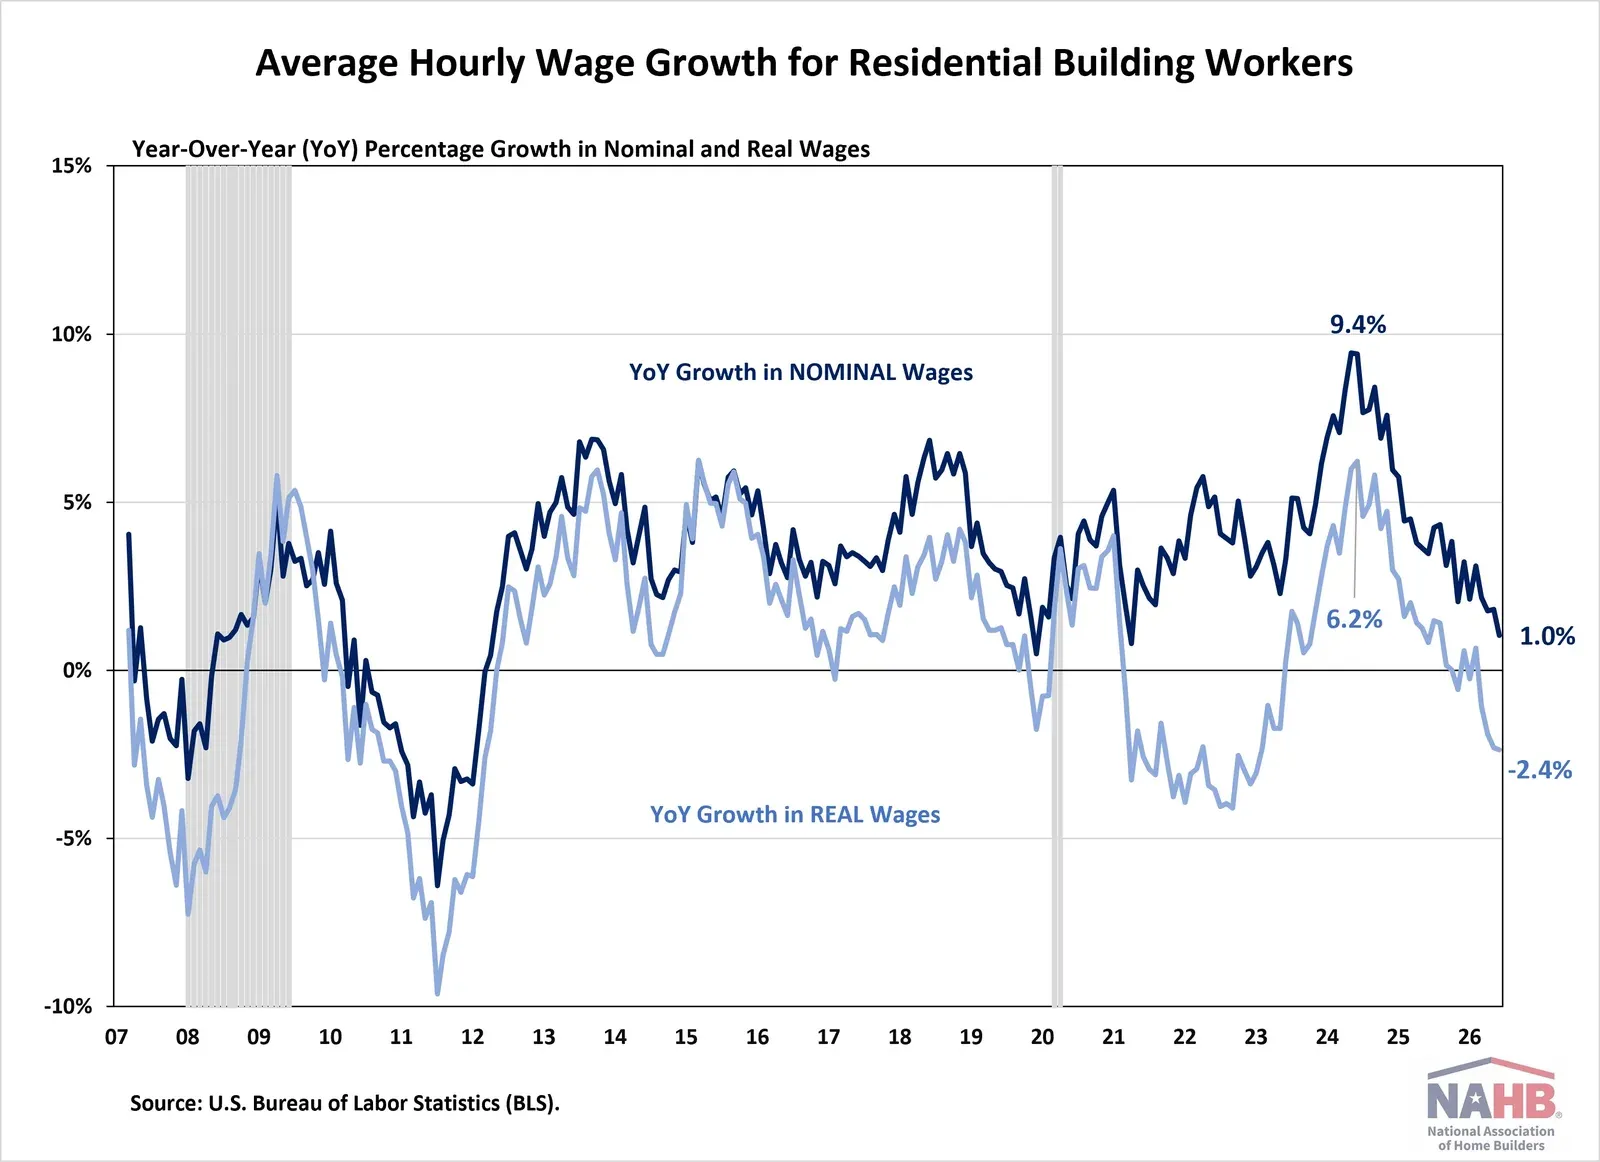 Figure 7: Nominal wage growth for residential building workers peaked at 9.4% in mid-2024 and slowed to 1.0% by June 2026, which left real wages down 2.4%. Source: NAHB Eye on Housing, Wage Growth for Residential Building Workers Continues to Cool, Jun 2026. Chart published by the source from BLS data, captured 20 Oct 2026.
How fast is construction pay growing?
Faster than pay overall, though the gap is narrowing. Union settlements are running hotter than market wages.
- Pay for natural resources, construction and maintenance occupations rose 3.8% in the 12 months to June 2026 (BLS Employment Cost Index, Jun 2026).
- Average hourly earnings of production and nonsupervisory construction workers were $39.20 in September 2026 (BLS Current Employment Statistics, Sep 2026).
- They were $37.57 a year earlier (BLS Current Employment Statistics, Sep 2025).
- First-year union wage and fringe packages negotiated from January to September 2026 rose an average of 4.9%, or $3.39 (Construction Labor Research Council, Sep 2026).
- The 2025 average for the same settlements was 4.7% (Construction Labor Research Council, Dec 2025).
What is happening to wages in home building?
Wage growth has cooled hard in housing. Real wages are falling.
- Average hourly earnings for residential building workers rose 1.0% over the year to June 2026, reaching $39.74 (NAHB Eye on Housing, Jun 2026).
- Real wages fell 2.4% over the year to June 2026 (NAHB Eye on Housing, Jun 2026).
- 6% say labor costs rose 10% to 14.99%, and 3% say 15% or more (NAHB Housing Market Index, Sep 2026).
How does construction pay compare with other jobs?
Construction and extraction jobs pay more than the median job in the US. The gap is wider for managers and operators.
- The median annual wage for construction and extraction occupations was $59,540 in May 2025, above $50,980 for all occupations (BLS Occupational Outlook Handbook, May 2025).
How do rising labor costs reach customer prices?
Through bids. When pay and materials rise, the quote has to rise with them or margin shrinks. Firms that price by the hour or by a stale list feel this first.
- 40% of firms raised bid prices in response to tariffs (AGC and Sage Outlook, Jan 2026).
- 35% passed most or all tariff costs on to project owners, and 11% absorbed most or all of them (AGC and Sage Outlook, Jan 2026).
How many new workers are entering construction?
More each year through apprenticeships, but not enough on their own to refill an industry that loses hundreds of thousands of people a year. The pipeline is growing from a low base.
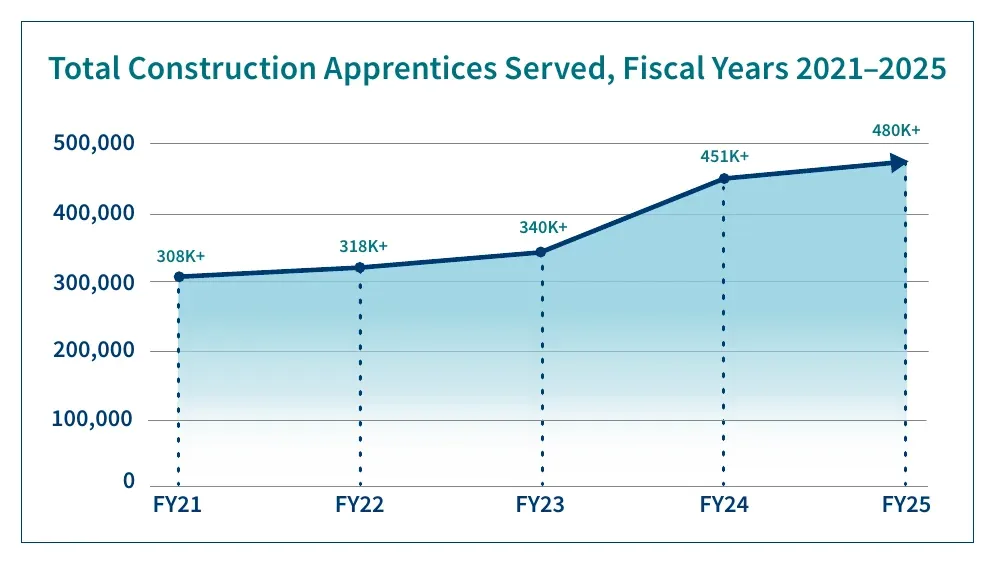 Figure 8: Construction apprentices served rose from 308,000 in fiscal 2021 to more than 480,000 in fiscal 2025. Source: U.S. Department of Labor, ApprenticeshipUSA Construction fact sheet, Mar 2026. Chart published by the source, captured 20 Oct 2026.
How fast are apprenticeships growing?
Steadily, with a jump in fiscal 2024.
- Construction registered apprenticeship served more than 308,000 people in fiscal 2021 (U.S. Department of Labor, Mar 2026).
- It served more than 451,000 people in fiscal 2024 (U.S. Department of Labor, Mar 2026).
How is the construction labor force changing?
Total employment grew faster than for all industries, and the mix shifted toward laborers and managers. Carpenters did not grow.
- Construction employment grew 31.6% from 2011 to 2023, against 14.0% for all industries (CPWR Construction Chart Book, Sep 2025).
- The number of construction laborers rose 81.0% over those years (CPWR Construction Chart Book, Sep 2025).
- The number of managers rose 131.8% (CPWR Construction Chart Book, Sep 2025).
- The number of carpenters fell 2.3%, even as demand for carpentry grew (CPWR Construction Chart Book, Sep 2025).
- 25.5% of construction workers took part in a retirement plan in 2024, against almost 34% in all industries (CPWR Construction Chart Book, Sep 2025).
- 11.1% of wage and salary workers in construction belonged to a union in 2025, and 16.4% in construction and extraction occupations (BLS Union Members, Annual 2025).
How are contractors responding to the shortage?
With pay, training and software. Most firms raised pay again, and many now expect technology to take over the paperwork that slows their crews.
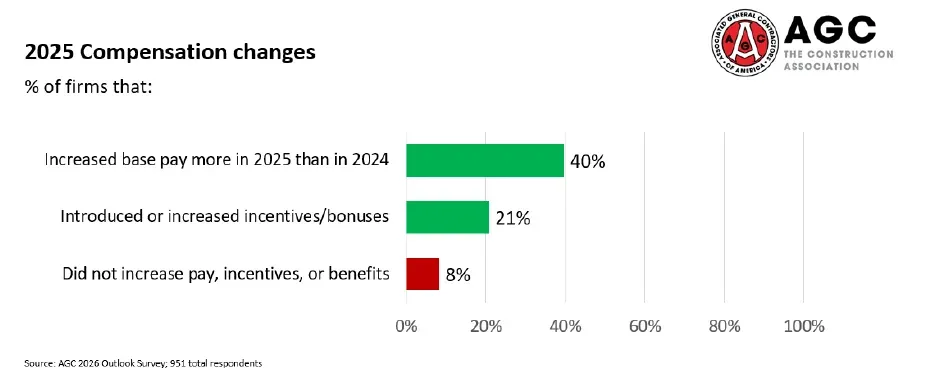 Figure 9: Four in ten firms raised base pay by more than they did in 2024, one in five added incentives or bonuses and 8% made no pay change. Source: AGC and Sage, 2026 Construction Hiring and Business Outlook, 2025. Chart published by the source, captured 20 Oct 2026.
How much are firms raising pay?
Most raised it by 4% to 6%. Few skipped raises.
- 40% of firms raised base pay by more than they did in 2024 (AGC and Sage Outlook, Dec 2025).
- 21% added incentives or bonuses (AGC and Sage Outlook, Dec 2025).
- 8% made no increase to pay, incentives or benefits (AGC and Sage Outlook, Dec 2025).
- 46% of firms that raised pay did so by 4% to 6% (AGC and Sage Outlook, Dec 2025).
Is technology part of the answer?
Firms say yes, mainly for the office side. Contract review and project management top the list of expected gains in their own firms.
- 66% of contractors expect AI to have the greatest effect on document and contract review in their own firms (AGC and NCCER Workforce Survey, Sep 2026).
- 49% expect the greatest effect on project management (AGC and NCCER Workforce Survey, Sep 2026).
- 61% of firms use AI or plan to invest more in it, up from 44% a year earlier (AGC and Sage Outlook, Jan 2026).
- 45% of firms use AI for office and administrative work, 23% for estimating and 20% for design or preconstruction (AGC and Sage Outlook, Jan 2026).
Is productivity improving?
For some firms. The picture is mixed.
- 32% of firms say productivity improved over the past 12 months, 41% say it did not change and 24% say it declined (AGC and Sage Outlook, Dec 2025).
How does the shortage look in Canada and the UK?
Much the same. Canada and the UK both face retirements and slow growth in the number of people entering the trades, and both forecast steady hiring needs through 2030.
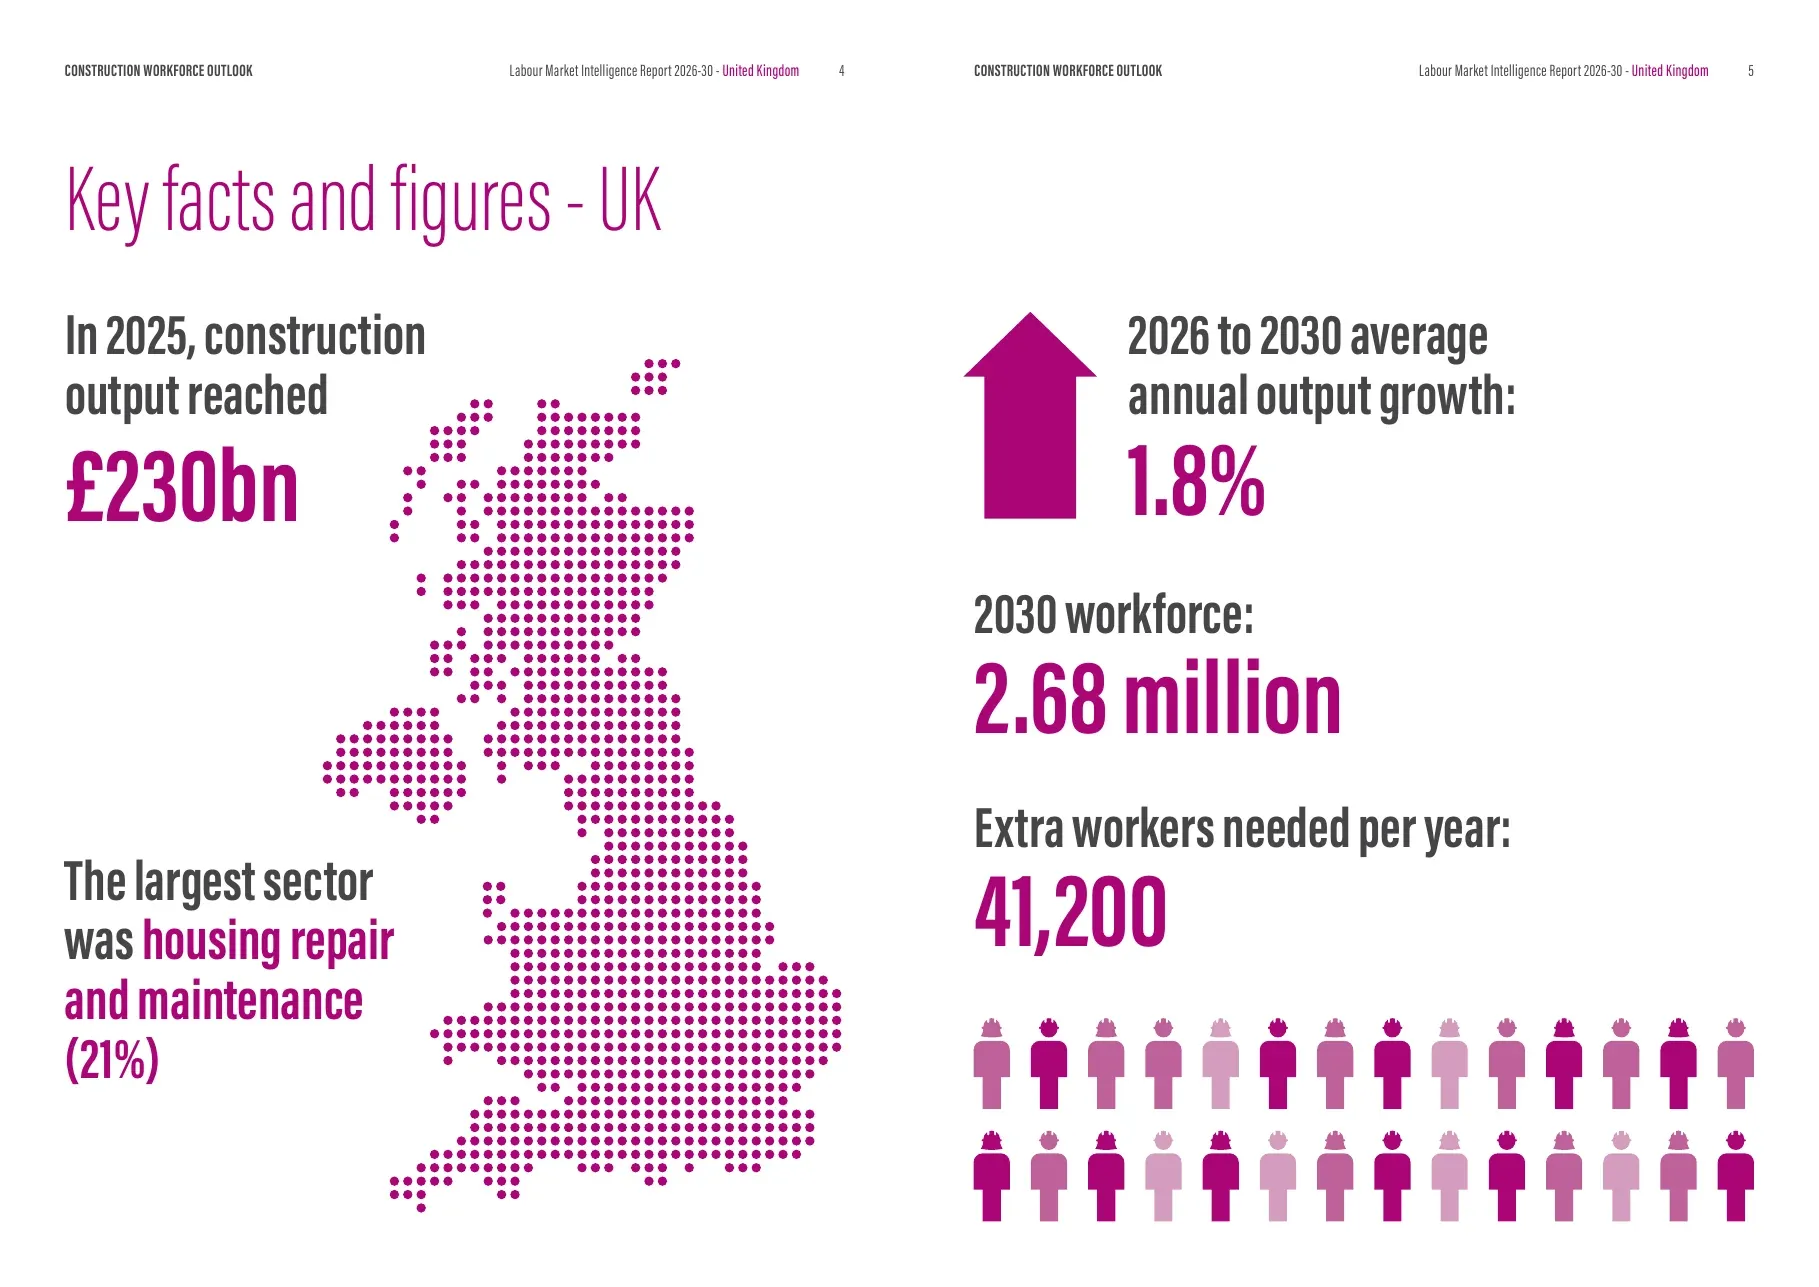 Figure 10: The UK needs 41,200 extra construction workers a year over 2026 to 2030, in an industry that produced 230 billion pounds of output in 2025. Source: CITB, Construction Workforce Outlook United Kingdom, Jun 2026. Page of the source report, captured 20 Oct 2026.
What does Canada’s forecast say?
Retirements are the main issue. Housing demand will soften before it returns.
- Construction employs 1.6 million people in Canada, about one in every 13 working Canadians (BuildForce Canada, Jul 2026).
- 135,000 residential construction workers are projected to retire by 2035, more than one-fifth of the sector’s current labor force (BuildForce Canada, Jul 2026).
- Residential employment is projected to fall 4% from 2025 levels by the end of the decade (BuildForce Canada, Jul 2026).
- Nonresidential employment is projected to rise 6% above 2025 levels by 2035 (BuildForce Canada, Jul 2026).
- BuildForce tracks nearly 800 major projects worth more than $500 billion (BuildForce Canada, Jul 2026).
- The industry unemployment rate is returning to a more traditional 5% to 6% (BuildForce Canada, Jul 2026).
What does the UK forecast say?
A smaller workforce today and a bigger hiring need ahead. Wages are growing more slowly than the economy-wide average.
- UK construction employment fell 1.6%, or 42,800 workers, in 2025 (CITB Construction Workforce Outlook, Jun 2026).
- The UK workforce is forecast to reach 2.68 million by 2030 (CITB Construction Workforce Outlook, Jun 2026).
- Construction vacancies stood at 1.7 per 100 employee jobs, down from 2.8 a year earlier (CITB Construction Workforce Outlook, Jun 2026).
- Construction wage rates rose 3.7% in 2025, against 5.1% across all industries (CITB Construction Workforce Outlook, Jun 2026).
- Median gross pay of 19.20 pounds an hour in UK construction is above the economy-wide average of 18 pounds (CITB Construction Workforce Outlook, Jun 2026).
- CITB forecasts UK construction output to fall 0.2% in 2026 and rise 1.8% in 2027 (CITB Construction Workforce Outlook, Jun 2026).
Methodology and Sources
We picked statistics from the agency, trade group or research body that produced them. We did not use roundups, listicles or competitor pages. Each figure links to the source page or report and carries the month of the data or release. Where the survey period and release differ, we use the month the data describe. Where two sources measure the same thing differently, such as the AGC and Sage outlook and the AGC and NCCER survey, we name both.
NAHB and the Home Builders Institute publish survey and economic analysis of Census Bureau and BLS data, and we cite NAHB where it is the analyst. BLS Current Population Survey figures are 2025 annual averages. We do not use a single forecast as “the” shortage number, because forecasts differ. We refresh this page monthly. For cross-trade numbers, see the skilled trade shortage page. For output, spending and firm counts, see construction industry. For the share of women in the trades, see women in construction.
Sources
- AGC and NCCER, 2026 Workforce Survey Analysis
- AGC, Construction Workforce Shortages Remain Acute news release
- AGC and Sage, 2026 Construction Hiring and Business Outlook
- Construction Labor Research Council, union settlements reported by AGC News
- NAHB, Housing Market Index September 2026 special questions
- NAHB Eye on Housing, Labor Shortages a Growing Problem
- NAHB Eye on Housing, Construction Job Openings Rising
- NAHB Eye on Housing, Wage Growth for Residential Building Workers
- NAHB Eye on Housing, Median Age in Construction Holds at 42
- NAHB Eye on Housing, How Old Are Workers in the Construction Trades
- NAHB Eye on Housing, Which States and Construction Trades Depend the Most on Immigrant Workers
- NAHB Eye on Housing, Immigrant Share in Construction Sets New Record
- NAHB Eye on Housing, Single-Family Home Construction Time Declines in 2025
- NAHB and Home Builders Institute, labor shortage study release
- Home Builders Institute, Construction Labor Market Report Fall 2025
- CPWR, The Construction Chart Book, 7th edition
- Pew Research Center, unauthorized immigrant population 2023
- U.S. Department of Labor, ApprenticeshipUSA Construction fact sheet
- Federal Reserve, Beige Book October 2026 summary
- BuildForce Canada, Construction and Maintenance Looking Forward 2026 to 2035
- CITB, Construction Workforce Outlook 2026 to 2030, United Kingdom report
- CITB, Construction Workforce Outlook interactive tool
- BLS, JOLTS construction series
- BLS, Current Employment Statistics construction series
- BLS, Employment Cost Index table 8
- BLS, Foreign-Born Workers table 4
- BLS, Employed people by detailed industry and age
- BLS, Union affiliation by occupation and industry
- BLS, Occupational separations and openings
- BLS, Occupational Outlook Handbook, construction and extraction occupations
Glossary
- AGC: Associated General Contractors of America, a construction trade group.
- BLS: U.S. Bureau of Labor Statistics.
- CITB: Construction Industry Training Board, the UK construction training body.
- CPWR: The Center for Construction Research and Training, a research group for the building trades.
- HBI: Home Builders Institute, the workforce training arm of NAHB.
- HMI: Housing Market Index, NAHB’s monthly survey of single-family home builders.
- JOLTS: Job Openings and Labor Turnover Survey, a monthly BLS survey.
- NAHB: National Association of Home Builders.
- NCCER: National Center for Construction Education and Research.