Home improvement statistics show a market that is large, steady and slow to grow. Owners still spend hundreds of billions of dollars a year on their homes. They now start fewer projects, pick smaller jobs and lean more on pros.
Every number here comes from the group that produced it, such as the Census Bureau, the Home Improvement Research Institute, the National Association of Home Builders, the New York Fed, the IRS and the big home retailers. We do not cite roundups. When two sources measure different things, we say so. Some count dollars and some count projects, so no two surveys match.
The newest government counts cover 2023 to 2025. The newest surveys run through July 2026, and the newest company results cover the second quarter of 2026. The page is updated monthly.
Key Takeaways
- Owners reported spending $827 billion on home improvements from 2021 to 2023, with a median of $6,500 per owner. (Census Bureau, 2023 American Housing Survey: Home Improvements, Oct 2024)
- 59% of the 86.9 million US homeowners made improvements, which is 51.6 million owners. (Census Bureau, 2023 American Housing Survey: Home Improvements, Oct 2024)
- Only 39% of projects were DIY, including unpaid help, in the first quarter of 2026, down from 48% a year earlier. (HIRI, Key Homeowner and Contractor Trends in Q1 2026, Jun 2026)
- Heating and cooling had the most projects of the nine types the Census Bureau listed, at 12.8 million. (Census Bureau, 2023 American Housing Survey: Home Improvements, Oct 2024)
- Just 38% of homeowners finished a project in the 90 days before the second-quarter 2026 survey, the lowest share in five quarters. (HIRI, Home Improvement Project Activity Tracker 2026 Q2, Jul 2026)
- Homeowners earning $160,000 or more spent an average of $19,590 on a project, against $3,431 for those earning under $80,000. (HIRI, Home Improvement Industry Update: Operating in a Flat Market, Sep 2026)
- Gen X and younger generations made 56% of home improvement spending in 2023, up from 38% in 2015. (HIRI, Home Improvement Industry Update: Operating in a Flat Market, Sep 2026)
- Mortgage holders had $11.7 trillion in tappable home equity in the second quarter of 2026. (ICE, August 2026 Mortgage Monitor, Aug 2026)
- At Home Depot, comparable big-ticket transactions over $1,000 grew 2.4% in the second quarter while all comparable transactions fell 1.0%. (Home Depot, Q2 fiscal 2026 earnings call, Aug 2026)
- One in four homeowners who tried a DIY project hired a pro to fix or finish it, and 55% of them regretted trying alone. (Angi, DIY Dreams vs. Reality, Aug 2026)
- By May 23, 2024, 2,338,430 returns for tax year 2023 had claimed the federal energy efficient home improvement credit. (IRS, Form 5695 Residential Energy Credits, Tax Year 2023, Aug 2024)
- About 60% of contractors reported a cancelled or delayed project in the second quarter of 2026, the highest rate since tracking began in 2024. (HIRI, Home Improvement Industry Update: Operating in a Flat Market, Sep 2026)
- 74% of remodelers said suppliers raised material prices after March 2026, by 6.7% on average. (NAHB Eye on Housing, Remodeling Market Index Q2 2026, Jul 2026)
- Home improvement loan applications eased to 1.20 million in 2024 from a peak of 1.49 million in 2022. (NAHB Eye on Housing, Home Improvement Loan Applications, Feb 2026)
How much do Americans spend on home improvement?
Spending is big, but the story has changed. Fewer owners start a project, and each project costs more.
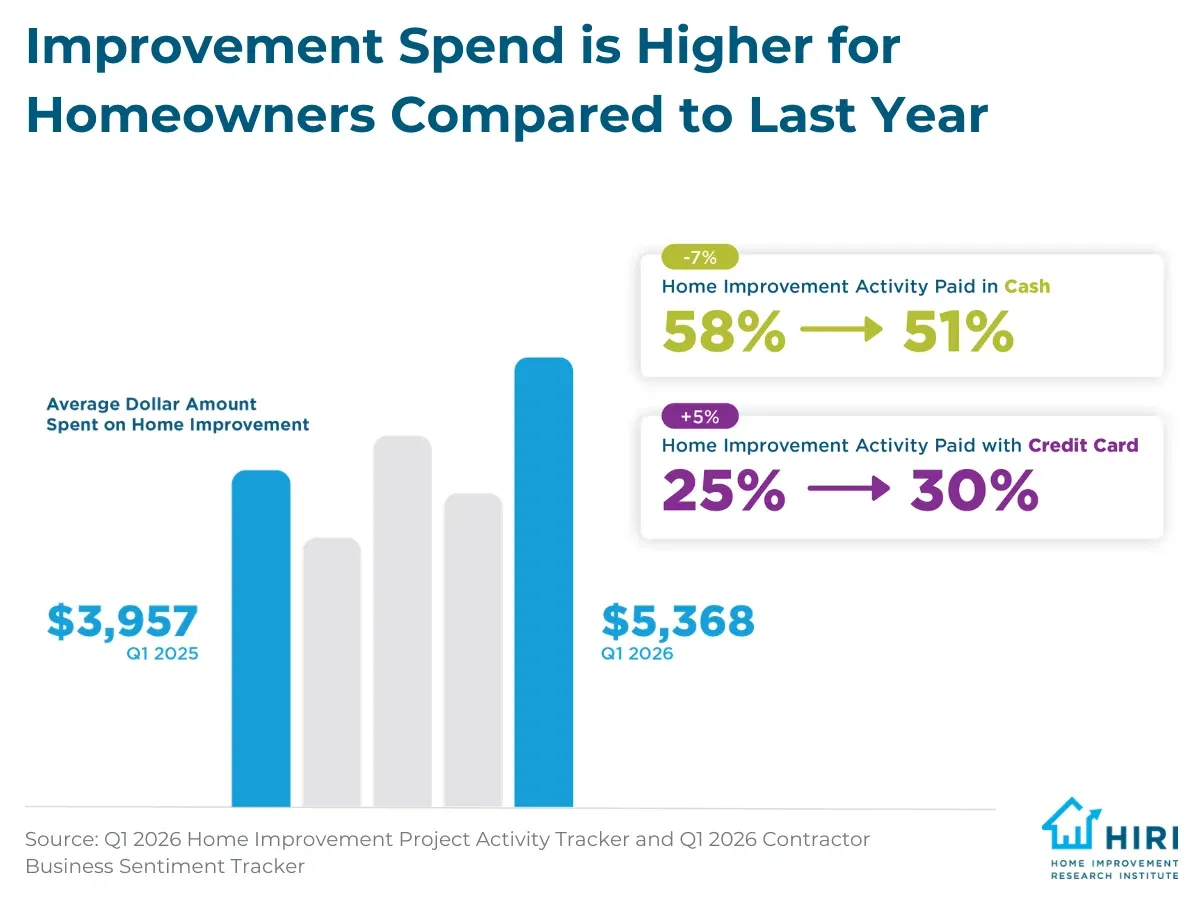 Figure 1: Fewer owners are starting projects, but the average project costs more, and more of the bill lands on a credit card. Source: HIRI, Key Homeowner and Contractor Trends in Q1 2026, Jun 2026. Chart published by the source, captured 20 Oct 2026.
How many owners improve their homes?
40% of homeowners finished a home improvement project in the first quarter of 2026, down from 44% in the first quarter of 2025 (HIRI, Key Homeowner and Contractor Trends in Q1 2026, Jun 2026).
- HIRI’s executive director said participation was 53% at the end of 2025 (HIRI, Home Improvement Industry Update: Operating in a Flat Market, Sep 2026).
- In the second quarter, participation was 31.7% for households earning under $80,000 and 46.2% for households earning $160,000 or more (HIRI, Home Improvement Industry Update: Operating in a Flat Market, Sep 2026).
- DIY owners put in an average of 38 hours in the second quarter, up from 31 hours in the first quarter and 27 hours at the end of 2025 (HIRI, Home Improvement Industry Update: Operating in a Flat Market, Sep 2026).
- In Census data for 2021, 47% of homeowners did interior projects, the most common type (Census Bureau, Cost of Improving and Maintaining Older Homes, Oct 2023).
What do home improvement spending statistics say about a typical household?
Average spend per project reached $5,368 in the first quarter of 2026, up from $3,957 a year earlier (HIRI, Key Homeowner and Contractor Trends in Q1 2026, Jun 2026).
- In the next quarter, average spend among active households more than doubled, even as fewer owners took on projects (HIRI, Home Improvement Project Activity Tracker 2026 Q2, Jul 2026).
- Cash covered 51% of home improvement activity, down from 58%, and credit cards covered 30%, up from 25% (HIRI, Key Homeowner and Contractor Trends in Q1 2026, Jun 2026).
- Homeowners expected to spend about $3,100 on home improvement over the next 12 months (HIRI, What’s Driving Home Improvement Spending in 2026, Feb 2026).
- Major renovations averaged nearly $24,000, while exterior, interior finish, mechanical and yard projects averaged $12,000 to $14,000 (HIRI, What’s Driving Home Improvement Spending in 2026, Feb 2026).
How much do owners spend at building material stores?
Building material and garden equipment dealers sold $398.5 billion from January to September 2026, 4.5% more than in the same months of 2025 (Census Bureau, Advance Monthly Retail Trade Survey, Oct 2026). These sales are not adjusted for price changes.
- The September advance estimate was $44.1 billion after seasonal adjustment, 0.6% below August (Census Bureau, Advance Monthly Retail Trade Survey, Oct 2026).
- Lowe’s had 780 million customer transactions in fiscal 2025, down from 801 million, at an average ticket of $106.13 (Lowe’s, 2025 Annual Report, Mar 2026).
Store counts, retailer revenue and contractor counts are on our home improvement industry page.
Which home projects do owners take on?
Owners spend on what the house needs first and on what they want second. The biggest checks go to roofs, kitchens and heating and cooling.
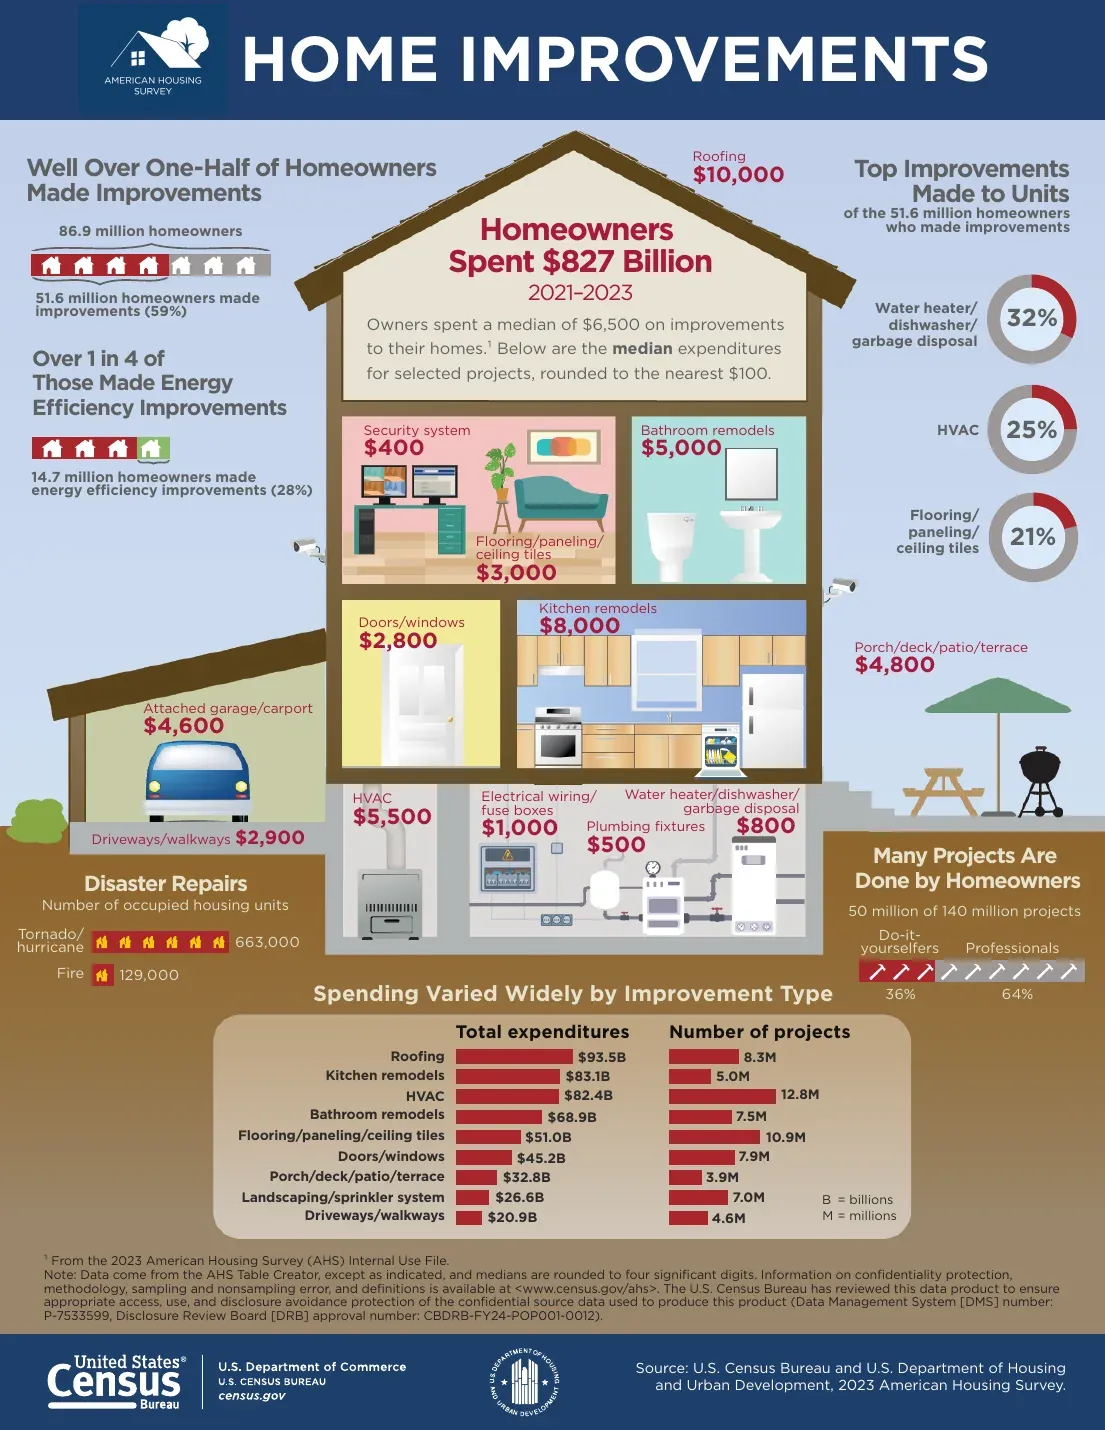 Figure 2: Roofing took the most money, but heating and cooling ran the most projects, and the typical cost of a job varied widely by type. Source: Census Bureau, 2023 American Housing Survey: Home Improvements, Oct 2024. Chart published by the source, captured 20 Oct 2026.
Which projects take the most money?
Roofing took $93.5 billion from 2021 to 2023, ahead of kitchen remodels at $83.1 billion and heating and cooling at $82.4 billion (Census Bureau, 2023 American Housing Survey: Home Improvements, Oct 2024).
- Roofing ran 8.3 million projects and kitchen remodels ran 5.0 million (Census Bureau, 2023 American Housing Survey: Home Improvements, Oct 2024).
- Bathroom remodels took $68.9 billion across 7.5 million projects (Census Bureau, 2023 American Housing Survey: Home Improvements, Oct 2024).
- Flooring, paneling and ceiling tiles took $51.0 billion across 10.9 million projects (Census Bureau, 2023 American Housing Survey: Home Improvements, Oct 2024).
- Doors and windows took $45.2 billion across 7.9 million projects (Census Bureau, 2023 American Housing Survey: Home Improvements, Oct 2024).
- Porches, decks, patios and terraces took $32.8 billion across 3.9 million projects (Census Bureau, 2023 American Housing Survey: Home Improvements, Oct 2024).
- Landscaping and sprinkler systems took $26.6 billion across 7.0 million projects (Census Bureau, 2023 American Housing Survey: Home Improvements, Oct 2024).
- Driveways and walkways took $20.9 billion across 4.6 million projects (Census Bureau, 2023 American Housing Survey: Home Improvements, Oct 2024).
What does a typical project cost?
A roof had the highest typical bill at $10,000, followed by a kitchen remodel at $8,000 (Census Bureau, 2023 American Housing Survey: Home Improvements, Oct 2024).
- Bathroom remodels had a median of $5,000, and porches, decks and patios $4,800 (Census Bureau, 2023 American Housing Survey: Home Improvements, Oct 2024).
- An attached garage or carport had a median of $4,600, and flooring, paneling and ceiling tiles $3,000 (Census Bureau, 2023 American Housing Survey: Home Improvements, Oct 2024).
- Driveways and walkways had a median of $2,900, and doors and windows $2,800 (Census Bureau, 2023 American Housing Survey: Home Improvements, Oct 2024).
- Electrical wiring and fuse boxes had a median of $1,000, and a water heater, dishwasher or garbage disposal $800 (Census Bureau, 2023 American Housing Survey: Home Improvements, Oct 2024).
- Plumbing fixtures had a median of $500, and a security system $400 (Census Bureau, 2023 American Housing Survey: Home Improvements, Oct 2024).
Which projects do most owners start?
Of the 51.6 million owners who made improvements, 32% replaced a water heater, dishwasher or garbage disposal and 21% did flooring, paneling or ceiling tiles (Census Bureau, 2023 American Housing Survey: Home Improvements, Oct 2024).
- Among renovating owners in the Houzz survey, 67% remodeled an interior room and 62% upgraded a home system (Houzz, 2026 U.S. Houzz and Home Renovation Trends Study, Apr 2026).
- Exterior work was done by 57% and outdoor projects by 54%, while only 9% built an addition (Houzz, 2026 U.S. Houzz and Home Renovation Trends Study, Apr 2026).
- Kitchens were the most common room at 26%, then guest bathrooms at 25% and primary bathrooms at 23% (Houzz, 2026 U.S. Houzz and Home Renovation Trends Study, Apr 2026).
- In HIRI’s first-quarter 2026 survey, 46% of homeowners reported a bathroom project, 28% a kitchen project and 26% a yard, garden or landscape project (HIRI, Key Homeowner and Contractor Trends in Q1 2026, Jun 2026).
- The same chart shows homeowners completing maintenance at a 74% rate, repairs at 68% and renovations at 36% (HIRI, Key Homeowner and Contractor Trends in Q1 2026, Jun 2026).
Do owners spend on needs or on wants?
Lower-income owners put about 74% of their improvement spending into maintenance, replacement and disaster repair, against 55% for higher-income owners (HIRI, Home Improvement Industry Update: Operating in a Flat Market, Sep 2026).
- When they did a repair, 62% fixed the item instead of replacing it, up from 51% in the fourth quarter of 2025 (HIRI, Key Homeowner and Contractor Trends in Q1 2026, Jun 2026).
- Maintenance was a motive for about 64% of exterior envelope projects (HIRI, What’s Driving Home Improvement Spending in 2026, Feb 2026).
- 14.7 million homeowners, or 28% of those who made improvements, made an energy efficiency upgrade (Census Bureau, 2023 American Housing Survey: Home Improvements, Oct 2024).
- Owners made disaster repairs on 663,000 occupied homes after tornadoes or hurricanes and on 129,000 after fires (Census Bureau, 2023 American Housing Survey: Home Improvements, Oct 2024).
Kitchen and bath costs and what they add to resale value are on our home remodeling page.
Who spends the most, and why are they staying put?
Higher earners and Gen X and younger owners carry the market. Many owners have no plans to move, so the money goes into the house they have.
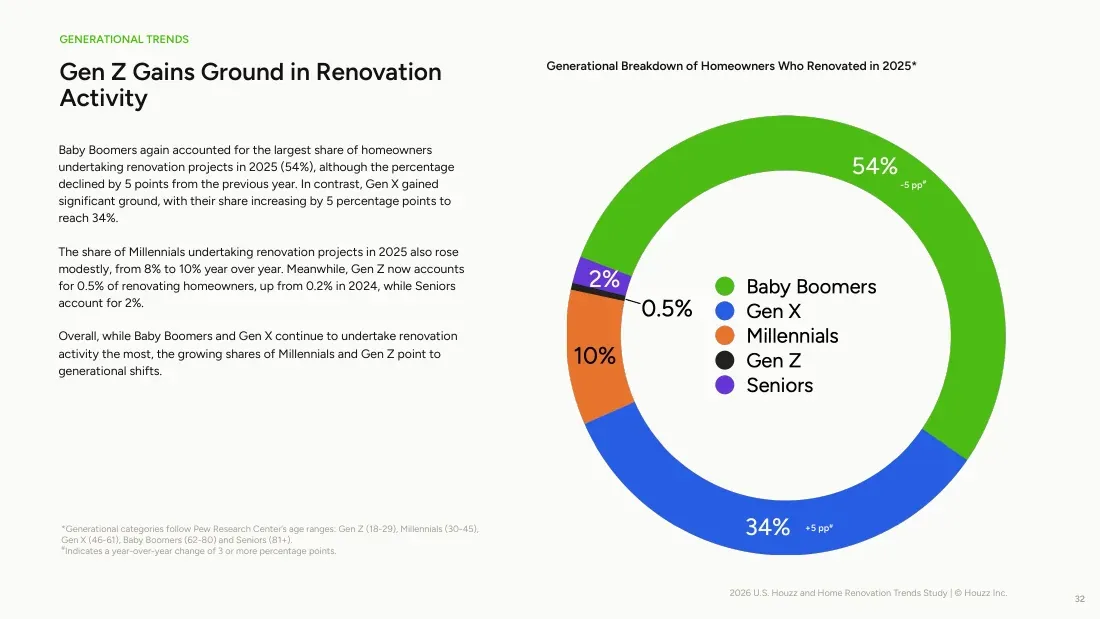 Figure 3: Baby Boomers and Gen X did almost nine in ten of the renovations in 2025, while Millennials and Gen Z made up a small but growing slice. Source: Houzz, 2026 U.S. Houzz and Home Renovation Trends Study, Apr 2026. Page from the source report, captured 20 Oct 2026.
Does income change what owners spend?
Among households that finished a project, those earning $80,000 to $159,000 spent an average of $9,806 in the second quarter of 2026 (HIRI, Home Improvement Industry Update: Operating in a Flat Market, Sep 2026).
- Spending by households earning $160,000 or more rose from $8,587 in the first quarter, and spending by households earning under $80,000 was little changed from $3,464 (HIRI, Home Improvement Industry Update: Operating in a Flat Market, Sep 2026).
- HIRI said a smaller group of higher-income households is still spending freely while others cut back (HIRI, Home Improvement Industry Update: Operating in a Flat Market, Sep 2026).
- The University of Michigan’s consumer sentiment index fell to 55.2 in July 2026, among the lowest readings ever recorded (HIRI, Home Improvement Industry Update: Operating in a Flat Market, Sep 2026).
- Real disposable income was expected to grow only 0.5% in 2026, after an earlier forecast of about 3.2% (HIRI, Home Improvement Industry Update: Operating in a Flat Market, Sep 2026).
Which generations and age groups spend the most?
Baby Boomers were 54% of renovating homeowners in 2025, Gen X 34%, Millennials 10% and seniors 2% (Houzz, 2026 U.S. Houzz and Home Renovation Trends Study, Apr 2026).
- Borrowers aged 45 to 54 held the largest share of home improvement loan applications in 2024 at 25.2% (NAHB Eye on Housing, Home Improvement Loan Applications, Feb 2026).
- Borrowers 65 and older held 18.6% of applications in 2024, up from 17.8% in 2019 (NAHB Eye on Housing, Home Improvement Loan Applications, Feb 2026).
- Borrowers aged 35 to 44 held 22.9% in 2024, up from 22.0% in 2019 (NAHB Eye on Housing, Home Improvement Loan Applications, Feb 2026).
Why are owners improving instead of moving?
Equity is high and many owners hold cheap mortgages. Among 47.5 million mortgage holders, tappable equity averaged about $212,000 each (ICE, August 2026 Mortgage Monitor, Aug 2026).
- 72% of homeowners plan to stay in their current home, and 20% say they would move if it were realistic (Housecall Pro, The State of Home Service Spending, May 2026).
- 59.4% of homeowners in the New York Fed survey expect to stay more than ten more years (New York Fed, SCE Housing Survey 2026, May 2026).
- Home Depot’s chief financial officer said housing turnover has been at historical lows, near 3% of the housing stock, for four years (Home Depot, Q2 fiscal 2026 earnings call, Aug 2026).
- For 25% of homeowners, being satisfied with their current home is an important reason not to start new projects (HIRI, 2025 Annual Report on U.S. Homeowner Project Activity, Apr 2026).
How old are the homes being improved?
The median age of all owned homes was 41 years in the 2021 American Housing Survey, and homes built before 1950 were about 17% of them (Census Bureau, Cost of Improving and Maintaining Older Homes, Oct 2023).
- Owners of those older homes spent a median of $1,800 a year on upkeep (Census Bureau, Cost of Improving and Maintaining Older Homes, Oct 2023).
- New owners of older homes spent a median of $3,900 a year, against about $1,500 for owners who had lived there at least 10 years (Census Bureau, Cost of Improving and Maintaining Older Homes, Oct 2023).
- About 61% of owners of older homes started a home improvement project between 2019 and 2021, spending a median of $4,100 in total (Census Bureau, Cost of Improving and Maintaining Older Homes, Oct 2023).
- The typical age of a home rose from 31 years in 2006 to 41 years in 2023 (NAHB, Remodeling outlook at the International Builders’ Show, Feb 2026).
- 42% of homeowners in a survey of more than 1,100 owners had owned their home 10 years or more (Housecall Pro, The State of Home Service Spending, May 2026).
Is aging in place creating new demand?
75% of older adults want to stay in their homes (AARP, Home and Community Preferences Survey, Dec 2024).
- 43% of older adults say they will need to make their homes more accessible as they age (AARP, Home and Community Preferences Survey, Dec 2024).
- 72% of adults 50 and older said it is extremely important to have trustworthy, high-quality contractors in their community (AARP, Home and Community Preferences Survey, Dec 2024).
Spending by service type, online booking and lead platforms are on our home services industry page.
Do homeowners do the work themselves or hire a pro?
Pros are winning. DIY has not vanished, but it is smaller, cheaper and often mixed with paid help.
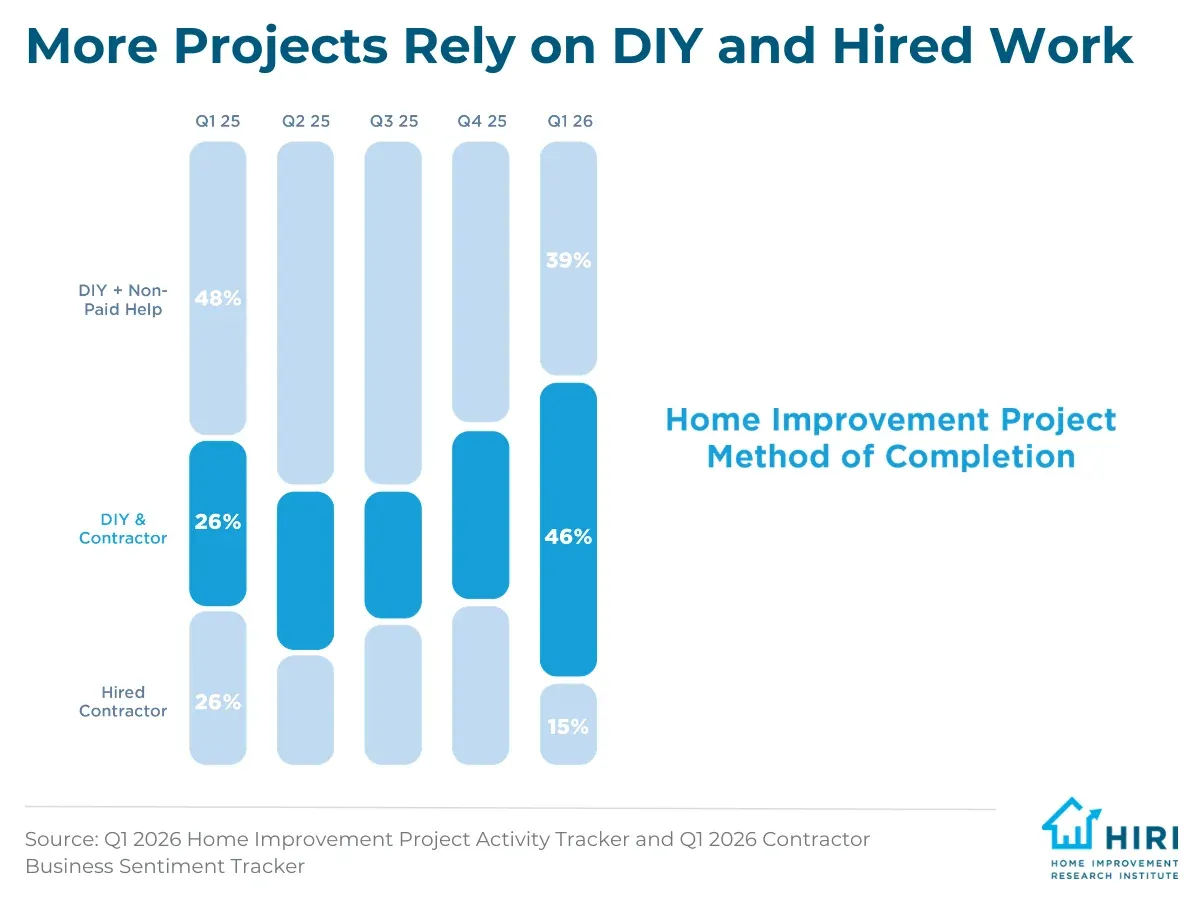 Figure 4: DIY, including unpaid help, fell as more owners mixed their own work with a contractor and fewer hired a contractor alone. Source: HIRI, Key Homeowner and Contractor Trends in Q1 2026, Jun 2026. Chart published by the source, captured 20 Oct 2026.
Who does the work?
When the Census Bureau counts projects, owners did 36% themselves, which is 50 million of 140 million projects, and pros did 64% (Census Bureau, 2023 American Housing Survey: Home Improvements, Oct 2024).
- In the first quarter of 2026, 46% of projects used both DIY and a contractor and 15% were done only by a contractor (HIRI, Key Homeowner and Contractor Trends in Q1 2026, Jun 2026).
- When homeowners hire a pro, the main reasons are technical expertise (64%), expert work quality (64%), guaranteed workmanship (52%) and ease and convenience (50%) (HIRI, Home Improvement Industry Update: Operating in a Flat Market, Sep 2026).
- HIRI’s yearly report found DIY completion fell in 2025 as more owners hired pros or mixed the two (HIRI, 2025 Annual Report on U.S. Homeowner Project Activity, Apr 2026).
- Home Depot said Pro customers posted positive comparable sales and outperformed DIY in its second quarter (Home Depot, Q2 fiscal 2026 earnings call, Aug 2026).
- Lowe’s said Pro, home services and online strength offset what it called persistent DIY macro pressures (Lowe’s, Q2 2026 results, Aug 2026).
- Home Depot sells installation as a service in flooring, water heaters, bath, windows, furnaces and central air systems (Home Depot, Fiscal 2025 Form 10-K, Mar 2026).
- Home Depot acts as the general contractor on those installation jobs, using third-party licensed and insured installers (Home Depot, Fiscal 2025 Form 10-K, Mar 2026).
What happens when DIY goes wrong?
70% of homeowners who tried a DIY project had problems with it, according to an Angi survey of homeowners and service pros (Angi, DIY Dreams vs. Reality, Aug 2026).
- Only 5% of homeowners called themselves DIY experts, and 26% called themselves beginners (Angi, DIY Dreams vs. Reality, Aug 2026).
- The top problems were missing tools (26%), wrong measurements (17%) and breaking something (17%) (Angi, DIY Dreams vs. Reality, Aug 2026).
- 11% damaged their home, hurt themselves or created a safety hazard (Angi, DIY Dreams vs. Reality, Aug 2026).
- 87% of those who hired a pro spent more time than planned, an average of three weeks more, and they paid $862 more than they first planned (Angi, DIY Dreams vs. Reality, Aug 2026).
- 90% of pros said they had been hired to fix a homeowner’s DIY work, which they estimated happened 37% of the time over five years (Angi, DIY Dreams vs. Reality, Aug 2026).
- 68% of pros believe poorly done DIY work costs the homeowner more in the end (Angi, DIY Dreams vs. Reality, Aug 2026).
- Pros said the DIY jobs they fix most are drywall repair (55%), plumbing (51%), electrical repair (51%) and flooring (48%) (Angi, DIY Dreams vs. Reality, Aug 2026).
- 71% said they tried DIY to save money, and 60% turned to YouTube videos to prepare (Angi, DIY Dreams vs. Reality, Aug 2026).
What do heating and cooling jobs look like?
Heating and cooling is where homeowner demand meets skilled-trade supply. The jobs are large and often cannot wait.
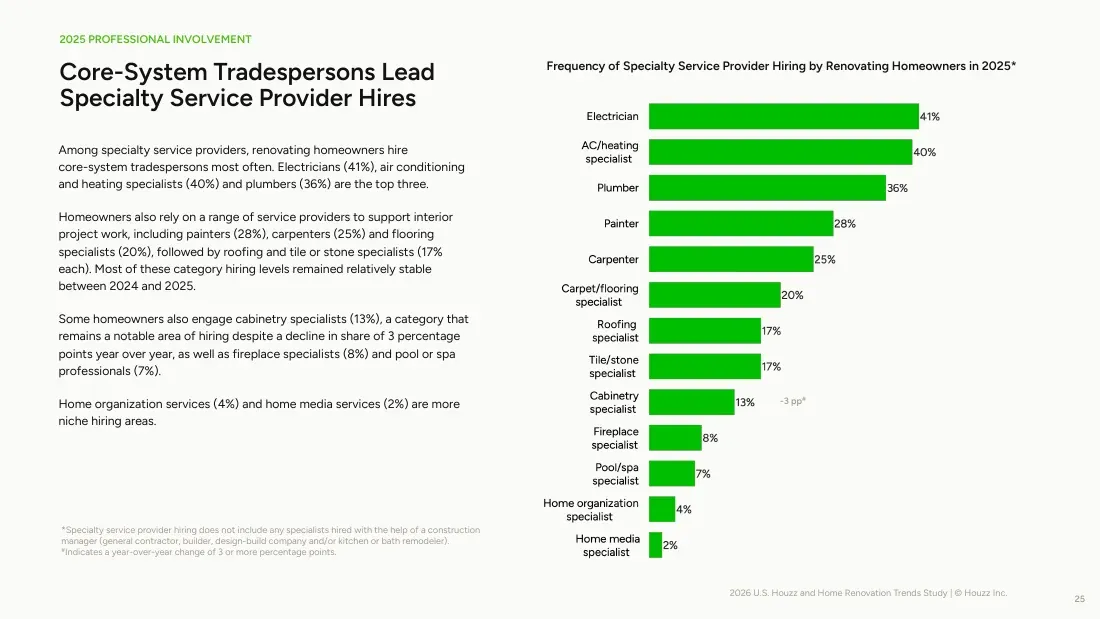 Figure 5: Air conditioning and heating specialists were the second most hired trade among renovating owners, one point behind electricians. Source: Houzz, 2026 U.S. Houzz and Home Renovation Trends Study, Apr 2026. Page from the source report, captured 20 Oct 2026.
How big are HVAC jobs for homeowners?
The median heating and cooling job cost $5,500 in the 2023 American Housing Survey (Census Bureau, 2023 American Housing Survey: Home Improvements, Oct 2024).
- One in four of the 51.6 million owners who made improvements, 25%, did HVAC work (Census Bureau, 2023 American Housing Survey: Home Improvements, Oct 2024).
- More than nine out of ten US households have air conditioning, though some communities have almost none (Census Bureau, Local Air Conditioning Estimates, Jun 2026).
- Pros told Angi that homeowners should typically avoid installing a new HVAC system themselves (Angi, DIY Dreams vs. Reality, Aug 2026).
- 40% of renovating homeowners hired an air conditioning or heating specialist in 2025 (Houzz, 2026 U.S. Houzz and Home Renovation Trends Study, Apr 2026).
- 22% upgraded heating and 21% upgraded cooling, each with a median spend of $6,000 (Houzz, 2026 U.S. Houzz and Home Renovation Trends Study, Apr 2026).
- 23% of renovating owners bought an HVAC system (Houzz, 2026 U.S. Houzz and Home Renovation Trends Study, Apr 2026).
- 20% of homeowners plan to repair or replace their HVAC system in 2026 (Housecall Pro, The State of Home Service Spending, May 2026).
- Maintenance is a motive for about 45% of mechanical system projects (HIRI, What’s Driving Home Improvement Spending in 2026, Feb 2026).
- Households earning under $80,000 are the most active in mechanical system projects (HIRI, What’s Driving Home Improvement Spending in 2026, Feb 2026).
Did tax credits move heating and cooling work?
For tax year 2023, 488,050 returns claimed the credit for central air conditioners, on $4.04 billion of costs and an average of $8,276 per return (IRS, Form 5695 Residential Energy Credits, Tax Year 2023, Aug 2024). These counts run through May 23, 2024.
- 267,780 returns claimed electric or gas heat pumps, on $3.00 billion of costs at an average of $11,213 (IRS, Form 5695 Residential Energy Credits, Tax Year 2023, Aug 2024).
- 283,390 returns claimed gas, propane or oil furnaces and boilers, on $1.75 billion of costs (IRS, Form 5695 Residential Energy Credits, Tax Year 2023, Aug 2024).
- 694,450 returns claimed windows and skylights, and 699,440 claimed insulation or air sealing (IRS, Form 5695 Residential Energy Credits, Tax Year 2023, Aug 2024).
- The credit paid up to $2,000 a year for heat pumps and water heaters, and it covers improvements made through December 31, 2025 (IRS, Energy Efficient Home Improvement Credit, Apr 2026).
Equipment shipments, heat pump sales and shop counts are on our HVAC industry page.
Is demand for home projects rising or falling?
Demand is flat, and it is moving toward repairs and smaller jobs. Owners are not leaving the market. They are waiting, shopping and planning.
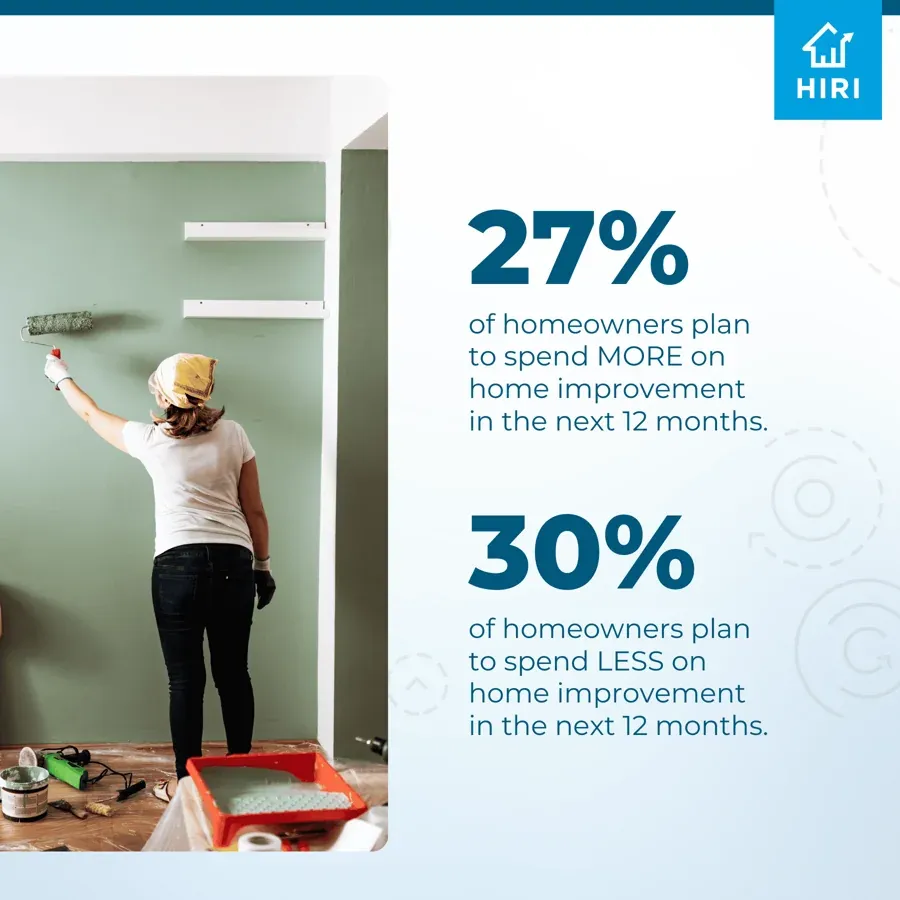 Figure 6: In the second quarter of 2026, more homeowners planned to spend less than planned to spend more, the first reversal in five quarters. Source: HIRI, Home Improvement Project Activity Tracker 2026 Q2, Jul 2026. Chart published by the source, captured 20 Oct 2026.
How many owners are starting projects?
In the second quarter of 2026, 30% of homeowners planned to spend less on home improvement over the next 12 months, against 27% who planned to spend more (HIRI, Home Improvement Project Activity Tracker 2026 Q2, Jul 2026).
- 28% had no project of $5,000 or more planned for the next year, a five-quarter high (HIRI, Home Improvement Project Activity Tracker 2026 Q2, Jul 2026).
- For jobs under $5,000, 34% said it was a bad time to start and 32% said it was a good time (HIRI, Home Improvement Project Activity Tracker 2026 Q2, Jul 2026).
- About half of homeowners expected to spend the same on home improvement in 2026 as in 2025, and a third expected to spend more (HIRI, What’s Driving Home Improvement Spending in 2026, Feb 2026).
- 40% said it was a bad time to start a project of $25,000 or more (HIRI, What’s Driving Home Improvement Spending in 2026, Feb 2026).
- The mean chance a homeowner gave of making a home investment over $5,000 in the next year was 30.2%, down from 31.2% a year earlier (New York Fed, SCE Housing Survey 2026, May 2026).
- The mean chance for the next three years was 39.1% (New York Fed, SCE Housing Survey 2026, May 2026).
- 35% of homeowners in the Houzz survey plan repairs in 2026, down from 37% the year before (Houzz, 2026 U.S. Houzz and Home Renovation Trends Study, Apr 2026).
- The median planned renovation spend fell to $15,000 from $20,000 (Houzz, 2026 U.S. Houzz and Home Renovation Trends Study, Apr 2026).
Do owners still plan big projects?
66% of homeowners plan a major home investment within five years, the highest share Angi has recorded (Angi, 2026 State of Home Spending Pulse, Aug 2026).
- 56% plan to start or continue a home project in the next three months (Angi, 2026 State of Home Spending Pulse, Aug 2026).
- 79% of homeowners plan to repair or replace at least one home system in 2026, and 26% plan a full system replacement (Housecall Pro, The State of Home Service Spending, May 2026).
- About half planned a maintenance project in the first quarter of 2026, and 30% planned a repair (HIRI, What’s Driving Home Improvement Spending in 2026, Feb 2026).
- Looking ahead, 51% of homeowners say they will focus on interior upgrades or remodeling, 48% on maintenance and repairs and 40% on exterior work (HIRI, Key Homeowner and Contractor Trends in Q1 2026, Jun 2026).
What do remodelers and retailers say about demand?
The NAHB remodeler index has stayed in a band between 59 and 70 for four years (NAHB Eye on Housing, Remodeling Market Index Q3 2026, Oct 2026).
- In the second quarter, the index was 61, down one point from the first quarter (NAHB Eye on Housing, Remodeling Market Index Q2 2026, Jul 2026).
- Home Depot’s comparable average ticket rose 2.8% in its second quarter of fiscal 2026, and it said larger discretionary projects remain under pressure (Home Depot, Q2 fiscal 2026 earnings call, Aug 2026).
- 13 of its 16 merchandising departments posted positive comparable sales in the quarter (Home Depot, Q2 fiscal 2026 earnings call, Aug 2026).
- For the full fiscal 2025, Home Depot’s comparable sales rose only 0.3% as high interest rates pressured demand (Home Depot, Fiscal 2025 Form 10-K, Mar 2026).
- In fiscal 2025, Lowe’s grew comparable sales in five of its 14 product categories, including rough plumbing and appliances (Lowe’s, 2025 Annual Report, Mar 2026).
What slows projects down and what goes wrong?
Rising costs and a thin labor pool slow the work. When jobs do start, owners hesitate, jobs get delayed and contractors wait to be paid.
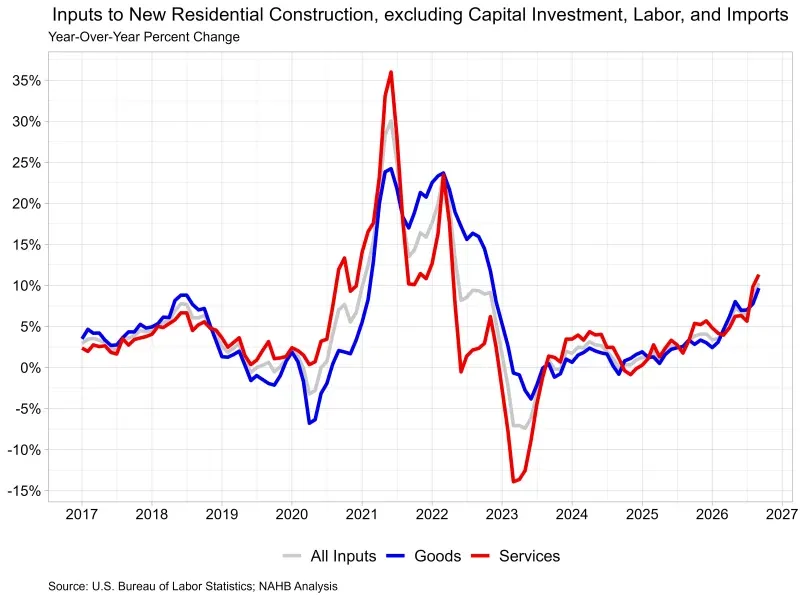 Figure 7: Prices for the goods and services that go into residential construction are climbing at the fastest pace since 2022. These inputs are for new homes, so read them as a guide to remodeling costs, not a measure of them. Source: NAHB Eye on Housing, Building Material Price Inflation, Oct 2026. Chart published by the source from BLS data, captured 20 Oct 2026.
How much have costs risen?
Building material prices for new residential construction were up 5.5% from a year earlier in September 2026, the highest rate since December 2022 (NAHB Eye on Housing, Building Material Price Inflation, Oct 2026).
- Service inputs to residential construction rose 11.3% over the year, with trade services up 14.0% (NAHB Eye on Housing, Building Material Price Inflation, Oct 2026).
- Energy input prices were 64.1% higher than a year ago (NAHB Eye on Housing, Building Material Price Inflation, Oct 2026).
- 55% of homeowners named the economy as their top concern and 45% named inflation (HIRI, Key Homeowner and Contractor Trends in Q1 2026, Jun 2026).
Can owners find skilled labor?
NAHB said labor shortages, made worse by immigration enforcement and data center construction, are stretching the time it takes to finish projects (NAHB, Remodeling Market Index Q3 2026, Oct 2026).
- Remodelers also report that economic worry makes some customers hesitant to move ahead (NAHB, Remodeling Market Index Q3 2026, Oct 2026).
- Remodelers said cost pressures were causing project delays in the second quarter, especially for larger projects (NAHB Eye on Housing, Remodeling Market Index Q2 2026, Jul 2026).
The wider labor numbers are on our skilled trade shortage page.
What do contractors say is hardest on a live job?
Homeowner indecision was the top challenge on projects already underway, named by 40% of contractors in the second quarter of 2026, down from 49% a year earlier (HIRI, Home Improvement Industry Update: Operating in a Flat Market, Sep 2026).
- Timely payment was named by 32%, up from 29%, and cost constraints by 25% (HIRI, Home Improvement Industry Update: Operating in a Flat Market, Sep 2026).
- Quality concerns more than doubled from 6% to 14% in a year (HIRI, Home Improvement Industry Update: Operating in a Flat Market, Sep 2026).
Are quotes turning into jobs?
27% of homeowners have a quote for a project that has not started (HIRI, Home Improvement Project Activity Tracker 2026 Q2, Jul 2026).
- The share who requested a quote rose from 17% to 20% in a quarter (HIRI, Home Improvement Project Activity Tracker 2026 Q2, Jul 2026).
- 49% of contractors named inflation and 56% named the economy as the main pressures on their outlook for the next 12 months (HIRI, Key Homeowner and Contractor Trends in Q1 2026, Jun 2026).
- More than half of contractors expect the home improvement market to grow slightly or significantly over the next 12 months (HIRI, Key Homeowner and Contractor Trends in Q1 2026, Jun 2026).
Quote, price increase and flat rate data are on our pricing page.
How do owners pay for the work?
Homeowners who finance spend $12,500 per project, against $4,250 for those who do not (HIRI, Home Improvement Financing Insights, Sep 2026).
- The share of projects using financing fell from 15.2% to 13.1% in the second quarter of 2026, even as costs jumped (HIRI, Home Improvement Financing Insights, Sep 2026).
- Home improvement loan applications were 1.15 million in 2019, below the 2024 total (NAHB Eye on Housing, Home Improvement Loan Applications, Feb 2026).
Methodology and Sources
We chose each number for its source first. Each one comes from the body that ran the count, survey or filing, and each carries a link and a month. Each date is the month the publisher released the item or last updated its page. We opened every link ourselves and took each number from the page or file we read. We left out roundups, republished stats and any figure we could not open at its source. Housing counts from the American Housing Survey are the latest published, and they trail the 2026 surveys. Retail and company figures are not adjusted for price changes unless the source says so. We refresh the page monthly as new releases arrive.
Glossary
- AHS: American Housing Survey, run by the Census Bureau for the Department of Housing and Urban Development.
- DIY: do it yourself.
- HIRI: Home Improvement Research Institute, which runs quarterly homeowner and contractor trackers.
- NAHB: National Association of Home Builders.
- RMI: Remodeling Market Index, a quarterly NAHB survey of remodelers. A reading above 50 means more remodelers rate the market good than poor.
- SCE: Survey of Consumer Expectations, run by the New York Fed.
- Tappable equity: the part of an owner’s home equity that can be borrowed against, as ICE defines it.
- HVAC: heating, ventilation and air conditioning.
Sources
- AARP, Home and Community Preferences Survey, Dec 2024
- Angi, 2026 State of Home Spending Pulse, Aug 2026
- Angi, DIY Dreams vs. Reality, Aug 2026
- Census Bureau, 2023 American Housing Survey: Home Improvements, Oct 2024
- Census Bureau, Advance Monthly Retail Trade Survey, Oct 2026
- Census Bureau, Cost of Improving and Maintaining Older Homes, Oct 2023
- Census Bureau, Local Air Conditioning Estimates, Jun 2026
- HIRI, 2025 Annual Report on U.S. Homeowner Project Activity, Apr 2026
- HIRI, Home Improvement Financing Insights, Sep 2026
- HIRI, Home Improvement Industry Update: Operating in a Flat Market, Sep 2026
- HIRI, Home Improvement Project Activity Tracker 2026 Q2, Jul 2026
- HIRI, Key Homeowner and Contractor Trends in Q1 2026, Jun 2026
- HIRI, What’s Driving Home Improvement Spending in 2026, Feb 2026
- Home Depot, Fiscal 2025 Form 10-K, Mar 2026
- Home Depot, Q2 fiscal 2026 earnings call, Aug 2026
- Housecall Pro, The State of Home Service Spending, May 2026
- Houzz, 2026 U.S. Houzz and Home Renovation Trends Study, Apr 2026
- ICE, August 2026 Mortgage Monitor, Aug 2026
- IRS, Energy Efficient Home Improvement Credit, Apr 2026
- IRS, Form 5695 Residential Energy Credits, Tax Year 2023, Aug 2024
- Lowe’s, 2025 Annual Report, Mar 2026
- Lowe’s, Q2 2026 results, Aug 2026
- NAHB Eye on Housing, Building Material Price Inflation, Oct 2026
- NAHB Eye on Housing, Home Improvement Loan Applications, Feb 2026
- NAHB Eye on Housing, Remodeling Market Index Q2 2026, Jul 2026
- NAHB Eye on Housing, Remodeling Market Index Q3 2026, Oct 2026
- NAHB, Remodeling Market Index Q3 2026, Oct 2026
- NAHB, Remodeling outlook at the International Builders’ Show, Feb 2026
- New York Fed, SCE Housing Survey 2026, May 2026