Construction industry statistics describe a trade that is large, split into small firms and sensitive to the cost of materials. Spending in August 2026 sat close to where it was a year earlier, but the mix moved. Data centers and power work grew while factories, shops and new homes fell.
This page collects the numbers from the groups that produced them. They include the Census Bureau, the Bureau of Labor Statistics, the Bureau of Economic Analysis, the Geological Survey, the Federal Reserve Bank of Richmond, builder and contractor trade groups, and statistics offices in Europe, Canada, the United Kingdom and Australia. Every number links to its source and carries a date. We do not cite roundups. Where we did the arithmetic ourselves, the text says so.
The newest spending data runs through August 2026, and the newest housing starts data through September 2026. This page leaves the worker shortage to our construction labor shortage page and our skilled trade shortage page. Numbers for the heating and cooling trade are on our HVAC industry page, and plumbing is on our plumbing industry page.
Key Takeaways
- Construction spending ran at $2,203.1 billion a year in August 2026, 1.7% below a year earlier. (Census Bureau, Monthly Construction Spending, August 2026, Oct 2026)
- Private data center construction ran at $85.0 billion a year in August 2026, up 73.2% from a year earlier. (Census Bureau, Value of Private Construction Put in Place, Oct 2026)
- 65.8% of construction employer establishments had fewer than five employees in 2023. This is our calculation from the size classes. (Census Bureau, County Business Patterns 2023, Jun 2025)
- There were 3,042,704 construction businesses with no paid employees in 2024. (Census Bureau, Nonemployer Statistics 2024, Sep 2026)
- Employment at construction employers grew 40.0% from 2013 to 2023. This is our calculation from the two County Business Patterns files. (Census Bureau, County Business Patterns 2013, Dec 2024)
- Construction labor productivity fell by more than 30% from 1970 to 2020, while productivity for the whole economy doubled. (Richmond Fed, Five Decades of Decline: U.S. Construction Sector Productivity, Aug 2025)
- The producer price index for construction materials was 62.2% above its January 2020 level in September 2026. This is our calculation from the index. (BLS, PPI for construction materials (via FRED), Oct 2026)
- Construction costs were 64.4% of the average price of a new home in 2024, a record since the series began in 1998. (NAHB, Cost to Construct a Home Rose Significantly Over Last Two Years, Jan 2025)
- Regulation adds $131,734 to the price of a new single-family home, or 26.4% of the average price. (NAHB, Regulatory Costs Jump 40% in Five Years, Jun 2026)
- Builder confidence fell to 29 in October 2026, the lowest reading since June 2012. (NAHB, Builder Sentiment Falls on Rising Rates, Oct 2026)
- A net 57% of contractors expect more data center work in 2026, the highest reading among 17 project types. (AGC and Sage, 2026 Construction Hiring and Business Outlook, Jan 2026)
- BLS counted 1,064 fatal injuries in the construction sector in 2024. (BLS, Industries at a Glance: Construction, Oct 2026)
- ASCE sees a $3.7 trillion gap between planned and needed infrastructure investment. (ASCE, 2025 Report Card press release, Mar 2025)
- BLS projects construction wage and salary jobs to grow 5.0% from 2025 to 2035, a gain of 410,700. (BLS, Employment Projections 2025-2035, Table 2.1, Aug 2026)
What do US construction statistics say about 2026 spending?
Total spending is flat to slightly down, and these dollars are not adjusted for price rises, so the volume of work is lower than the headline. What gets built is changing faster than how much.
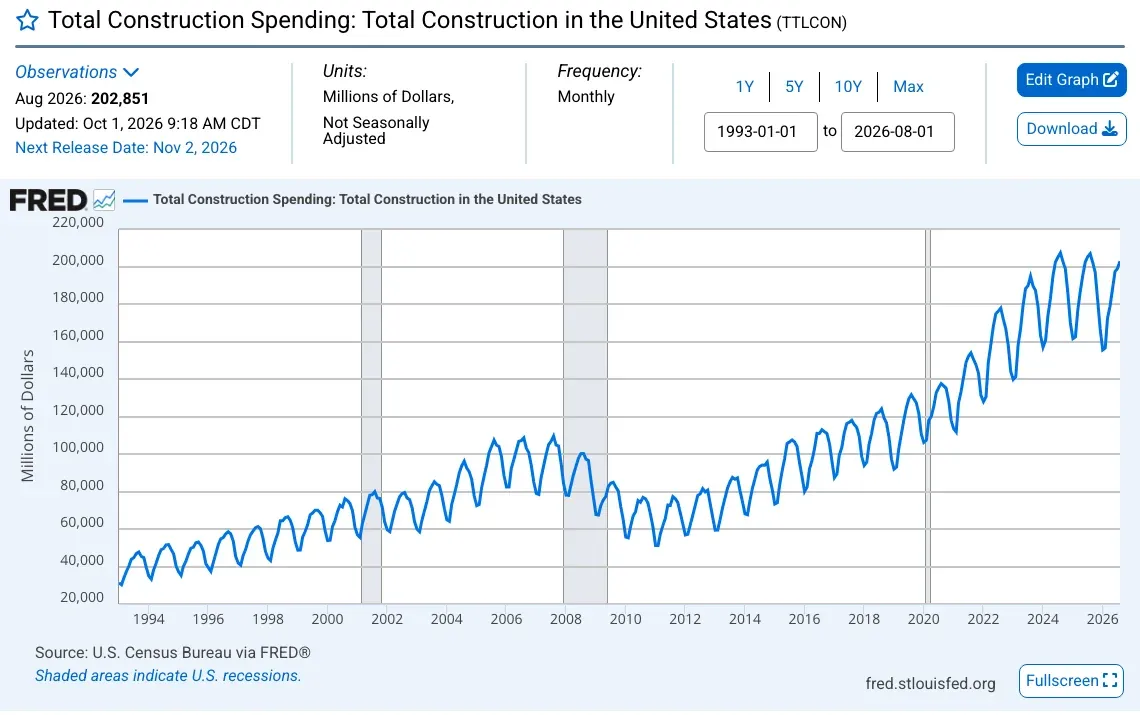 Figure 1: Monthly construction spending follows the seasons. The summer peaks of 2024 and 2025 are close in size, and 2026 is tracking at about the same level, which means growth has stalled in current dollars. Source: Census Bureau, Total Construction Spending (TTLCON), via FRED, Aug 2026. Screenshot of the source page, captured 20 Oct 2026.
How much was spent on construction in 2025 and 2026?
Spending in the first eight months of 2026 was $1,450.4 billion, 3.1% below the same months of 2025 (Census Bureau, Monthly Construction Spending, August 2026, Oct 2026).
- Spending for all of 2025 was $2,164.4 billion, 1.4% below the $2,194.8 billion spent in 2024 (Census Bureau, Monthly Construction Spending, December 2025, Feb 2026).
- Construction added $1,305.4 billion of value to the economy in 2024, which is 4.5% of GDP by our calculation (BEA, GDP by Industry, third quarter 2025 updated estimate, Jan 2026).
- BLS puts the sector at 4.4% of GDP in 2025 (BLS, Construction Labor Productivity, Sep 2026).
- BLS puts the sector at 5.2% of all nonfarm payroll jobs in 2025 (BLS, Construction Labor Productivity, Sep 2026).
Who pays for construction, private owners or governments?
Private owners paid for most of it: $1,655.3 billion at an annual rate in August 2026, 3.1% below a year earlier (Census Bureau, Value of Private Construction Put in Place, Oct 2026).
- Public owners spent $547.8 billion at an annual rate, 2.5% more than a year earlier (Census Bureau, Value of Public Construction Put in Place, Oct 2026).
- Private residential work ran at $882.3 billion, 4.8% below a year earlier (Census Bureau, Value of Private Construction Put in Place, Oct 2026).
- Private nonresidential work ran at $773.0 billion, 1.0% below a year earlier (Census Bureau, Value of Private Construction Put in Place, Oct 2026).
Which kinds of building are growing and which are shrinking?
Power work added more dollars than any other line except data centers: it ran at $186.0 billion a year in August 2026, up 8.5% (Census Bureau, Monthly Construction Spending, August 2026, Oct 2026).
- Data centers made up 63% of all private office spending, by our calculation (Census Bureau, Value of Private Construction Put in Place, Oct 2026).
- Office work that is not a data center ran at $45.8 billion, 9.7% below a year earlier (Census Bureau, Value of Private Construction Put in Place, Oct 2026).
- Manufacturing construction ran at $170.7 billion, 19.2% below a year earlier (Census Bureau, Monthly Construction Spending, August 2026, Oct 2026).
- Warehouse construction ran at $53.1 billion, 8.1% below a year earlier (Census Bureau, Value of Private Construction Put in Place, Oct 2026).
- New single-family construction ran at $403.3 billion, 3.5% below a year earlier (Census Bureau, Monthly Construction Spending, August 2026, Oct 2026).
- New multifamily construction ran at $115.8 billion, 0.6% below a year earlier (Census Bureau, Monthly Construction Spending, August 2026, Oct 2026).
- Home improvement work was about $363 billion, or 41% of private residential spending. This is our calculation: private residential spending minus new single-family and multifamily work (Census Bureau, Value of Private Construction Put in Place, Oct 2026).
How much did contractors take in during the 2022 Economic Census year?
Contractors reported $2.85 trillion of construction work done in 2022 (Census Bureau, Economic Census 2022 (construction), Dec 2025).
- Residential building contractors took in $601.4 billion (Census Bureau, Economic Census 2022 (construction), Dec 2025).
- Nonresidential building contractors took in $621.8 billion (Census Bureau, Economic Census 2022 (construction), Dec 2025).
- Heavy and civil engineering contractors took in $416.1 billion (Census Bureau, Economic Census 2022 (construction), Dec 2025).
- The sector produced $1,364.3 billion of value added (Census Bureau, Economic Census 2022 (construction), Dec 2025).
- Construction firms paid $613.2 billion to subcontractors, which shows how much of the work passes between firms (Census Bureau, Economic Census 2022 (construction), Dec 2025).
How many construction firms are there, and how small are they?
Construction is a trade of small employers and a much larger crowd of one-person shops. That shapes everything from buying power to how jobs get priced.
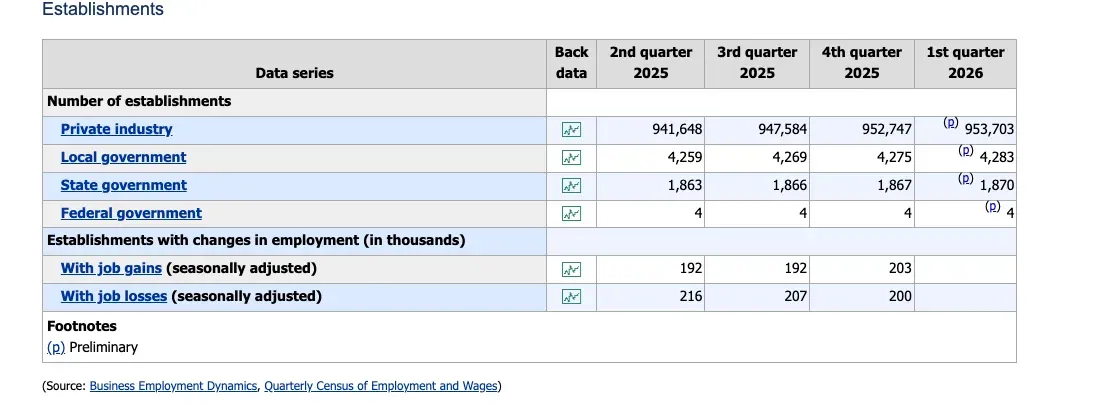 Figure 2: BLS counts private construction establishments each quarter from payroll tax records. The count rose in every quarter shown, and the government rows beneath it are tiny by comparison. Source: BLS, Industries at a Glance: Construction, Mar 2026. Screenshot of the source page, captured 20 Oct 2026.
How many construction businesses have employees?
Construction had 814,557 employer establishments in 2023 (Census Bureau, County Business Patterns 2023, Jun 2025).
- Those establishments had 7,659,459 paid employees (Census Bureau, County Business Patterns 2023, Jun 2025).
- Their annual payroll was $586.6 billion (Census Bureau, County Business Patterns 2023, Jun 2025).
- BLS counted 953,703 private construction establishments in the first quarter of 2026, a wider count than the Census one (BLS, Industries at a Glance: Construction, Oct 2026).
- The 2022 Economic Census counted 785,917 firms with paid employees (Census Bureau, Economic Census 2022 (construction), Dec 2025).
- Employer establishments rose 23.7% from 2013 to 2023, by our calculation from the 2013 file and the 2023 file (Census Bureau, County Business Patterns 2013, Dec 2024).
- Construction was 9.7% of all employer establishments but 5.5% of paid employees in 2023, by our calculation (Census Bureau, County Business Patterns 2023, Jun 2025).
How small is the typical construction employer?
Only 18.5% of construction employer establishments had 10 or more employees in 2023, by our calculation from the size classes (Census Bureau, County Business Patterns 2023, Jun 2025).
- Just 197 establishments had 1,000 employees or more (Census Bureau, County Business Patterns 2023, Jun 2025).
- Specialty trade contractors were 505,580 firms, or 64.3% of the total by our calculation (Census Bureau, Economic Census 2022 (construction), Dec 2025).
- Residential building firms numbered 203,762, against 42,367 nonresidential building firms (Census Bureau, Economic Census 2022 (construction), Dec 2025).
How many construction businesses have no employees?
Nonemployer construction businesses took in $258.2 billion in 2024 (Census Bureau, Nonemployer Statistics 2024, Sep 2026).
- That is an average of about $84,900 per business, by our calculation (Census Bureau, Nonemployer Statistics 2024, Sep 2026).
- Residential building contractors were 29.5% of the construction nonemployers, by our calculation (Census Bureau, Nonemployer Statistics 2024, Sep 2026).
How many people work in construction, and what do they earn?
Hiring has been flat for months while pay and hours keep edging up. Most of the work sits with specialty trade contractors who do one job on a building, such as wiring, plumbing or finishes.
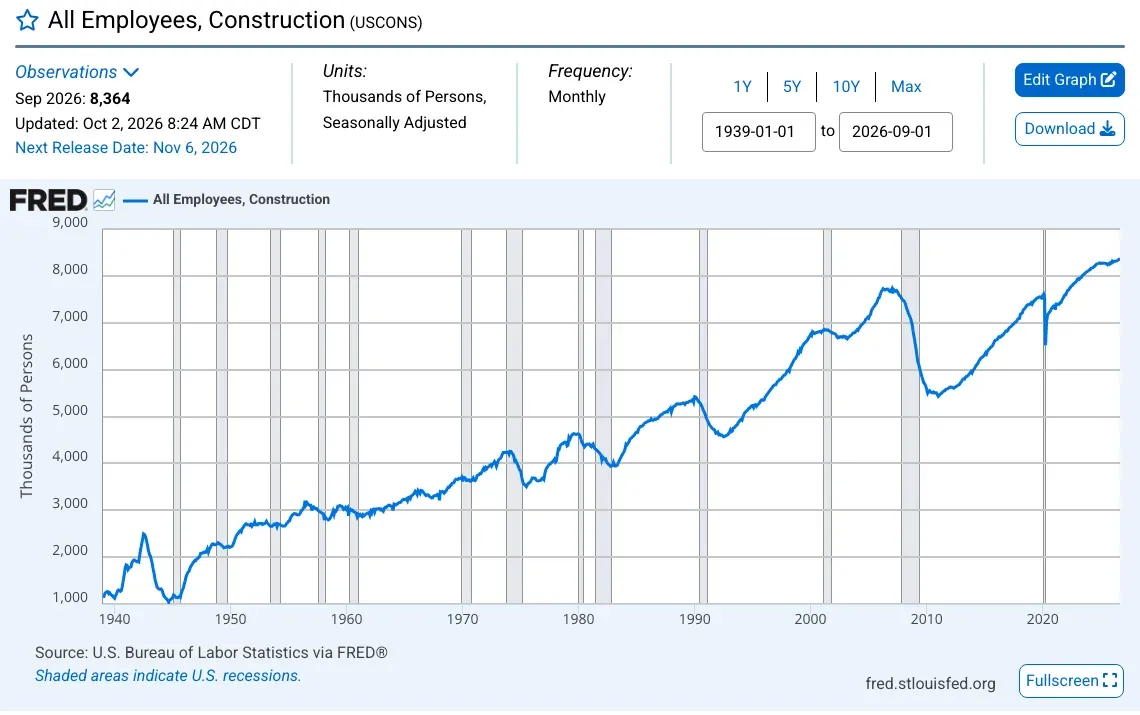 Figure 3: Construction employment has recovered from the housing bust and now sits above its 2006 peak, with a long flat stretch over the last two years. Source: BLS, All Employees, Construction (USCONS), via FRED, Sep 2026. Screenshot of the source page, captured 20 Oct 2026.
Where do construction workers work?
Nonresidential specialty trade contractors employed 2,939.6 thousand people in September 2026, more than any other part listed here (BLS, Employment Situation, September 2026, Oct 2026).
- Residential specialty trade contractors employed 2,340.3 thousand (BLS, Employment Situation, September 2026, Oct 2026).
- Heavy and civil engineering firms employed 1,210.8 thousand (BLS, Employment Situation, September 2026, Oct 2026).
- Nonresidential building firms employed 950.7 thousand (BLS, Employment Situation, September 2026, Oct 2026).
What do construction workers earn and how long do they work?
Construction employees worked 39.2 hours a week on average in September 2026, up from 39.0 a year earlier (BLS, Employment Situation, September 2026, Oct 2026).
- Construction laborers had a median wage of $47,430 a year in 2025, or $22.80 an hour (BLS, Industries at a Glance: Construction, Oct 2026).
- Operating engineers and other equipment operators had a median wage of $61,800 (BLS, Industries at a Glance: Construction, Oct 2026).
- Construction managers in the industry had a median wage of $109,160 (BLS, Industries at a Glance: Construction, Oct 2026).
- There were 929,760 construction laborers in 2025 (BLS, Industries at a Glance: Construction, Oct 2026).
Are union workers paid more?
11.1% of construction wage and salary workers were union members in 2025, up from 10.3% in 2024 (BLS, Union Members 2025, Table 3, Feb 2026).
- 12.0% were covered by a union contract in 2025 (BLS, Union Members 2025, Table 3, Feb 2026).
- Full-time union members earned a median $1,585 a week in 2025, about 40% more than full-time nonunion workers by our calculation (BLS, Industries at a Glance: Construction, Oct 2026).
How many jobs come and go, and where is employment headed?
Construction employers added 684 thousand jobs through new and growing establishments in the fourth quarter of 2025 (BLS, Industries at a Glance: Construction, Oct 2026).
- They lost 643 thousand jobs through closing and shrinking establishments in the same quarter (BLS, Industries at a Glance: Construction, Oct 2026).
- Wage and salary employment in construction grew 27.9% from 2015 to 2025 (BLS, Employment Projections 2025-2035, Table 2.1, Aug 2026).
Is construction getting more productive?
Not by most measures. Over the long run it is the one big sector where output per worker has gone backward, and the last few years add little to the picture.
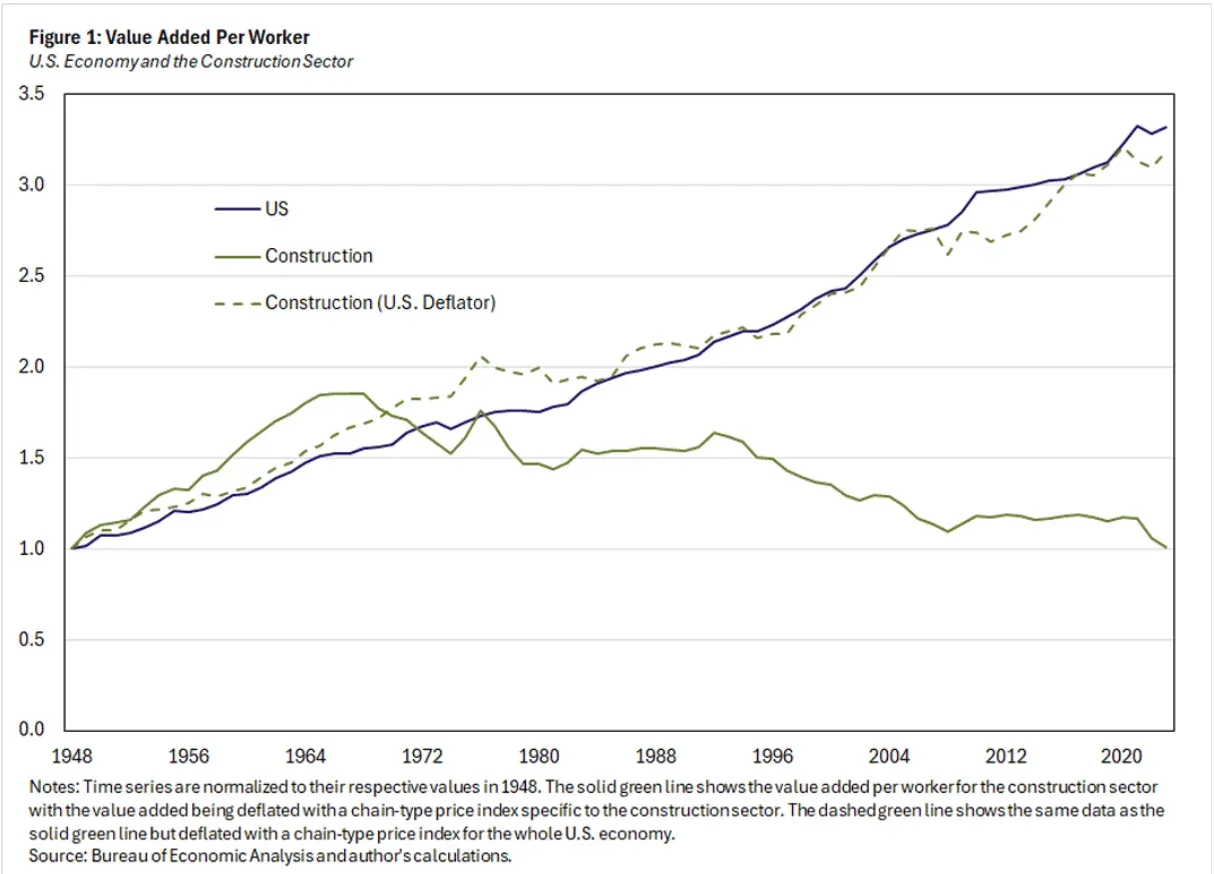 Figure 4: Output per worker for the whole economy has more than tripled since 1948 while the construction line has fallen back to where it started. Source: Richmond Fed, Five Decades of Decline: U.S. Construction Sector Productivity, Aug 2025. Chart published by the source, captured 20 Oct 2026.
How has construction productivity changed over the long run?
Labor productivity in US construction in 2023 was essentially the same as in 1948, while productivity across the economy more than tripled (Richmond Fed, Five Decades of Decline: U.S. Construction Sector Productivity, Aug 2025).
- A 2022 paper cited by the Richmond Fed finds that construction alone accounted for about one-third of the decline in trend GDP growth since World War II (Richmond Fed, Five Decades of Decline: U.S. Construction Sector Productivity, Aug 2025).
- The brief reports that after adjusting for measurement problems, construction productivity growth would still trail the whole economy by nearly 2 percentage points a year (Richmond Fed, Five Decades of Decline: U.S. Construction Sector Productivity, Aug 2025).
What did BLS find for recent years?
Output per hour in construction rose 2.0% in 2024, after a 2.4% rise in 2023 (BLS, Industries at a Glance: Construction, Oct 2026).
- Output per hour fell 7.0% in 2022 (BLS, Industries at a Glance: Construction, Oct 2026).
- Total factor productivity, which counts all inputs and not only hours, rose 1.3% in 2024 (BLS, Industries at a Glance: Construction, Oct 2026).
- Single-family productivity fell 4.5% in 2025 as output dropped 4.3% and hours edged up 0.2% (BLS, Construction Labor Productivity, Sep 2026).
- Multifamily productivity fell 7.4% in 2025, with output down 12.4% and hours down 5.4% (BLS, Construction Labor Productivity, Sep 2026).
- Industrial building productivity fell 12.1% in 2025, after a record 45.8% gain in 2023 (BLS, Construction Labor Productivity, Sep 2026).
- Highway, street and bridge productivity fell 1.8% in 2025 and has fallen every year since 2021 (BLS, Construction Labor Productivity, Sep 2026).
Does firm size explain the gap?
Firms with 20 to 99 employees build 45% more units per employee than the smallest firms (NBER Digest, The Stagnation of US Construction Productivity, Feb 2025).
- Firms with more than 500 employees build more than four times as many units per employee (NBER Digest, The Stagnation of US Construction Productivity, Feb 2025).
- In 1950 to 1951, 37% of homes were built in the largest 1% of development projects, against 24% in 2018 to 2019 (NBER Digest, The Stagnation of US Construction Productivity, Feb 2025).
- The authors estimate homebuilding would be about 60% more productive if its firm sizes matched manufacturing, if half of the link between size and productivity is causal (NBER Digest, The Stagnation of US Construction Productivity, Feb 2025).
- Value added per construction employee was about $182,300 in 2022, by our calculation (Census Bureau, Economic Census 2022 (construction), Dec 2025).
How much have building materials cost risen?
Materials prices have climbed much faster than most contractors can pass on without a fight. Steel is the clearest case, and tariffs and fuel sit behind much of the rest.
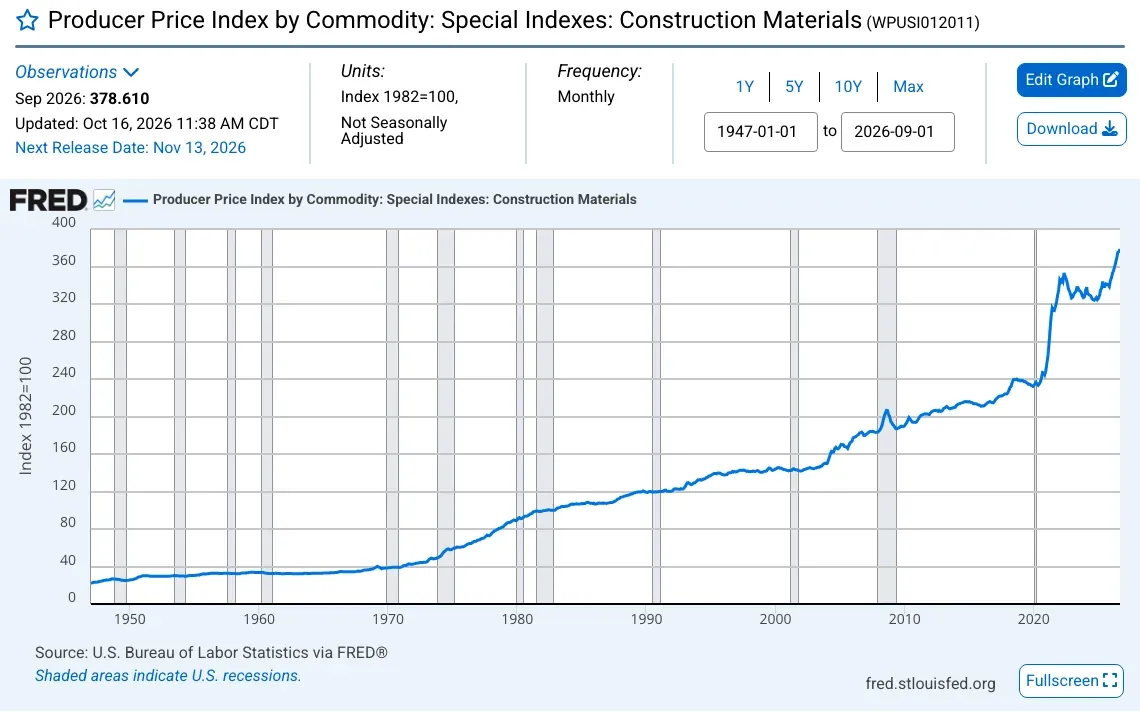 Figure 5: The producer price index for construction materials rose slowly for decades, then jumped in 2021 and has kept climbing to a new high. Source: BLS, Producer Price Index for Construction Materials (WPUSI012011), via FRED, Sep 2026. Screenshot of the source page, captured 20 Oct 2026.
How fast are prices rising now?
The construction materials index rose 11.0% over the 12 months to September 2026, by our calculation (BLS, PPI for construction materials (via FRED), Oct 2026).
- Iron and steel prices were 80.7% above January 2020 (BLS, PPI for iron and steel (via FRED), Oct 2026).
- Iron and steel prices rose 20.7% over the 12 months to September 2026 (BLS, PPI for iron and steel (via FRED), Oct 2026).
- Lumber prices were 34.7% above January 2020 (BLS, PPI for lumber (via FRED), Oct 2026).
- Lumber was still 38.9% below its May 2021 peak (BLS, PPI for lumber (via FRED), Oct 2026).
- Ready-mix concrete prices were 40.6% above January 2020 (BLS, PPI for ready-mix concrete (via FRED), Oct 2026).
Each percent change in this subsection is our calculation from the index values.
What do the basic materials cost to make?
The average mill price of cement was $160 a metric ton in 2025, up from $127 in 2021 (USGS, Mineral Commodity Summaries 2026: Cement, Feb 2026).
- The US shipped about 100 million tons of cement in 2025, worth an estimated $17 billion (USGS, Mineral Commodity Summaries 2026: Cement, Feb 2026).
- Crushed stone sold at $18.50 a ton in 2025, up from $13.26 in 2021 (USGS, Mineral Commodity Summaries 2026: Crushed Stone, Feb 2026).
- About 1,400 companies ran 3,500 quarries to produce 1.5 billion tons of crushed stone (USGS, Mineral Commodity Summaries 2026: Crushed Stone, Feb 2026).
- 72% of crushed stone went into construction aggregate, mostly roads (USGS, Mineral Commodity Summaries 2026: Crushed Stone, Feb 2026).
- Wallboard sales were an estimated 26 billion square feet in 2025 (USGS, Mineral Commodity Summaries 2026: Gypsum, Feb 2026).
- Construction took an estimated 31% of net steel mill shipments (USGS, Mineral Commodity Summaries 2026: Iron and Steel, Feb 2026).
How are contractors handling tariffs?
About 70% of contractors said tariffs affected them in the 2026 outlook survey (AGC and Sage, 2026 Construction Hiring and Business Outlook, Jan 2026).
- 40% raised their bid prices in response to tariffs (AGC and Sage, 2026 Construction Hiring and Business Outlook, Jan 2026).
- 35% passed most or all tariff costs on to project owners (AGC and Sage, 2026 Construction Hiring and Business Outlook, Jan 2026).
- 11% absorbed most or all of the cost (AGC and Sage, 2026 Construction Hiring and Business Outlook, Jan 2026).
- 32% bought early to get ahead of price rises (AGC and Sage, 2026 Construction Hiring and Business Outlook, Jan 2026).
- 13% switched from foreign to domestic producers (AGC and Sage, 2026 Construction Hiring and Business Outlook, Jan 2026).
How many homes are being built and sold?
Builders are starting fewer single-family homes and selling them at lower prices, while buyers wait for lower mortgage rates. Multifamily is the steadier side.
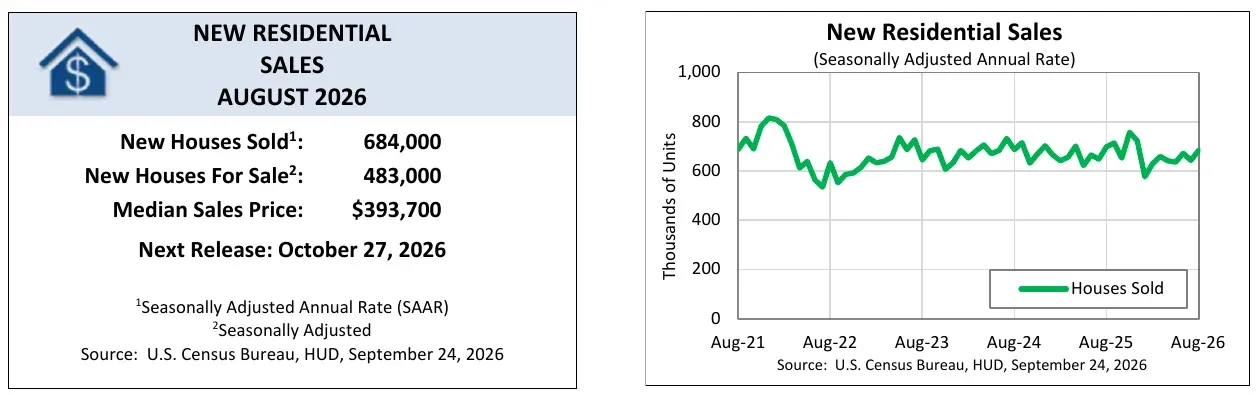 Figure 6: New home sales have moved sideways in a band between about 550 thousand and 760 thousand a year since 2022, with no sign of a breakout. Source: Census Bureau and HUD, New Residential Sales, August 2026, Sep 2026. Chart published by the source, captured 20 Oct 2026.
How many new homes are being started and sold?
Single-family housing starts ran at 859,000 a year in September 2026, 4.6% below August (Census Bureau and HUD, New Residential Construction, September 2026, Oct 2026).
- Single-family permits ran at 845,000 a year, 4.0% below August (Census Bureau and HUD, New Residential Construction, September 2026, Oct 2026).
- Starts of homes in buildings with five or more units ran at 349,000 a year (Census Bureau and HUD, New Residential Construction, September 2026, Oct 2026).
- New single-family homes sold at a rate of 684,000 a year in August 2026, 2.0% below a year earlier (Census Bureau and HUD, New Residential Sales, August 2026, Sep 2026).
- There were 483,000 new houses for sale, a supply of 8.5 months (Census Bureau and HUD, New Residential Sales, August 2026, Sep 2026).
- The median new house sold for $393,700, 5.8% below a year earlier (Census Bureau and HUD, New Residential Sales, August 2026, Sep 2026).
- By Dodge’s count, single-family starts fell 8.6% in the 12 months to August 2026 against the 12 months before, while multifamily starts rose 8.7% (Dodge Construction Network, Construction Starts, August 2026, Sep 2026).
How are builders coping?
43% of builders cut prices in October 2026, the highest share in the 2020 to 2026 period (NAHB, Builder Sentiment Falls on Rising Rates, Oct 2026).
- 65% of builders used sales incentives, the 19th month in a row above 60% (NAHB, Builder Sentiment Falls on Rising Rates, Oct 2026).
What do new homes look like?
The median size of a single-family home completed in 2025 was 2,142 square feet (Census Bureau, Characteristics of New Housing 2025, Jul 2026).
- 484,000 multifamily units were completed in 2025 (Census Bureau, Characteristics of New Housing 2025, Jul 2026).
- 678,000 new single-family homes were sold in 2025 (Census Bureau, Characteristics of New Housing 2025, Jul 2026).
- The median price of a new single-family home sold in 2025 was $417,400, and the average was $523,800 (Census Bureau, Characteristics of New Housing 2025, Jul 2026).
- 131,000 contractor-built single-family homes were started in 2025, at a median contract price of $404,000 (Census Bureau, Characteristics of New Housing 2025, Jul 2026).
How big is housing in the economy?
Housing was 15.9% of GDP in the first quarter of 2026, down from 16.5% a year earlier (NAHB Eye on Housing, Housing’s Share of GDP Dips Below 16%, Apr 2026). This counts home building, remodeling and housing services such as rent.
What does it cost to build a new home?
Most of a new home’s price is the cost of construction, and that share keeps rising. The rest is land, builder profit, overhead, and a regulatory load that has grown faster than incomes.
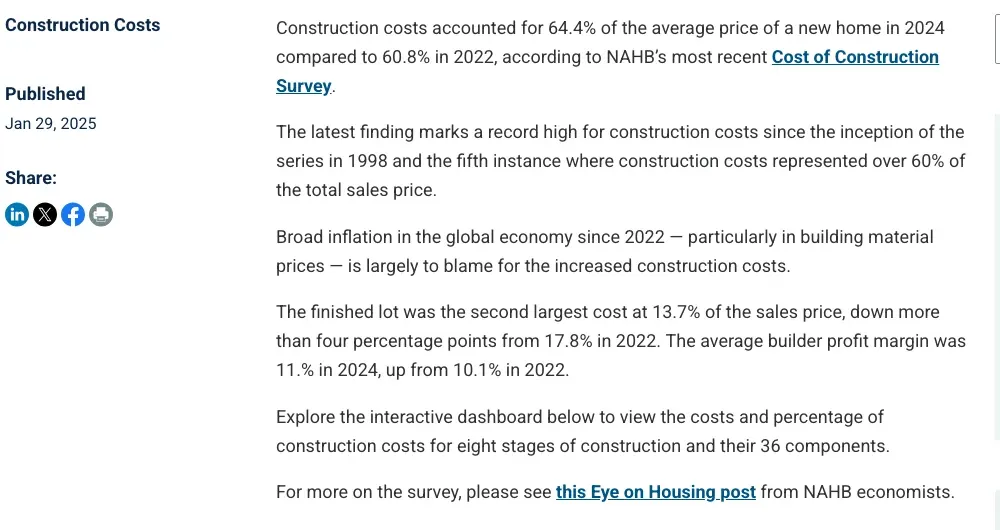 Figure 7: NAHB’s survey of builders puts construction cost at a record share of the price of a new home, with the finished lot a smaller share than in 2022. Source: NAHB, Cost to Construct a Home Rose Significantly Over Last Two Years, Jan 2025. Screenshot of the source page, captured 20 Oct 2026.
What share of the price is construction?
Construction costs were 60.8% of the price in 2022, so the 2024 share was a gain of 3.6 points (NAHB, Cost to Construct a Home Rose Significantly Over Last Two Years, Jan 2025).
- The finished lot was 13.7% of the price in 2024, down from 17.8% in 2022 (NAHB, Cost to Construct a Home Rose Significantly Over Last Two Years, Jan 2025).
- Builder profit was 11.0% of the price in 2024, up from 10.1% in 2022 (NAHB, Cost to Construct a Home Rose Significantly Over Last Two Years, Jan 2025).
- The average sales price in the survey was $665,298, with $428,215 of it construction cost (NAHB, Cost of Constructing a Home 2024, Jan 2025).
- The survey covered homes of 2,647 square feet on average, and its sample is only 41 builders, so treat it as a guide (NAHB, Cost of Constructing a Home 2024, Jan 2025).
What goes to plumbing, electrical and HVAC?
Heating and cooling cost $26,938 per home in the 2024 survey, 6.3% of construction cost (NAHB, Cost of Constructing a Home 2024, Jan 2025).
- Plumbing, except fixtures, cost $27,180 (NAHB, Cost of Constructing a Home 2024, Jan 2025).
- Electrical, except fixtures, cost $27,383 (NAHB, Cost of Constructing a Home 2024, Jan 2025).
- Building permit fees cost $7,640 per home (NAHB, Cost of Constructing a Home 2024, Jan 2025).
What does regulation add?
Regulatory costs for the average new home were $93,870 in 2021, which means the 2026 cost is more than 40% higher (NAHB, Regulatory Costs Jump 40% in Five Years, Jun 2026).
- Regulation in the construction phase rose from 13.3% to 17.0% of the price between 2021 and 2026 (NAHB, Regulatory Costs Jump 40% in Five Years, Jun 2026).
- US disposable income rose 18.3% over the same period (NAHB, Regulatory Costs Jump 40% in Five Years, Jun 2026).
What does the pipeline of commercial work look like?
The pipeline points to a split. Data centers, power and health care look full, while retail, offices and schools look thin. Contractors say funding is the problem, more often than demand.
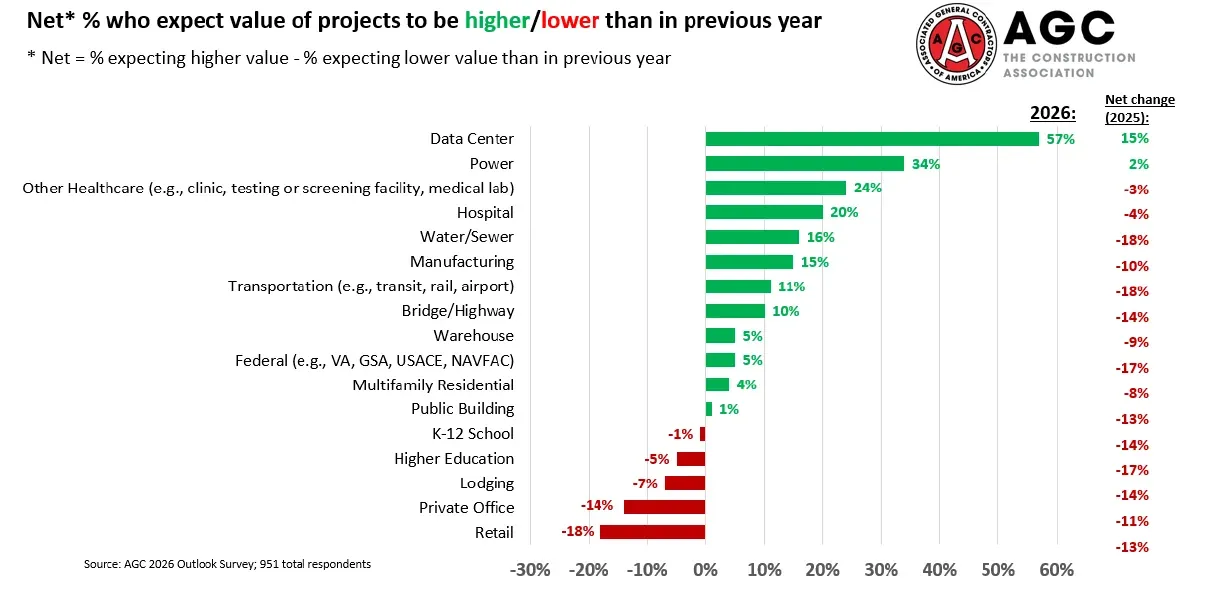 Figure 8: Contractors expect more work in data centers and power and less in retail, private offices and lodging. Most of the 17 project types lost ground against the 2025 survey. Source: AGC and Sage, 2026 Construction Hiring and Business Outlook, Jan 2026. Chart published by the source, captured 20 Oct 2026.
Which project types do contractors expect more of?
A net 34% of contractors expect more power work in 2026 (AGC and Sage, 2026 Construction Hiring and Business Outlook, Jan 2026).
- A net 24% expect more work in clinics, labs and other health care outside hospitals (AGC and Sage, 2026 Construction Hiring and Business Outlook, Jan 2026).
- A net 18% expect less retail work (AGC and Sage, 2026 Construction Hiring and Business Outlook, Jan 2026).
- A net 14% expect less private office work (AGC and Sage, 2026 Construction Hiring and Business Outlook, Jan 2026).
- The survey drew 951 responses (AGC and Sage, 2026 Construction Hiring and Business Outlook, Jan 2026).
How full are contractors’ order books?
76% of contractors were at least moderately confident in their backlog and bidding pipeline going into 2026 (AGC and Sage, 2026 Construction Hiring and Business Outlook, Jan 2026).
- 39% said backlog was larger than a year earlier, and 30% said it was smaller (AGC and Sage, 2026 Construction Hiring and Business Outlook, Jan 2026).
- 63% said a project had been postponed, scaled back or canceled in the past six months (AGC and Sage, 2026 Construction Hiring and Business Outlook, Jan 2026).
- 37% of them blamed reduced or uncertain funding (AGC and Sage, 2026 Construction Hiring and Business Outlook, Jan 2026).
What do architects and planners say about the next year?
The AIA billings index scored 47.2 in August 2026, below the 50 line that marks no change (AIA/Deltek, Architecture Billings Index, August 2026, Sep 2026).
- 48% of architecture firm leaders said they were engaging with AI (AIA/Deltek, Architecture Billings Index, August 2026, Sep 2026).
- The Dodge Momentum Index, which tracks nonresidential projects entering planning, stood at 288.0 in September 2026 (Dodge Construction Network, Dodge Momentum Index, September 2026, Oct 2026).
- The index was up 3.7% from September 2025 (Dodge Construction Network, Dodge Momentum Index, September 2026, Oct 2026).
- Institutional planning was up 17.2% over the year (Dodge Construction Network, Dodge Momentum Index, September 2026, Oct 2026).
- Commercial planning would be down 14.9% over the year without data centers (Dodge Construction Network, Dodge Momentum Index, September 2026, Oct 2026).
What do project starts show?
Total construction starts fell 24.8% in August 2026 to a rate of $1.34 trillion, after a month of megaprojects (Dodge Construction Network, Construction Starts, August 2026, Sep 2026).
- Starts were up 15.2% for the year through August (Dodge Construction Network, Construction Starts, August 2026, Sep 2026).
- Commercial starts were up 48.6% over the 12 months to August (Dodge Construction Network, Construction Starts, August 2026, Sep 2026).
- Utility and gas starts were up 87.8% over the same 12 months (Dodge Construction Network, Construction Starts, August 2026, Sep 2026).
How much does government build, and what shape is the infrastructure in?
Public owners are still paying for roads and schools, but more slowly than needs grow. ASCE rates the system a C, its best grade, and still sees a very large funding gap.
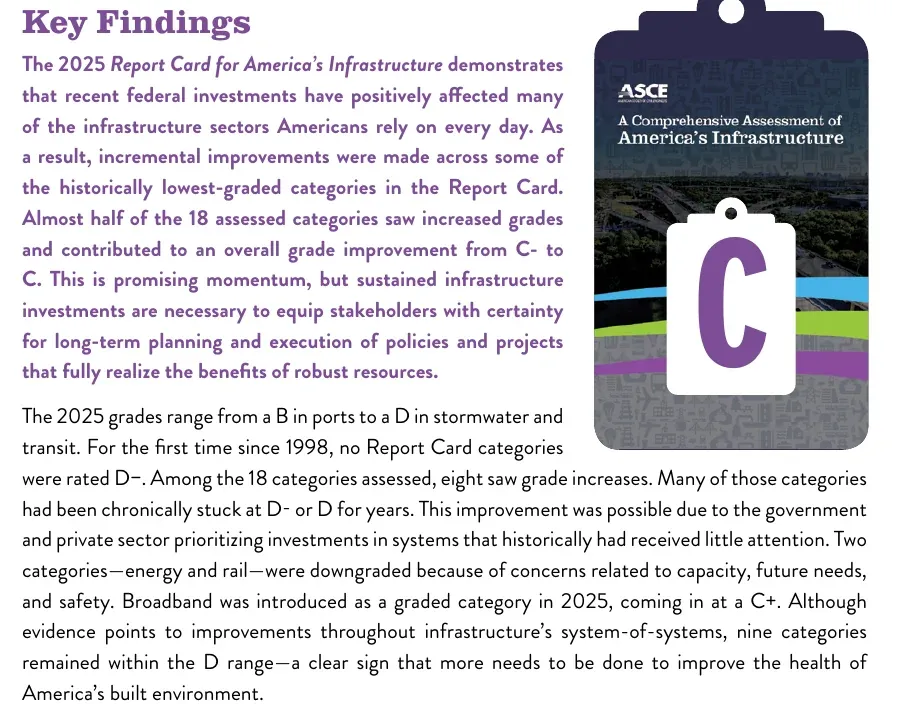 Figure 9: The 2025 Report Card gave US infrastructure an overall C, up from C minus in 2021, which is the highest grade ASCE has given. Source: ASCE, 2025 Report Card for America’s Infrastructure, Mar 2025. Screenshot of the source page, captured 20 Oct 2026.
How much does government build?
Public highway and street construction ran at $150.6 billion a year in August 2026, up 4.4% from a year earlier (Census Bureau, Value of Public Construction Put in Place, Oct 2026).
- Public educational construction ran at $113.1 billion, up 1.3% (Census Bureau, Value of Public Construction Put in Place, Oct 2026).
- Public transportation construction ran at $53.1 billion, up 4.4% (Census Bureau, Value of Public Construction Put in Place, Oct 2026).
- Public safety construction ran at $21.4 billion, down 7.7% (Census Bureau, Value of Public Construction Put in Place, Oct 2026).
- Conservation and development work ran at $16.5 billion, up 28.4% (Census Bureau, Value of Public Construction Put in Place, Oct 2026).
What grade does US infrastructure get?
The 2021 grade was C minus, so the 2025 C is a step up (ASCE, 2025 Report Card press release, Mar 2025).
- ASCE counted $9.1 trillion of needed investment across 18 categories to reach a state of good repair (ASCE, 2025 Report Card for America’s Infrastructure, Mar 2025).
- Planned public and private investment from 2024 to 2033 is $5.4 trillion (ASCE, 2025 Report Card for America’s Infrastructure, Mar 2025).
- The gap was $2.59 trillion four years earlier (ASCE, 2025 Report Card press release, Mar 2025).
- No category was rated D minus, for the first time since 1998 (ASCE, 2025 Report Card for America’s Infrastructure, Mar 2025).
- Eight categories improved their grade, and nine remain in the D range (ASCE, 2025 Report Card for America’s Infrastructure, Mar 2025).
How dangerous is construction work?
Construction is still among the deadliest trades, and deaths have barely moved in five years. The causes are well known, and falls lead them.
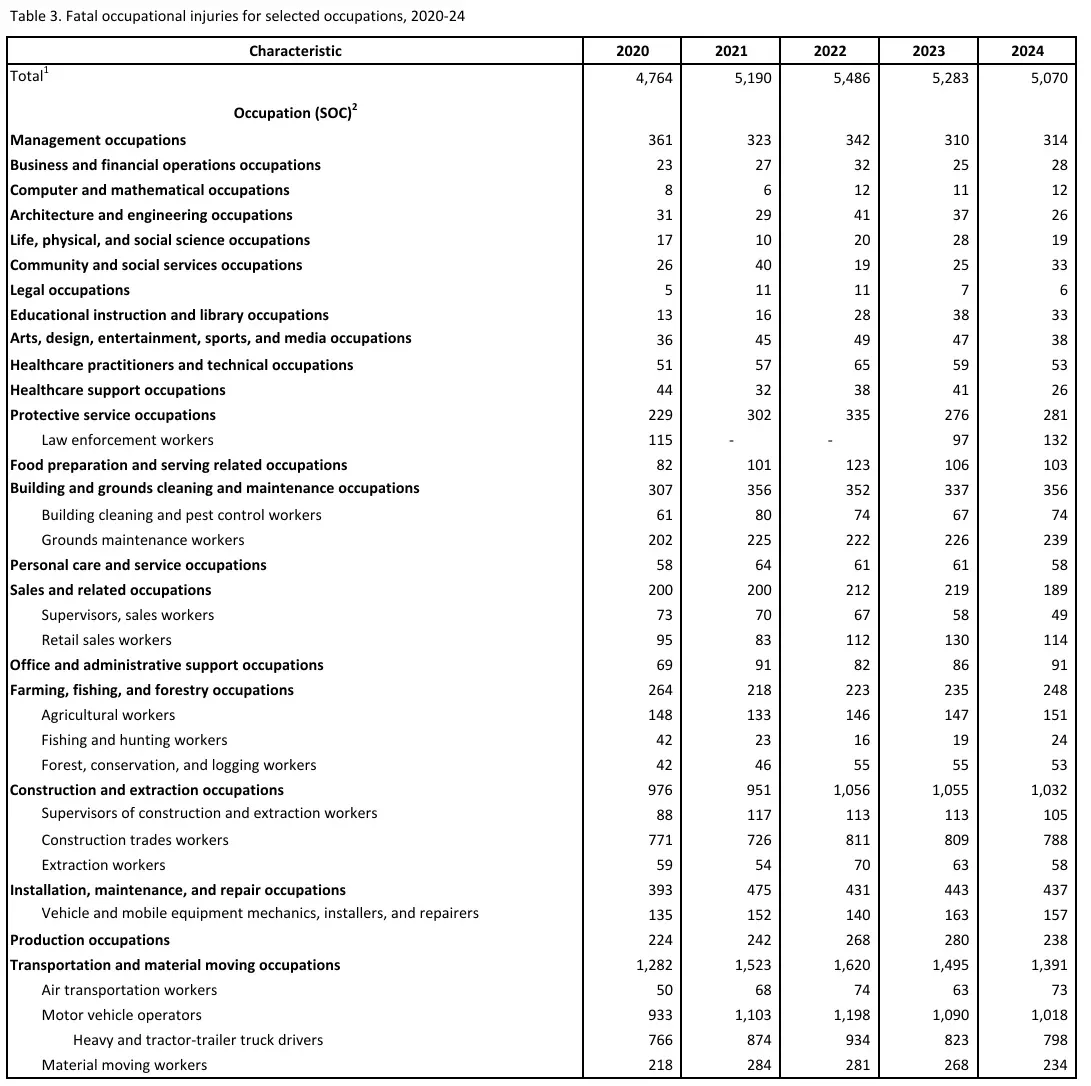 Figure 10: The BLS table shows construction and extraction deaths holding near the 1,000 mark each year, and construction trades workers make up most of them. Source: BLS, Census of Fatal Occupational Injuries 2024, Feb 2026. Screenshot of the source page, captured 20 Oct 2026.
How many construction workers die at work?
Fatalities in construction and extraction occupations were 976 in 2020 and have stayed near 1,000 a year since (BLS, Census of Fatal Occupational Injuries 2024, Feb 2026).
- They were 1,056 in 2022 (BLS, Census of Fatal Occupational Injuries 2024, Feb 2026).
- Construction trades workers accounted for 788 of the construction and extraction deaths in 2024 (BLS, Census of Fatal Occupational Injuries 2024, Feb 2026).
- Supervisors of construction and extraction workers accounted for 105 (BLS, Census of Fatal Occupational Injuries 2024, Feb 2026).
- Fatal falls, slips and trips among these workers fell 7.5% to 370 in 2024 (BLS, Census of Fatal Occupational Injuries 2024, Feb 2026).
- The injury and illness rate was 2.2 cases per 100 full-time workers in 2024 (BLS, Industries at a Glance: Construction, Oct 2026).
How does the US compare with other countries?
Elsewhere the picture is mixed. Europe is flat, Britain is falling, and Canada and Australia are growing on building work.
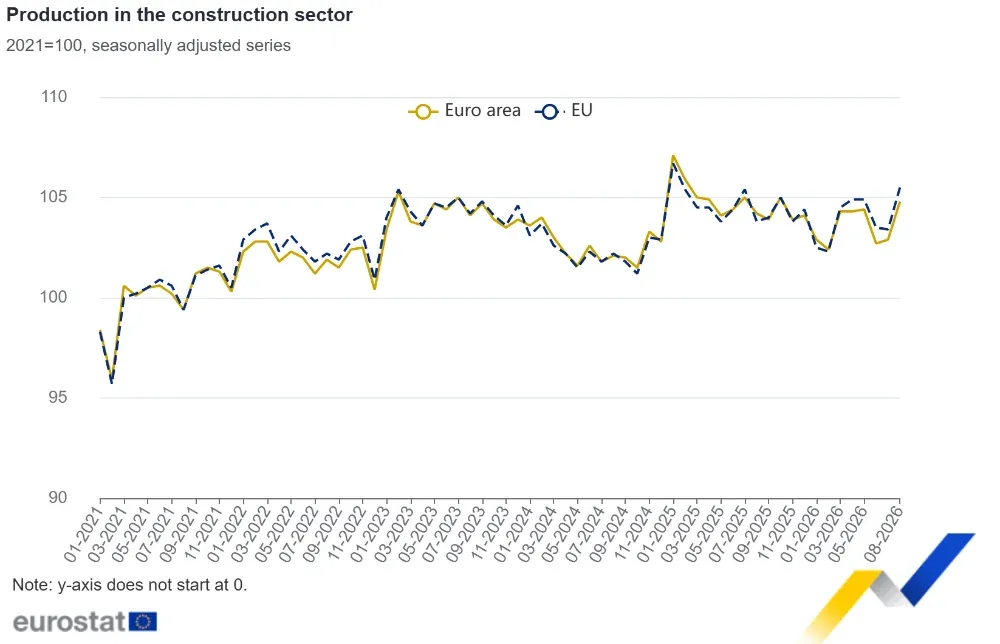 Figure 11: Production in construction in the euro area and the EU has moved in a narrow band since 2021, with a jump in August 2026. Source: Eurostat, Production in construction, August 2026, Oct 2026. Chart published by the source, captured 20 Oct 2026.
What is happening in Europe?
Euro area production in construction rose 1.8% in August 2026 from July (Eurostat, Production in construction, August 2026, Oct 2026).
- It was up 1.4% in the euro area and 2.6% in the EU from August 2025 (Eurostat, Production in construction, August 2026, Oct 2026).
- Building construction in the euro area was down 3.7% from a year earlier (Eurostat, Production in construction, August 2026, Oct 2026).
- Specialised construction activities in the euro area were up 3.1% (Eurostat, Production in construction, August 2026, Oct 2026).
What is happening in Britain?
Total construction output in Great Britain fell 1.0% in the three months to August 2026 (ONS, Construction output in Great Britain: August 2026, Oct 2026).
- Monthly output fell 0.2% in August, the fourth fall in a row (ONS, Construction output in Great Britain: August 2026, Oct 2026).
- Private new housing fell 3.2% in the three-month period (ONS, Construction output in Great Britain: August 2026, Oct 2026).
What is happening in Canada and Australia?
Canadian investment in building construction rose to $23.6 billion in July 2026, up 8.1% from a year earlier (Statistics Canada, Investment in building construction, July 2026, Sep 2026).
- Non-residential investment in Canada rose 3.2% in July to $7.4 billion (Statistics Canada, Investment in building construction, July 2026, Sep 2026).
- Australian construction work done in the June quarter of 2026 was $82.5 billion, down 2.1% from the March quarter (ABS, Construction Work Done, Australia, Preliminary, June 2026, Aug 2026).
- Australian building work was 10.0% above the same quarter of 2025 (ABS, Construction Work Done, Australia, Preliminary, June 2026, Aug 2026).
- Australian engineering work was 5.1% below the same quarter of 2025 (ABS, Construction Work Done, Australia, Preliminary, June 2026, Aug 2026).
Methodology and Sources
We chose construction numbers that a reporter could check. Each one comes from the group that produced it, such as a government statistics office, a trade group that runs its own survey, or a research bank. We opened each page or file and confirmed the number and the date before writing it down. We did not use roundup pages. Where a number is our own calculation, the text says so. Census spending figures are in current dollars and are not adjusted for price changes. Surveys from trade groups, such as the NAHB cost survey and the AGC outlook, reflect their members and not every builder. Census and BLS counts differ because they use different sources, so we do not mix them. We update this page monthly.
Glossary
- AGC: Associated General Contractors of America, a trade group for commercial builders.
- AIA: the American Institute of Architects.
- ASCE: the American Society of Civil Engineers.
- BEA: the Bureau of Economic Analysis.
- BLS: the Bureau of Labor Statistics.
- CBP: County Business Patterns, a yearly Census count of employer businesses.
- Nonemployer: a business with no paid employees, usually a one-person shop.
- PPI: the Producer Price Index from BLS.
Sources
- ABS, Construction Work Done, Australia, Preliminary, June 2026
- AGC and Sage, 2026 Construction Hiring and Business Outlook
- AIA/Deltek, Architecture Billings Index, August 2026
- ASCE, 2025 Report Card for America’s Infrastructure
- ASCE, 2025 Report Card press release
- BEA, GDP by Industry, third quarter 2025 updated estimate
- BLS, Census of Fatal Occupational Injuries 2024
- BLS, Construction Labor Productivity
- BLS, Employment Projections 2025-2035, Table 2.1
- BLS, Employment Situation, September 2026
- BLS, Industries at a Glance: Construction
- BLS, PPI for construction materials (via FRED)
- BLS, PPI for iron and steel (via FRED)
- BLS, PPI for lumber (via FRED)
- BLS, PPI for ready-mix concrete (via FRED)
- BLS, Union Members 2025, Table 3
- Census Bureau and HUD, New Residential Construction, September 2026
- Census Bureau and HUD, New Residential Sales, August 2026
- Census Bureau, Characteristics of New Housing 2025
- Census Bureau, County Business Patterns 2013
- Census Bureau, County Business Patterns 2023
- Census Bureau, Economic Census 2022 (construction)
- Census Bureau, Monthly Construction Spending, August 2026
- Census Bureau, Monthly Construction Spending, December 2025
- Census Bureau, Nonemployer Statistics 2024
- Census Bureau, Value of Private Construction Put in Place
- Census Bureau, Value of Public Construction Put in Place
- Dodge Construction Network, Construction Starts, August 2026
- Dodge Construction Network, Dodge Momentum Index, September 2026
- Eurostat, Production in construction, August 2026
- NAHB Eye on Housing, Housing’s Share of GDP Dips Below 16%
- NAHB, Builder Sentiment Falls on Rising Rates
- NAHB, Cost of Constructing a Home 2024
- NAHB, Cost to Construct a Home Rose Significantly Over Last Two Years
- NAHB, Regulatory Costs Jump 40% in Five Years
- NBER Digest, The Stagnation of US Construction Productivity
- ONS, Construction output in Great Britain: August 2026
- Richmond Fed, Five Decades of Decline: U.S. Construction Sector Productivity
- Statistics Canada, Investment in building construction, July 2026
- USGS, Mineral Commodity Summaries 2026: Cement
- USGS, Mineral Commodity Summaries 2026: Crushed Stone
- USGS, Mineral Commodity Summaries 2026: Gypsum
- USGS, Mineral Commodity Summaries 2026: Iron and Steel