Updated November 1, 2026. We refresh this page every month.
Electrician statistics describe a trade that pays above the national median, trains workers on the job and is needed in nearly every building. The jobs are growing faster than the job market as a whole. The money is good, but it swings by state and by employer.
The business side is just as telling. Most electrical contractors are small, and many have no employees at all. A shop of one to ten people has to quote, price and invoice like a bigger company, with far fewer people to do it.
This page collects the numbers that matter, each tied to the agency or research body that published it. It covers the workforce, pay, training and licensing, the electrical contracting industry, demand for electrical work, and safety. Every figure links to its source and carries a date.
Key Takeaways
- Electricians held 821,000 jobs in 2025. (BLS Occupational Outlook Handbook, Aug 2026)
- Electrician jobs are projected to grow 9% from 2025 to 2035, against 3% for all occupations. (BLS Occupational Outlook Handbook, Aug 2026)
- The median electrician earned $63,190 in May 2025, against $50,980 for all occupations. (BLS Occupational Outlook Handbook, Aug 2026)
- Median pay was $101,310 in Oregon and $49,070 in Arkansas. (BLS OEWS State Estimates, May 2026)
- Electrical contractors did $249.2 billion in business in 2022. (Census Bureau Economic Census, Dec 2024)
- 64,076 of the 83,342 electrical contractor locations with employees had fewer than 10 workers in 2023. (Census Bureau County Business Patterns, Jun 2025)
- 171,644 electrical contractors had no employees at all in 2024. (Census Bureau Nonemployer Statistics, Sep 2026)
- Electricians died on the job at a rate of 5.3 per 100,000 full-time workers in 2024, against 3.3 for all workers. (BLS Census of Fatal Occupational Injuries Rates, Feb 2026)
- Electricians were 29.9% of all active construction apprentices in 2023, more than any other trade. (CPWR Construction Chart Book, Sep 2025)
- Texas requires 8,000 hours of supervised work before a journeyman electrician license. (Texas TDLR, Oct 2026)
- US electricity demand grew 2.1% a year over the last five years, after 15 years of nearly flat use. (EIA Annual Energy Outlook, Apr 2026)
- Data centers used 4.4% of US electricity in 2023 and may use 6.7% to 12% by 2028. (DOE and LBNL, Dec 2024)
- Electrical malfunction started 23,700 home fires in 2023 and caused 305 deaths. (US Fire Administration, Feb 2025)
- Electricians in transmission, distribution and storage earned a median $71,000, 13% more than electricians in other industries. (DOE USEER, Aug 2026)
How many electricians work in the United States?
The trade is large and it is still adding jobs faster than the average occupation. The total depends on which survey you read, because employer surveys count jobs and household surveys count people.
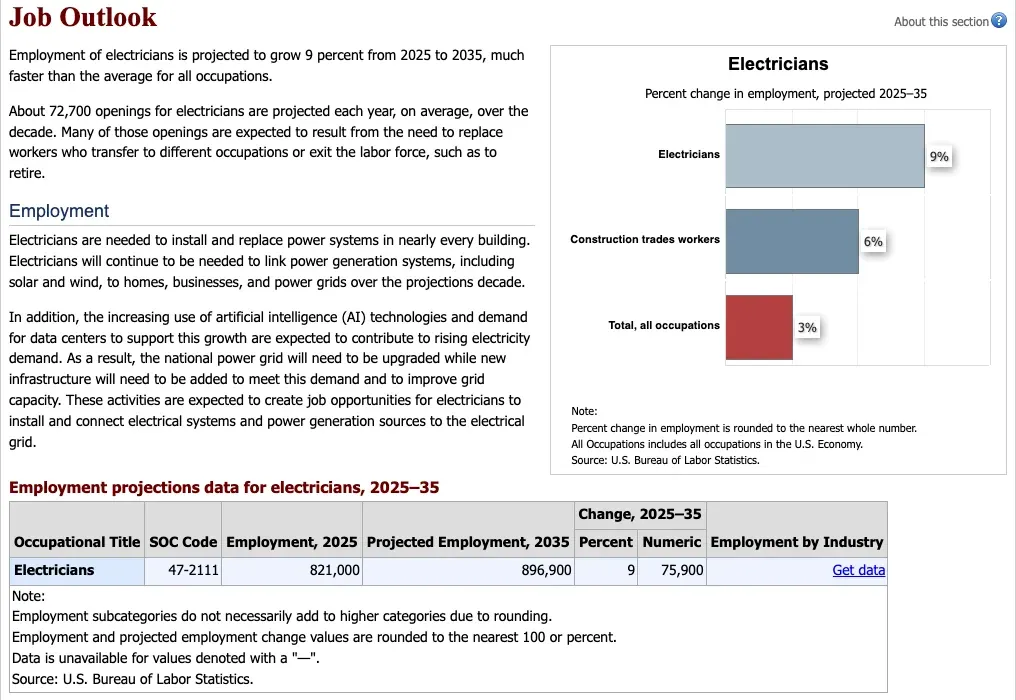 Figure 1: BLS expects electrician employment to grow faster than construction trades overall and about three times faster than all jobs, which leaves steady room for new electricians. Source: BLS, Occupational Outlook Handbook, Electricians, Aug 2026. Screenshot of the source page, captured 20 Oct 2026.
How many electricians are there?
BLS publishes more than one count. The employer survey gives the lower number and the household survey gives the higher one.
- Employers reported 757,220 electricians in wage and salary jobs in May 2025 (BLS OEWS National Estimates, May 2026).
- Texas had the most electricians at 76,770, and California was next at 73,310 (BLS OEWS State Estimates, May 2026).
- Wyoming had 10.5 electricians per 1,000 jobs, the highest rate of any state, while the District of Columbia had 3.5 (BLS OEWS State Estimates, May 2026).
- A household survey counted 1,063,000 employed electricians in 2025 (BLS Current Population Survey, Feb 2026).
Who works as an electrician?
The workforce is mostly men, and both older and younger workers make up a meaningful share. For the wider picture of women in the trades, see women in construction.
- Women were 3.5% of employed electricians in 2025 (BLS Current Population Survey, Feb 2026).
- About 191,000 electricians were 55 or older and about 167,000 were under 25, by adding the age groups (BLS Current Population Survey, Feb 2026).
How fast is the trade growing?
BLS expects steady growth and many openings, many of them from workers who move to other jobs or leave the labor force.
- BLS projects 896,900 electrician jobs by 2035, which is 75,900 more than in 2025 (BLS Occupational Outlook Handbook, Aug 2026).
- About 72,700 electrician openings are projected each year over the decade (BLS Occupational Outlook Handbook, Aug 2026).
- Electricians leave the labor force at a 2.6% annual rate, against 4.2% for all occupations (BLS Employment Projections, Aug 2026).
- About 43,100 electricians a year move to other occupations and 22,100 leave the labor force (BLS Employment Projections, Aug 2026).
- Solar photovoltaic installer jobs are projected to grow 36.5% and wind turbine technician jobs 29.5% by 2035 (BLS Employment Projections, Aug 2026).
Bureau of Labor Statistics electrician pay: how much do electricians earn?
Electricians out-earn the typical worker and the typical construction tradesperson. The spread inside the trade is wide, and employer and state explain most of it.
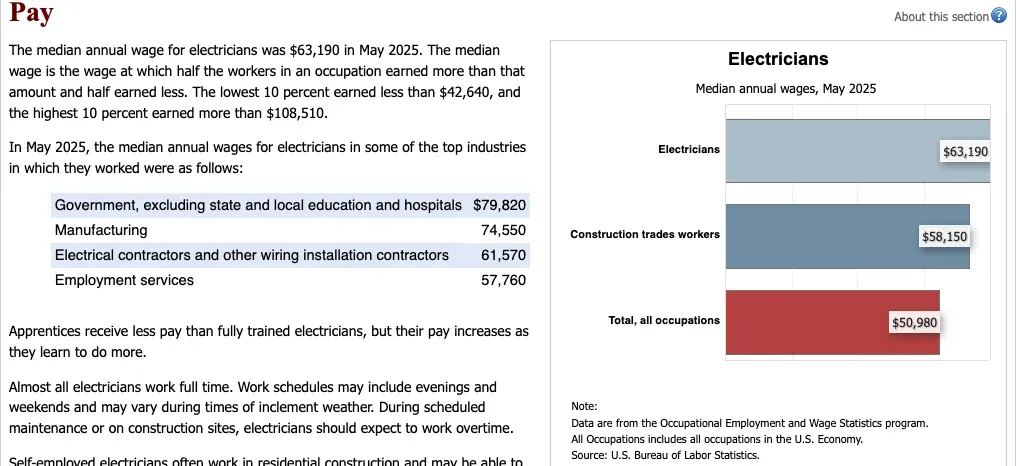 Figure 2: Electricians earn more than construction trades workers as a group and well above the all-occupation median, so labor is a large cost that a price book has to cover. Source: BLS, Occupational Outlook Handbook, Electricians, Aug 2026. Screenshot of the source page, captured 20 Oct 2026.
What does an electrician earn?
Pay spreads widely from the low end to the top. Helpers earn much less than licensed electricians.
- The middle half of electricians earned between $49,430 and $83,940, and the average was $71,490 (BLS OEWS National Estimates, May 2026).
- The lowest 10% earned less than $42,640 and the highest 10% earned more than $108,510 (BLS Occupational Outlook Handbook, Aug 2026).
- Construction trades workers as a group had a median of $58,150 (BLS Occupational Outlook Handbook, Aug 2026).
- Helpers to electricians had a median of $42,670 (BLS OEWS National Estimates, May 2026).
Which employers pay electricians the most?
Government, manufacturing and utilities pay more than contractors and staffing firms.
- Median pay was $79,820 in government, $74,550 in manufacturing, $61,570 at electrical contractors and $57,760 at employment services (BLS Occupational Outlook Handbook, Aug 2026).
- Electricians at electric power generation, transmission and distribution firms had a median of $106,640 (BLS OEWS Industry Estimates, May 2026).
- Electricians in electric power generation earned a median $72,000, a 13% premium over electricians across all industries (DOE USEER, Aug 2026)
- Electricians in energy efficiency work earned a 6% premium and those in fuels a 1% premium (DOE USEER, Aug 2026).
Which states pay electricians the most?
Pay differs a lot from state to state. A price that works in one state can lose money in another.
- Median pay was $99,560 in Illinois, $96,460 in Hawaii and $95,220 in Washington (BLS OEWS State Estimates, May 2026).
- Median pay was $58,570 in Texas and $57,250 in Florida, two of the three states with the most electricians (BLS OEWS State Estimates, May 2026).
- Median pay was $76,160 in California and $78,750 in New York (BLS OEWS State Estimates, May 2026).
- Average annual pay at electrical contractors was highest in Oregon at $104,874 and California at $104,434 (BLS QCEW, Aug 2026).
How does electrician pay compare with related jobs?
Electricians sit in the middle of the electrical career ladder. Engineers and elevator installers earn more, and solar installers earn less.
- Median pay was $125,040 for electrical and electronics engineers, $109,910 for elevator installers, $95,320 for power-line installers and $53,140 for solar photovoltaic installers (BLS Occupational Outlook Handbook, Aug 2026).
How do people become electricians, and what does a license take?
Most electricians learn the trade by working, not by sitting in a classroom. The route is long, paid and structured.
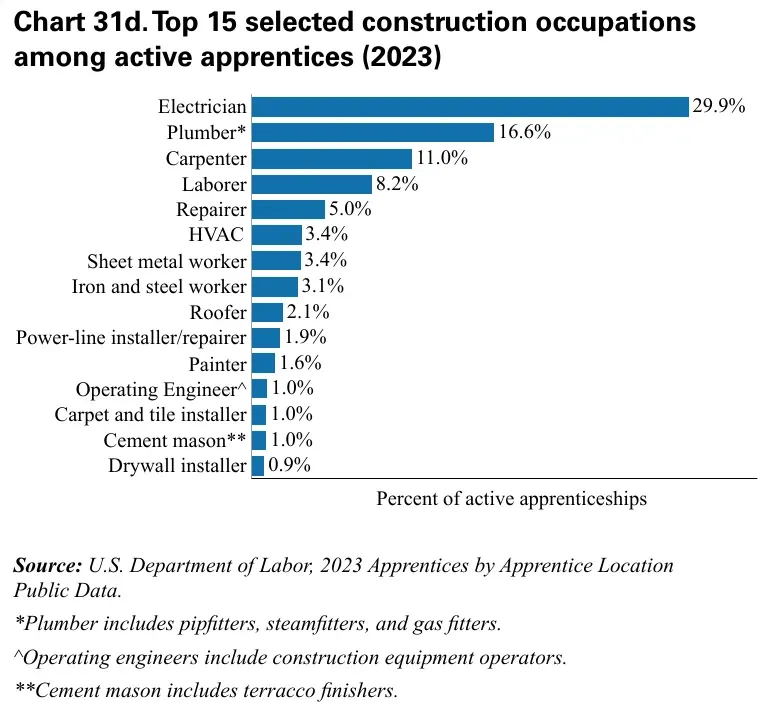 Figure 3: Electricians make up nearly a third of active construction apprentices, so the electrical trade carries the biggest share of the apprenticeship system. Source: CPWR, The Construction Chart Book 7th edition, chart 31d, Sep 2025. Chart published by the source, captured 20 Oct 2026, using US Department of Labor apprentice data for 2023.
How long does training take?
Most electricians finish a multi-year apprenticeship. Employers pay apprentices while they learn.
- Most electricians learn in a 4- or 5-year apprenticeship with 2,000 hours of paid on-the-job training each year (BLS Occupational Outlook Handbook, Aug 2026).
- 62% of respondents said a new hire needs a post-secondary certificate, 31% said a high school diploma is enough and 2% said less (O*NET OnLine Details, Oct 2026).
- 65.7% of all active construction apprentices worked in four trades: electricians, plumbers, carpenters and laborers (CPWR Construction Chart Book, Sep 2025).
- Union-sponsored programs had 61,550 new apprentice registrations in 2023 against 28,685 for non-union programs, across all construction trades (CPWR Construction Chart Book, Sep 2025).
What does an electrician license require?
Rules are set by each state. Texas shows how much a full path can take, from first day to owning a licensed contracting business.
- Most states require electricians to pass a test and be licensed (BLS Occupational Outlook Handbook, Aug 2026).
- Texas lets a journeyman candidate sit the exam after 7,000 hours of training under a master electrician (Texas TDLR, Oct 2026).
- A Texas master electrician needs 12,000 hours of training and at least two years as a journeyman (Texas TDLR, Oct 2026).
- A Texas apprentice license needs no experience and no exam (Texas TDLR, Oct 2026).
- Texas licensees complete 4 hours of continuing education before each renewal (Texas TDLR, Oct 2026).
- Texas electrical contractors must carry at least $300,000 per occurrence and $600,000 in total liability coverage (Texas TDLR, Oct 2026).
How common are unions and benefits?
Union membership is common among electricians, and so are job benefits.
- 26.9% of electricians belonged to a union in 2022 to 2024, third among construction occupations and more than double the 11.7% rate for all construction workers (CPWR Construction Chart Book, Sep 2025).
- 36.0% of electricians took part in a retirement plan in 2024, against 25.5% of all construction workers (CPWR Construction Chart Book, Sep 2025).
Electrical industry statistics: where do electricians work and how big is electrical contracting?
Two out of three electricians work for an electrical contractor. Those firms add up to a million-worker industry that is larger than it was ten years ago.
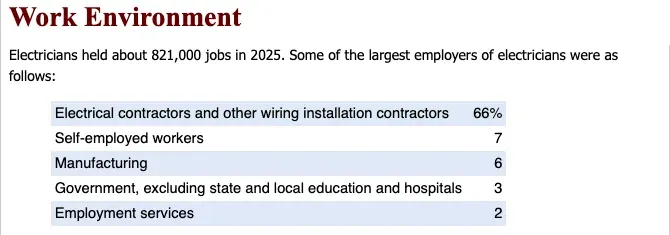 Figure 4: Electrical contractors employ about two of every three electricians, so the health of contracting decides the health of the trade. Source: BLS, Occupational Outlook Handbook, Electricians, Aug 2026. Screenshot of the source page, captured 20 Oct 2026.
Where do electricians work?
Contracting dominates, and a small share work for themselves.
- Electrical contractors employed 66% of electricians, self-employed workers 7%, manufacturing 6%, government 3% and employment services 2% (BLS Occupational Outlook Handbook, Aug 2026).
- Electrical contractors had 1,109,770 workers in May 2025, and 541,390 of them, or 48.78%, were electricians (BLS OEWS Industry Estimates, May 2026).
- Plumbing, heating and air-conditioning contractors employed 16,840 electricians (BLS OEWS Industry Estimates, May 2026).
How many people work in electrical contracting?
Employment passed one million in 2025.
- Electrical contractors had 100,285 establishments and 1,123,060 employees in 2025 (BLS QCEW, Aug 2026).
- Employment grew by 3.0%, or 32,430 jobs, from 2024 to 2025 (BLS QCEW, Aug 2026).
- Employment was 833,469 in 2015, which makes the 2025 count 34.7% higher (BLS QCEW, Aug 2026).
- California had 122,326 jobs at electrical contractors and Texas had 114,972 (BLS QCEW, Aug 2026).
- Employment grew 15.3% in Virginia and 14.5% in Ohio in 2025 (BLS QCEW, Aug 2026).
- BLS projects electrical contractor employment to grow from 1,117,200 in 2025 to 1,206,200 in 2035, up 8.0% (BLS Employment Projections, Sep 2026).
What does the industry sell?
The Economic Census, taken every five years, splits electrical contractor sales by the kind of work done.
- In 2022 there were 78,975 electrical contractor firms running 81,249 establishments (Census Bureau Economic Census, Dec 2024).
- Those firms had 968,734 employees and an annual payroll of $69.1 billion (Census Bureau Economic Census, Dec 2024).
- Electric power installation and service work, including lighting, brought in $172.8 billion, or 69.3% of sales (Census Bureau Economic Census Kind of Business, Dec 2025).
- Telecommunications installation brought in $19.1 billion and fire and security systems $17.5 billion (Census Bureau Economic Census Kind of Business, Dec 2025).
- Electronic and environmental control systems brought in $13.1 billion (Census Bureau Economic Census Kind of Business, Dec 2025).
How small are most electrical contractors?
Most electrical contractors are tiny. The typical shop has a handful of people, and many are one person with a truck.
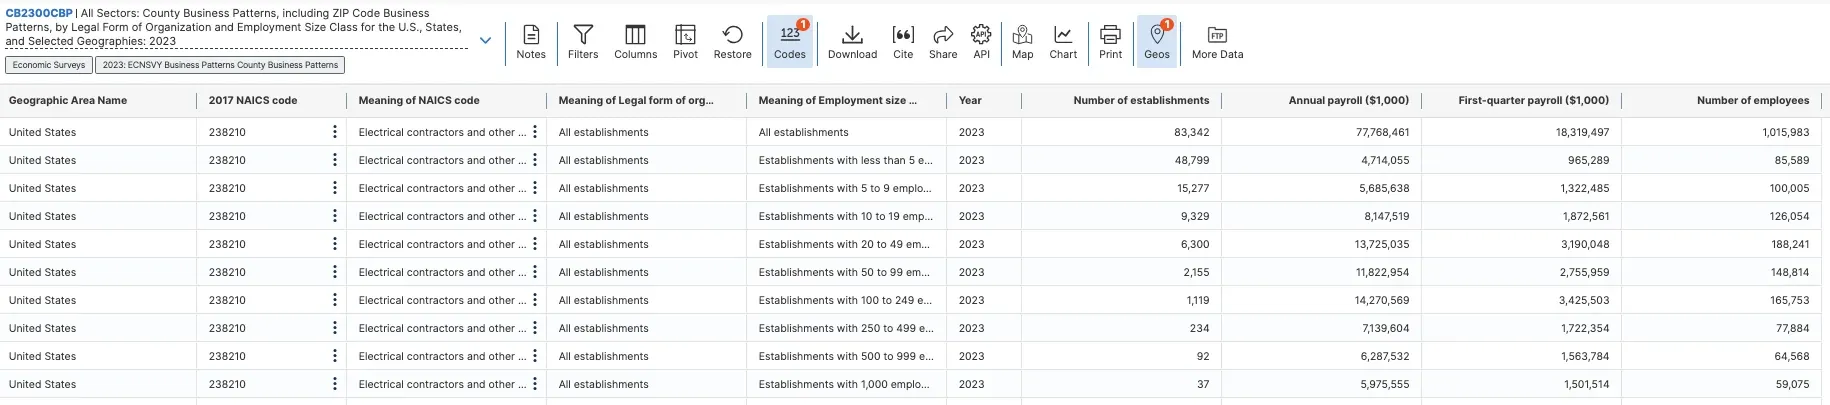 Figure 5: Nearly six in ten electrical contractor locations had fewer than five employees in 2023, so the industry runs on small crews that handle their own quotes and invoices. Source: Census Bureau, County Business Patterns 2023, table CB2300CBP, Jun 2025. Screenshot of the source page, captured 20 Oct 2026.
How many electrical contractors have fewer than ten workers?
Most of them. Very few grow past 50 employees.
- 48,799 locations had fewer than five employees and 15,277 had five to nine (Census Bureau County Business Patterns, Jun 2025).
- Only 3,637 locations, fewer than 1 in 20, had 50 or more employees (Census Bureau County Business Patterns, Jun 2025).
- The 1,015,983 employees worked at an average of 12.2 per location (Census Bureau County Business Patterns, Jun 2025).
- Annual payroll came to $77.8 billion, or about $76,545 per employee (Census Bureau County Business Patterns, Jun 2025)
- Locations with fewer than 10 employees held 18.3% of all employees, so a few large firms hold most of the jobs (Census Bureau County Business Patterns, Jun 2025).
- S corporations ran 56,718 locations, C corporations ran 11,395 and sole proprietors with staff ran 9,374 (Census Bureau County Business Patterns, Jun 2025).
How many electrical contractors work alone?
Solo operators outnumber contractors with staff.
- There were 159,693 electrical contractors with no employees in 2023, about 1.9 for every location with employees (Census Bureau Nonemployer Statistics, May 2025).
- Solo electrical contractors took in $9.8 billion in 2024, or about $57,171 each (Census Bureau Nonemployer Statistics, Sep 2026).
- The number of solo electrical contractors grew 7.5% from 2023 to 2024 (Census Bureau Nonemployer Statistics, Sep 2026).
What does it cost to run an electrical shop?
Payroll, benefits and office staff all have to be built into the price of every job, and pay has risen fast.
- Fringe benefits at electrical contractors came to $20.8 billion in 2022, equal to 30.2% of payroll (Census Bureau Economic Census, Dec 2024).
- Materials, components and supplies cost $77.0 billion in 2022, or 30.9% of sales, and work subcontracted to others cost $14.1 billion, or 5.6% (Census Bureau Economic Census, Dec 2024)
- Construction workers at electrical contractors were paid $51.1 billion for 1.53 billion hours, about $33.28 an hour, and made up 73.9% of payroll (Census Bureau Economic Census, Dec 2024)
- Sales were about $257,000 per employee and $3.2 million per firm in 2022 (Census Bureau Economic Census, Dec 2024).
- Average pay at electrical contractors was $87,578 in 2025, up 5.4% in a year (BLS QCEW, Aug 2026).
- Average pay was $58,926 in 2015, so it rose 48.6% over the decade (BLS QCEW, Aug 2026).
- Average pay at electrical contractors ran 10.7% above the $79,094 average for all private employers (BLS QCEW, Aug 2026).
- Management workers at electrical contractors earned an average $131,720, and the firms employed 88,310 office and administrative workers (BLS OEWS Industry Estimates, May 2026).
What is driving demand for electrical work?
Electricity use is rising after years of staying flat. Data centers and electric vehicles add load, and every added kilowatt needs wiring.
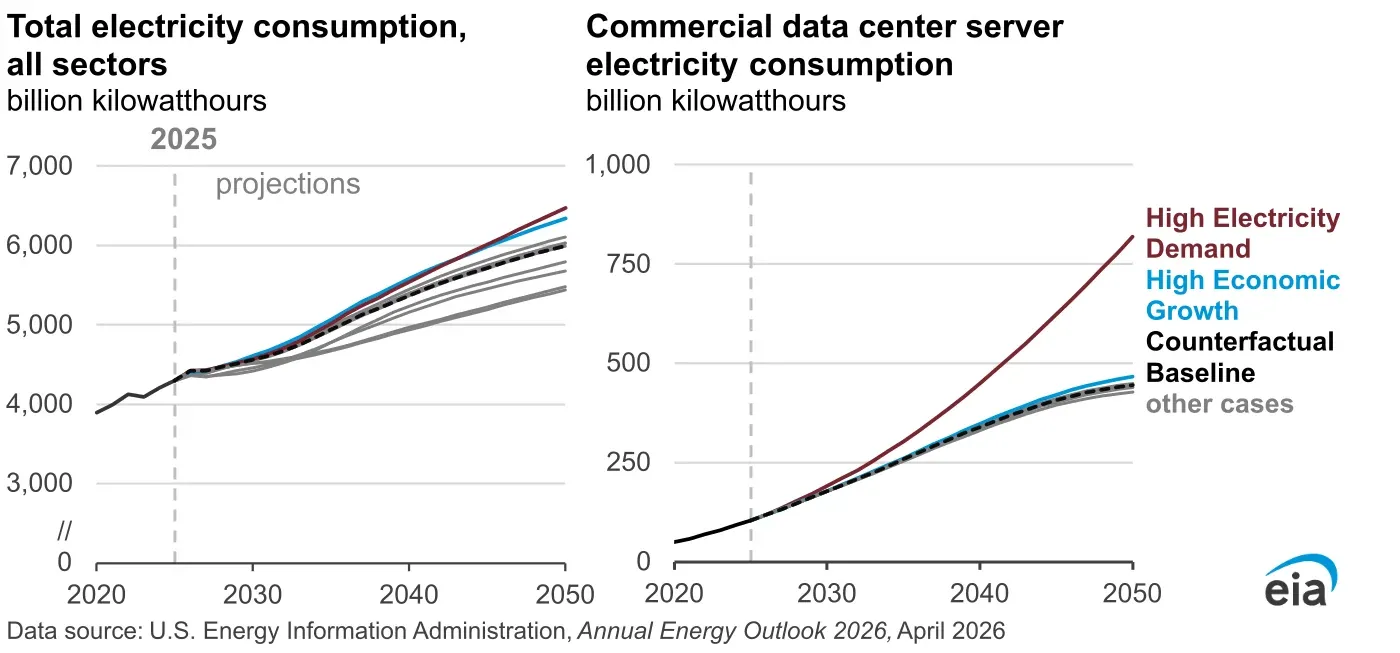 Figure 6: EIA projects total electricity use to keep climbing through 2050, with data center server use rising in every case it modeled. Source: EIA, Annual Energy Outlook 2026, Narrative, Apr 2026. Chart published by the source, captured 20 Oct 2026.
How fast is electricity demand growing?
EIA expects growth for decades, and the first signs are already in its monthly data.
- EIA projects total electricity demand to grow between 25% and 50% by 2050 across its cases (EIA Annual Energy Outlook Narrative, Apr 2026).
- Electric vehicles and data center servers account for 50% to 80% of that growth (EIA Annual Energy Outlook Narrative, Apr 2026).
- Data center server use could reach 818 billion kilowatthours in 2050 in the high demand case, more than 16 times the 2020 level (EIA Annual Energy Outlook Narrative, Apr 2026).
- US electricity use rose 4% in the third quarter of 2026 from a year earlier, with residential up 6% and commercial up 5% (EIA Short-Term Energy Outlook, Oct 2026).
- EIA expects commercial demand, which includes data centers, to grow 2.8% in 2027 and industrial demand to grow 2.7% (EIA Short-Term Energy Outlook, Oct 2026).
- EIA expects wholesale electricity prices to average $52 per megawatthour in 2026, 11% above 2025 (EIA Short-Term Energy Outlook, Oct 2026).
- Data centers used 176 terawatthours in 2023, up from 58 in 2014, and may use 325 to 580 by 2028 (DOE and LBNL, Dec 2024).
How big is the electric grid customer base?
More buildings, more meters and more power sold, at higher prices.
- The US had 163,741,126 electricity customers in 2024, 11.1% more than the 147,373,702 in 2014 (EIA Electric Power Annual, Oct 2025).
- Commercial customers grew 9.1% to 19,480,886 between 2014 and 2024 (EIA Electric Power Annual, Oct 2025)
- Utilities sold 3,975,382 thousand megawatthours in 2024, and commercial customers bought 1,450,941 thousand of that (EIA Electric Power Annual, Oct 2025).
- The average residential price was 16.48 cents per kilowatthour in 2024, up from 12.52 cents in 2014 (EIA Electric Power Annual, Oct 2025).
- Electricity revenue reached $514.4 billion in 2024, up from $393.1 billion in 2014 (EIA Electric Power Annual, Oct 2025).
- Solar generation reached 303.8 million megawatthours in 2024, more than 10 times the 2014 level of 28.9 million (EIA Electric Power Annual, Oct 2025).
Are energy employers competing for electricians?
The Department of Energy’s jobs report says energy employers compete with data centers, infrastructure projects and factories for electricians and other skilled trades.
- The US energy economy employed 8.4 million workers in 2025, down 1%, while transmission, distribution and storage employed 1.5 million, up 28,000 (DOE USEER, Aug 2026).
- Construction, installation and repair jobs made up 30%, or 414,000 workers, of the transmission, distribution and storage workforce (DOE USEER, Aug 2026).
- 67% of transmission, distribution and storage employers had trouble hiring in 2025 (DOE USEER, Aug 2026).
- 70% of electric power generation establishments that hired in 2025 reported hiring difficulty (DOE USEER, Aug 2026)
- 22% of construction employers in that sector named electricians and construction workers as the hardest to hire (DOE USEER, Aug 2026).
- Employment tied to certified data center equipment grew 9%, or 1,100 workers, in 2025 (DOE USEER, Aug 2026).
- DOE restarted its $8.8 billion Home Energy Rebate program in 2026, which the report expects to raise demand for electricians and other installers (DOE USEER, Aug 2026).
How dangerous is electrical work?
The trade has a real injury risk. The rate for electricians is above the rate for all workers and below the rate for power-line work.
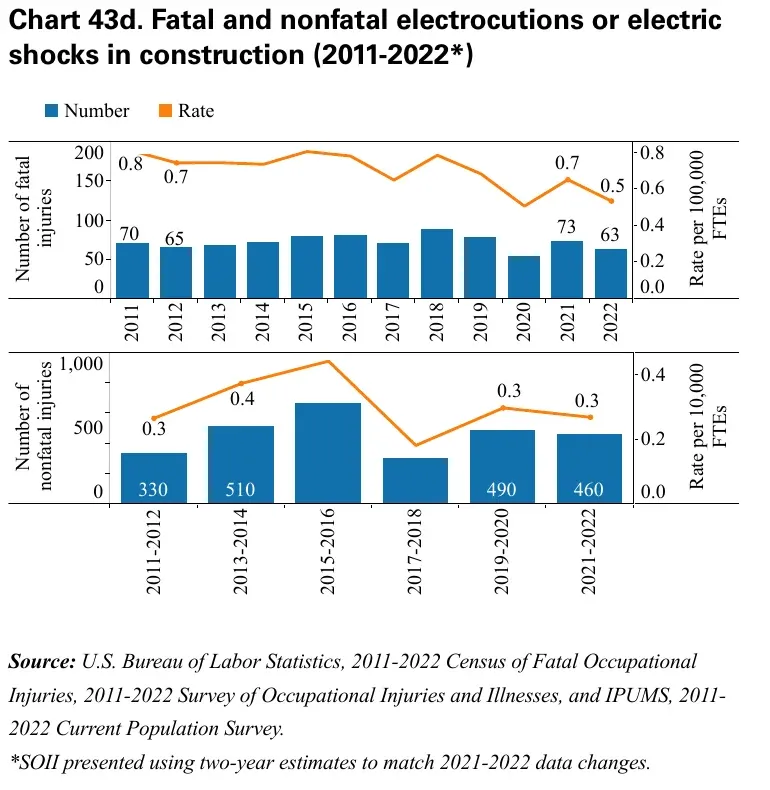 Figure 7: Electrocution deaths in construction have eased since 2011, but one spike year shows the hazard has not gone away. Source: CPWR, The Construction Chart Book 7th edition, chart 43d, Sep 2025. Chart published by the source, captured 20 Oct 2026, using BLS data for 2011 to 2022.
How many electricians die at work?
BLS counts every work death each year. Among electricians, the recorded causes were exposure to harmful substances or environments, falls and contact incidents.
- 53 electricians and 3 electrician helpers died from work injuries in 2024 (BLS Census of Fatal Occupational Injuries, Feb 2026).
- Of the 53 electrician deaths, 24 came from exposure to harmful substances or environments, 11 from falls and 8 from contact incidents (BLS Census of Fatal Occupational Injuries, Feb 2026).
- Exposure to electricity killed 130 workers across all occupations in 2024, down from 142 in 2023 (BLS Census of Fatal Occupational Injuries Event Table, Feb 2026).
- Electrical contractors had 59 fatal work injuries in 2024, including 17 from falls (BLS Census of Fatal Occupational Injuries Industry Table, Feb 2026).
- Electrical power-line installers died at a rate of 13.8 per 100,000 full-time workers, against 12.6 for all construction and extraction occupations (BLS Census of Fatal Occupational Injuries Rates, Feb 2026).
- Self-employed workers died at a rate of 10.8 per 100,000, against 2.9 for wage and salary workers, which matters for one-person shops (BLS Census of Fatal Occupational Injuries Rates, Feb 2026).
What does the construction research say about electrical injuries?
Researchers at CPWR tracked electrocutions in construction over time.
- Construction electrocution deaths fell from 70 in 2011 to 63 in 2022, with a high of 89 in 2018 (CPWR Construction Chart Book, Sep 2025).
- Nonfatal electrocutions or electric shocks in construction rose from 330 in 2011 and 2012 to 460 in 2021 and 2022 (CPWR Construction Chart Book, Sep 2025).
- Specialty trade contractors averaged 52 fatal electrical injuries a year from 2011 to 2023 (CPWR Construction Chart Book, Sep 2025).
What is the job like day to day?
O*NET asks working electricians how often they face risks. The answers show a job done in hazardous, physical conditions.
- 73% of electricians said they are exposed to hazardous conditions every day (O*NET OnLine Summary, Oct 2026).
- 66% said they are exposed to hazardous equipment every day (O*NET OnLine Summary, Oct 2026).
- 66% said they climb ladders, scaffolds or poles continually or almost continually (O*NET OnLine Summary, Oct 2026).
- 95% said they wear common protective equipment every day (O*NET OnLine Summary, Oct 2026).
- 84% said they bend or twist their body continually or almost continually (O*NET OnLine Summary, Oct 2026).
- 65% said they are exposed to minor burns, cuts, bites or stings every day (O*NET OnLine Summary, Oct 2026).
- 93% said they have face-to-face discussions every day and 81% said they talk by phone every day (O*NET OnLine Summary, Oct 2026)
- 76% said being exact or accurate is extremely important (O*NET OnLine Summary, Oct 2026)
- 69% said they carry very high responsibility for the health and safety of other workers (O*NET OnLine Summary, Oct 2026).
How often does electrical failure start home fires?
Electrical malfunction is a steady cause of fires, both in homes and in other buildings.
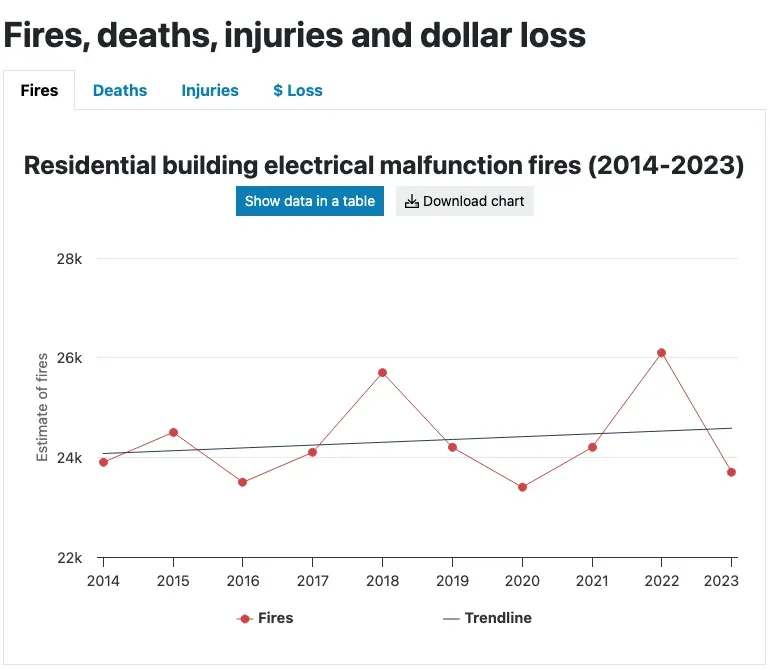 Figure 8: Electrical malfunction fires moved in a narrow band between 23,000 and 26,000 a year over the decade, so the problem is steady, not shrinking. Source: US Fire Administration, Residential Building Electrical Malfunction Fire Trends 2014 to 2023, Feb 2025. Screenshot of the source page, captured 20 Oct 2026.
What do electrical fires cost?
The human and money cost is large for a cause that is mostly preventable.
- Electrical malfunction fires injured 800 people and caused $1,501,600,000 in losses in 2023 (US Fire Administration, Feb 2025).
- From 2014 to 2023 these fires rose 2%, deaths fell 19%, injuries rose 2% and inflation-adjusted losses rose 28% (US Fire Administration, Feb 2025).
- The 2022 count of 26,100 fires was the highest of the decade (US Fire Administration, Feb 2025).
How do electrical fires compare with other causes?
Cooking is the leading cause by a wide margin, and electrical malfunction runs close to heating.
- Electrical malfunction also started 7,400 fires in nonresidential buildings in 2023, with $354,400,000 in losses (US Fire Administration Nonresidential Fires, Feb 2025).
- Cooking started 167,800 home fires in 2023 and heating started 27,900 (US Fire Administration Causes, Feb 2025).
For the workforce side of these jobs, see HVAC technician statistics and skilled trade shortage statistics.
Methodology and Sources
We chose each figure from the agency, regulator or research body that produced it, opened the source page or data file, and read the number there. We did not use roundups or other statistics pages. Where a source posts only a data file, we link the file. Some figures are sums or ratios of source numbers, such as locations with fewer than 10 employees, and the text says so. Regulatory pages that carry no publication date show the month we checked them. The 2025 Current Population Survey figures are 11-month averages, because BLS did not collect October 2025 data during the federal shutdown. We review the page every month and update numbers when a source posts a new release.
Sources
- BLS Census of Fatal Occupational Injuries
- BLS Census of Fatal Occupational Injuries Event Table
- BLS Census of Fatal Occupational Injuries Industry Table
- BLS Census of Fatal Occupational Injuries Rates
- BLS Current Population Survey
- BLS Current Population Survey
- BLS Employment Projections
- BLS Employment Projections
- BLS Employment Projections
- BLS Occupational Outlook Handbook
- BLS OEWS Industry Estimates
- BLS OEWS National Estimates
- BLS OEWS State Estimates
- BLS QCEW
- BLS QCEW
- BLS QCEW
- Census Bureau County Business Patterns
- Census Bureau Economic Census
- Census Bureau Economic Census Kind of Business
- Census Bureau Nonemployer Statistics
- Census Bureau Nonemployer Statistics
- CPWR Construction Chart Book
- DOE and LBNL
- DOE USEER
- EIA Annual Energy Outlook
- EIA Annual Energy Outlook Narrative
- EIA Electric Power Annual
- EIA Short-Term Energy Outlook
- EIA Short-Term Energy Outlook
- O*NET OnLine Details
- O*NET OnLine Summary
- Texas TDLR
- Texas TDLR
- Texas TDLR
- Texas TDLR
- Texas TDLR
- US Fire Administration
- US Fire Administration Causes
- US Fire Administration Nonresidential Fires
Glossary
- BLS: Bureau of Labor Statistics, the US agency that measures jobs, pay and workplace injuries.
- CBP: County Business Patterns, a Census Bureau count of business locations with paid employees.
- CFOI: Census of Fatal Occupational Injuries, the BLS count of work deaths.
- CPS: Current Population Survey, a monthly BLS household survey.
- CPWR: The Center for Construction Research and Training, a research group for construction trades.
- DOE: US Department of Energy.
- EIA: US Energy Information Administration, the statistics agency inside DOE.
- LBNL: Lawrence Berkeley National Laboratory, a DOE lab.
- NAICS: North American Industry Classification System, the code system for industries. Electrical contractors are 238210.
- OEWS: Occupational Employment and Wage Statistics, the BLS employer survey of jobs and pay.
- QCEW: Quarterly Census of Employment and Wages, a BLS count built from unemployment insurance records.
- TDLR: Texas Department of Licensing and Regulation, which licenses Texas electricians.
- TDS: Transmission, distribution and storage, a DOE energy jobs sector.
- USEER: US Energy and Employment Report, the DOE jobs survey.
- USFA: US Fire Administration, part of FEMA.